
Workplace Safety Statistics By Industry, Demographic, Mental Health And Psychological Safety
Updated · Aug 13, 2024

WHAT WE HAVE ON THIS PAGE
- Introduction
- Editor’s Choice
- What is Workplace Safety?
- Why is Workplace Safety Important?
- Workplace Injury By Industry Statistics
- Workplace Injury Statistics By Demographics
- Most Expensive Workers Injury Statistics in 2023
- Top 10 Causes of Disabling Workplace Injury in the U.S. By Cost
- Worker’s Fatalities By Common Mechanism And Occupation Statistics
- Workplace Injuries Cost to Business and Mental Ill Health Statistics
- Workplace Safety Recent Statistics
- Ways To Build A Safe Working Surrounding
- Conclusion
Introduction
Workplace Safety Statistics: Do you think your workplace is dangerous? If you work in high-risk areas like law enforcement, emergency services, or agriculture, you might. But accidents can happen in any job, from offices to construction sites. Falls cause injuries to millions of workers each year, whether they’re in retail, admin, or on a construction site. Workplace accidents are a problem for everyone.
They lead to medical and insurance costs, lost productivity, and lost wages. Plus, they can lower morale and engagement among employees. To tackle these issues, it’s important to understand Workplace Safety Statistics. Let’s look at some interesting numbers.
Editor’s Choice
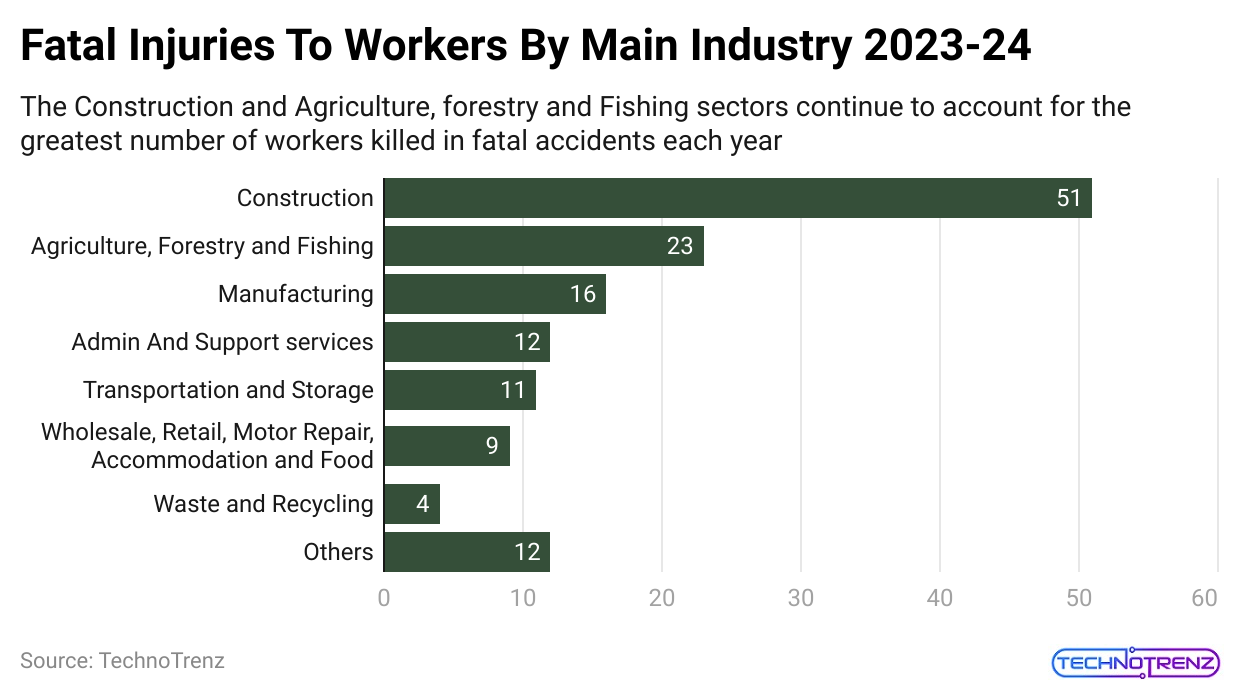
- The construction industry was responsible for over 22% of all fatal workplace accidents.
- Non-fatal accidents were most common in the manufacturing industry (19.2%), the health and social work sector (13.5%), the construction industry (12.9%), and the retail sector (12.5%).
- Workplace Safety Statistics stated that the most frequent work injuries were wounds and superficial injuries (28.0%) and dislocations, sprains, and strains (26.0%).
- Among 288,800 men with work-related injuries, 24% were technicians and trades workers, 15% were machinery operators and drivers, and another 15% were laborers.
- The highest rate of work-related injuries or illnesses was seen in people aged 55 to 59 years at 4.7%, followed by those aged 20 to 24 years at 4.0%.
What is Workplace Safety?
Safety is a top priority in every workplace where employees perform their tasks, create products, or offer services. Employers need to be careful with the materials used in construction, as well as with furniture and machines. They should also ensure that tools and electrical equipment are safe and don’t pose any hazards. These safety measures are necessary for working conditions to become safe.
Why is Workplace Safety Important?
The effects of workplace accidents are hard to measure, but they can seriously impact employees, their families, and friends. That’s why having strong safety and health measures at work is so important. Feeling secure that you’ll come home safely from work is crucial.
Every workplace has its own safety and health risks. These can include unsafe conditions, environmental dangers, substance abuse, and workplace violence. For example, IT workers might deal with faulty wires or equipment, while construction workers might face risks from heavy machinery.
To manage these risks, employers should create plans to ensure safety. They should also understand what employees need to feel safe and protected, which can boost productivity and improve work quality.
Here are some Benefits of a Safe and Healthy Workplace:
- Increased Productivity: A safer workplace helps employees work more efficiently. They can get more done in less time, which lowers costs.
- Better Health: A safe environment promotes better health. Healthier employees work better and are generally happier.
- Fewer Accidents: Fewer accidents mean less downtime and lower costs for workers’ compensation. Employees also spend less time recovering from injuries.
- Lower Equipment Costs: Preventing injuries and equipment damage reduces replacement and repair costs, which can increase profits.
- Greater Confidence and Focus: When employers show they care about safety, employees feel more confident and focused, leading to lower absenteeism and better work performance.
Workplace Injury By Industry Statistics
 (Reference: hse.gov.uk)
Manufacturing Jobs:
- About 15% of workplace injuries in the U.S. happen in manufacturing.
- In 2019, manufacturing had the highest rate of non-fatal injuries, with 3.3 incidents per 100 employees, totaling 421,400 injuries or illnesses.
- Out of these, 64,640 workers missed at least one day of work. Breakdown of missed work:
- 28% (32,470) had sprains, strains, or tears.
- 5% (16,790) had soreness or pain.
- 3% (15,380) had cuts, lacerations, or punctures.
Construction Industry:
- The construction industry has one of the highest rates of job-related deaths in the U.S.
- According to OSHA, in 2019, 20% of all worker deaths in private industries were in construction, totaling 1,061 fatalities. On average, this means three construction workers die every day.
Line Cooks:
- Line cooks are at the highest risk of contracting COVID-19 on the job.
- A study from the University of California, San Francisco, found that line cooks had a 60% higher chance of dying from COVID-19 during the pandemic.
- Workplace Safety Statistics stated that the increased risk also affected cooks, warehouse workers, agricultural workers, bakers, and construction workers.
Construction Site Injuries:
- In 2019, 79,660 injuries occurred at construction sites, making up nearly 9% of all workplace injuries. These included:
- Twenty-one thousand one hundred seventy sprains, strains, and tears.
- 13,190 fractures.
- Ten thousand nine hundred fifty cuts, lacerations, and punctures.
Gender Differences in Injury Rates:
- Men in the private sector are 7% more likely to be injured than men in government jobs.
- In 2019, 60% of workplace injuries in the private sector were to men, while in government jobs, 53% of injuries were to men.
Workplace Injury Statistics By Demographics
(Source: proxxi.co)
- At-Risk Age Groups: Older workers (ages 55 to 64) who get sick on the job usually need about 14 days to recover. In comparison, younger workers (ages 16 to 24) typically take around five days off for injuries.
- Injury Types by Gender: Women are more likely to be injured from harmful exposures or road accidents, while men have a higher risk of fatal injuries from contact with objects, equipment, or falls
- Most Dangerous States: In 2023, New York, Texas, and California are the most hazardous states for workers in the U.S.
 (Reference: hse.gov.uk)
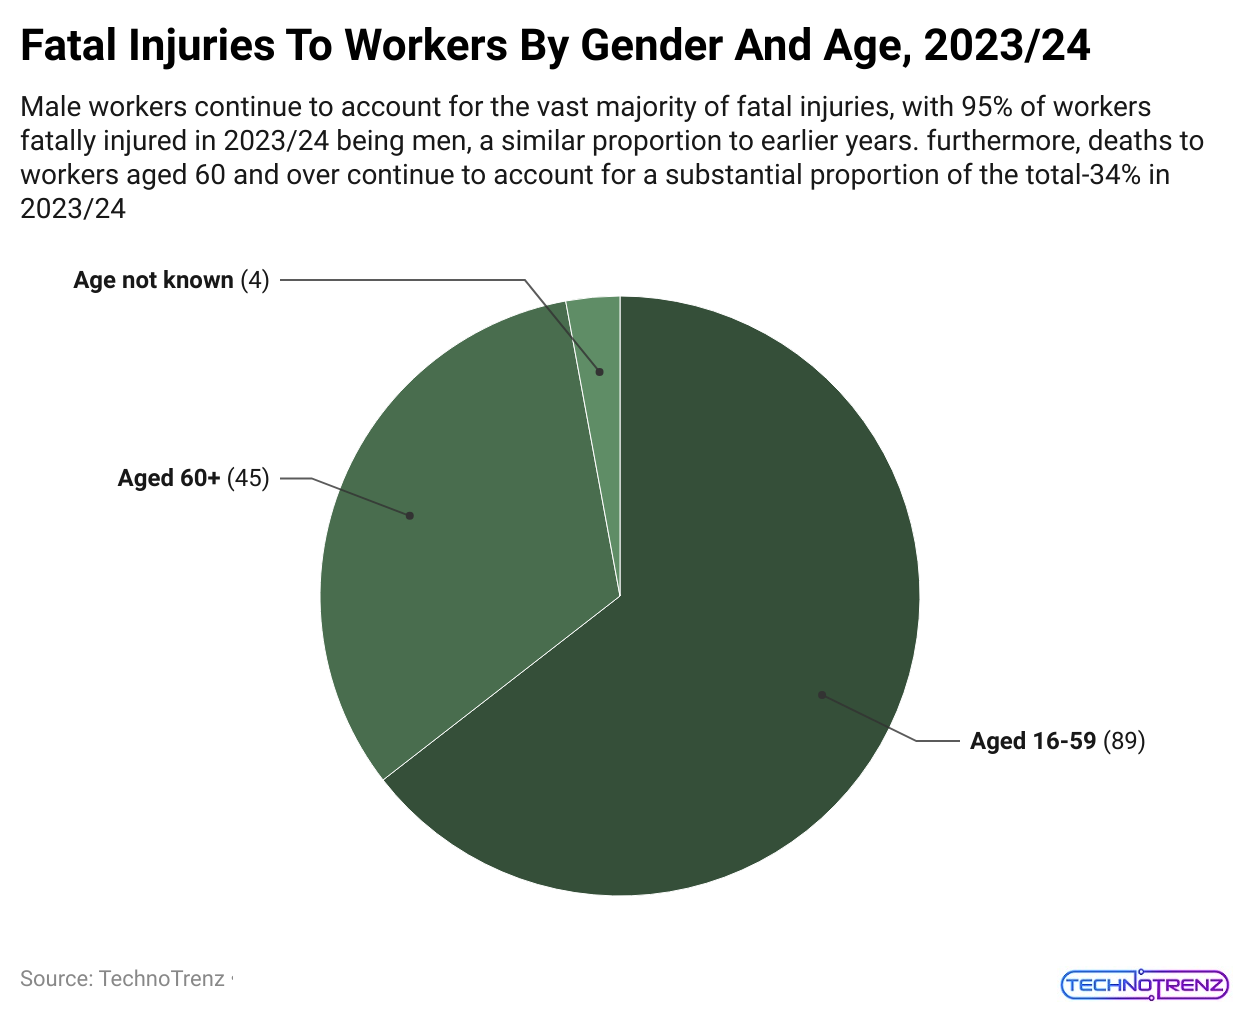
- In the above pie chart, we can study the fatal injuries to workers by gender and age in 2023 and 2024.
- Gender Injury Rates: Men are 17.3% more likely to get injured at work than women.
- Many people think that newer or less experienced workers are more likely to get hurt, but the data tells a different story.
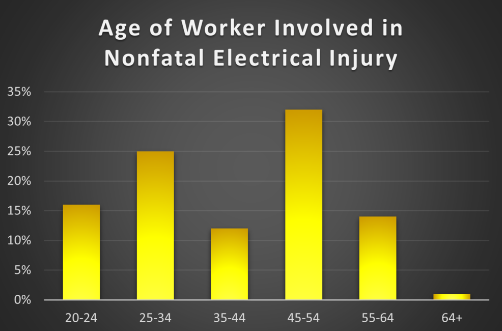
- Workers aged 45-54 are the most likely to have non-fatal electrical injuries, accounting for 32% of these cases. Workers aged 25-34 are next with 25%, and other age groups have less than 20%.
- Workplace Safety Statistics stated that workers in the 45-54 age range also take the most time off from work due to injuries. They average 12 days off, which is 10% more than those aged 24-34 and 35-44, who take 8 and 6 days off, respectively.
- For electrical fatalities, workers aged 25-34 are the most at risk, making up 30% of these deaths. The risk of dying from electrical incidents decreases with age.
Most Expensive Workers Injury Statistics in 2023
|
Amputation |
$118,837 per injury average cost |
| Fracture or Dislocation |
$60,934 per injury average cost |
|
Other Traumas |
$60,228 per injury average cost |
| Burns |
$48,671 per injury average cost |
|
Infection or Inflammation |
$37,498 per injury average cost |
| Sprain or Strain |
$33,589 per injury average cost |
|
Carpal Tunnel Syndrome |
$33,477 per injury average cost |
| Lacerations, Punctures, and Ruptures |
$33,348 per injury average cost |
|
Concussion |
$33,151 per injury average cost |
| Occupational Diseases and Degeneration |
$16,696 per injury average cost. |
Top 10 Causes of Disabling Workplace Injury in the U.S. By Cost 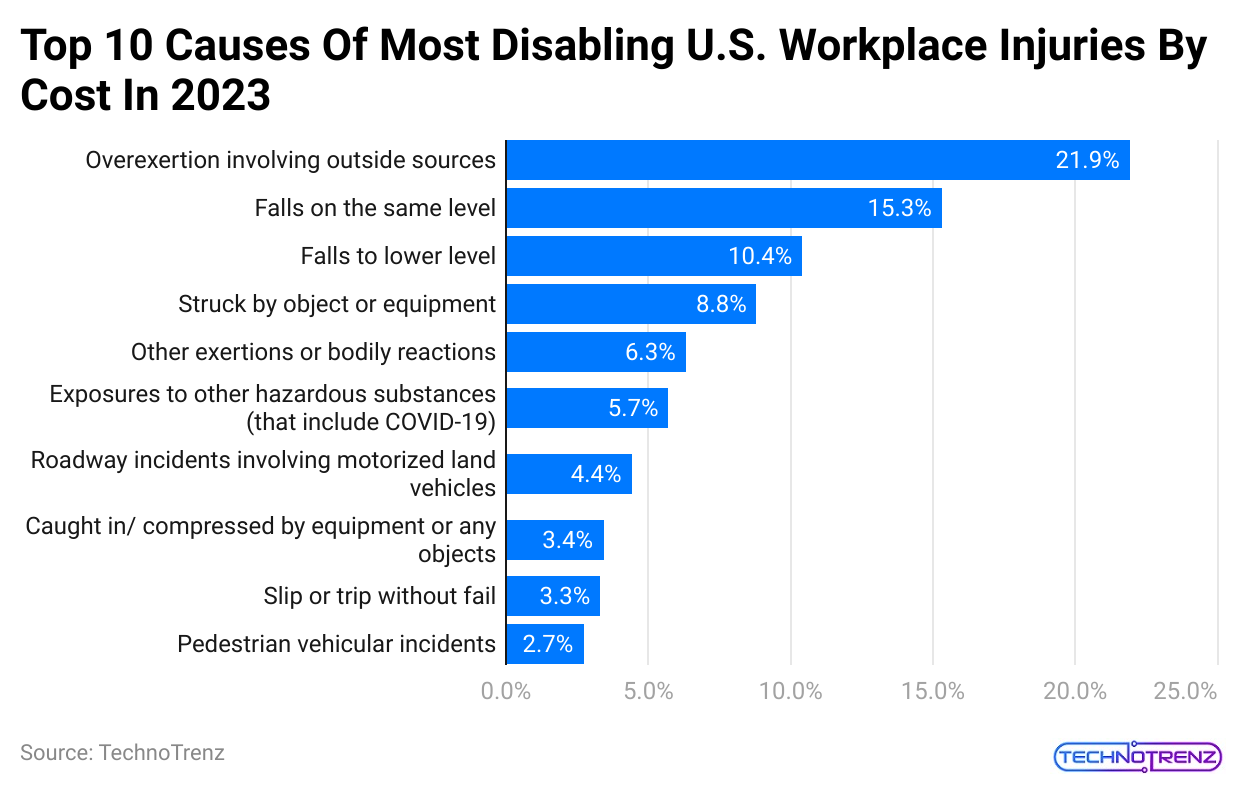
(Reference: statista.com)
- In 2023, falls on the same level represented 15% of the total costs for disabling injuries in U.S. workplaces. The direct costs for these falls were around $8.98 billion that year, as stated in Workplace Safety Statistics.
- This data highlights the top 10 causes of the most expensive disabling injuries in U.S. workplaces in 2023.
|
Overexertion involving outside sources |
21.9% |
| Falls on the same level |
15.3% |
|
Falls to lower level |
10.4% |
| Struck by object or equipment |
8.8% |
|
Other exertions or bodily reactions |
6.3% |
| Exposures to other hazardous substances (that include COVID-19) |
5.7% |
|
Roadway incidents involving motorized land vehicles |
4.4% |
| Caught in/ compressed by equipment or any objects |
3.4% |
|
Slip or trip without fail |
3.3% |
| Pedestrian vehicular incidents |
2.7% |
Worker’s Fatalities By Common Mechanism And Occupation Statistics
 (Reference: safeworkaustralia.gov.au)
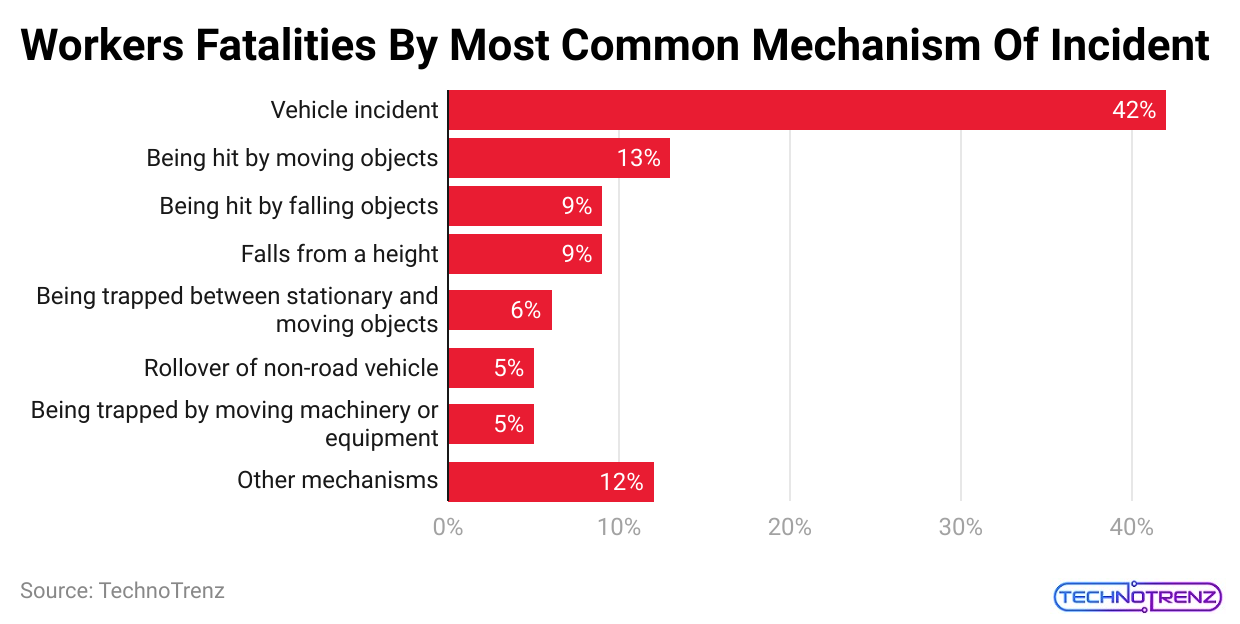
- The mechanism of an incident refers to the actions or events that lead to a worker’s death.
- According to Workplace Safety Statistics, over half (55%) of worker deaths were due to vehicle incidents (81 workers; 42%) and being hit by moving objects (26 workers; 13%).
- Workplace Safety Statistics state that vehicle incidents include deaths where someone in a vehicle is killed in a crash with another vehicle or a stationary object.
- This covers not only cars and trucks but also other types of vehicles, such as airplanes, boats, loaders, tractors, and quad bikes.
- Being hit by moving objects involves worker deaths when they are struck by vehicles or other moving equipment and objects while on foot, as stated by Workplace Safety Statistics.
 (Reference: hse.gov.uk)
|
Mechanism of Incidents |
Fatalities in number | Fatalities in percentage |
| Being trapped by moving machinery or equipment | 10 |
5% |
|
Rollover of non-road vehicle |
10 | 5% |
| Being trapped between stationary and moving objects | 11 |
6% |
|
Falls from a height |
17 | 9% |
| Being hit by a falling object | 17 |
9% |
|
Being hit by moving objects |
26 | 13% |
| Vehicle incident | 81 |
42% |
|
Other mechanisms |
23 |
12% |
- As per Workplace Safety Statistics, Machinery Operators and Drivers had the highest percentage of worker deaths, accounting for 38% of all fatalities.
- They also had the highest fatality rate, with 8.4 deaths per 100,000 workers, as stated by Workplace Safety Statistics.
- This rate is significantly higher than other jobs, where the fatality rate was less than three deaths per 100,000 workers.
|
Occupation |
Fatalities numbers wise | Fatalities rate |
| Sales workers | 0 |
0 |
|
Clerical and administrative workers |
2 | 0.1 |
| Community and personal service workers | 9 |
0.6 |
|
Professionals |
16 | 0.5 |
| Technicians and trades | 28 |
1.5 |
|
Managers |
32 | 1.8 |
| Laborers | 34 |
2.9 |
|
Machinery operators and drivers |
74 |
8.4 |
- Men filed more than twice as many serious workers’ compensation claims for being hit by moving objects and vehicle incidents compared to women.
- They also filed three times as many claims for hitting objects with their bodies.
- On the contrary, workers’ compensation claims for mental stress were more than two times as grown for females (12.5%) as they were for males (6.0%), as stated by Workplace Safety Statistics.
|
Mechanism of incidents |
Males Claims count | Male Claims in Percentage | Females Claims count | Females Claim in percentage | Total Claims count | Total Claims in percentage |
| Neoplasma (cancer) | <100 | 0.1% | <100 | 0.0% | 100 |
0.0% |
|
Circulatory system diseases |
100 | 0.1% | <100 | 0.1% | 100 | 0.1% |
| Injury to nerves and spinal cord | 100 | 0.1% | <100 | 0.1% | 100 |
0.1% |
|
Respiratory system diseases |
100 | 0.1% | 100 | 0.3% | 200 | 0.2% |
|
Skin and subcutaneous tissue diseases |
200 | 0.3% | 200 | 0.4% | 400 | 0.3% |
| Intracranial injuries | 600 | 0.7% | 500 | 1.0% | 1,100 |
0.8% |
|
Nervous system and sense organ diseases |
600 | 0.8% | 500 | 1.1% | 1,100 | 0.9% |
| Burns | 1,100 | 1.4% | 600 | 1.2% | 1,700 |
1.4% |
|
Digestive system diseases |
1,700 | 2.2% | 100 | 0.2% | 1,800 | 1.4% |
| Infectious and parasitic diseases | 4,900 | 6.4% | 4,500 | 9.0% | 9,700 |
7.6% |
|
Mental health conditions |
5,000 | 6.5% | 6,700 | 13.4% | 11,700 | 9.2% |
| Fractures | 8,900 | 11.5% | 4,700 | 9.3% | 13,600 |
10.6% |
| Musculoskeletal and connective tissue diseases |
9,900 |
12.7% | 7,600 | 15.3% |
17,500 |
13.7% |
|
Wounds, lacerations, amputations, and internal organ damage |
13,600 | 17.6% | 4,600 | 9.3% | 18,300 | 14.3% |
|
Traumatic joint/ligament and muscle/tendon injury |
28,400 | 36.7% | 18,300 | 36.7% | 46,800 |
36.6% |
|
Other claims, injuries, and diseases |
2,200 | 2.8% | 1,300 | 2.7% | 3,500 |
2.7% |
Workplace Injuries Cost to Business and Mental Ill Health Statistics
- The HSE estimates that an astonishing 35.2 million working days were lost in 2022/23 due to work-related health issues and non-fatal injuries.
- This includes 3.7 million days lost to injuries and 31.5 million days lost to health problems, highlighting the major cost to businesses that don’t focus on health.
- Workplace Safety Statistics stated that stress, depression or anxiety, and musculoskeletal disorders (MSDs) were the biggest causes of lost days due to work-related health problems, accounting for 17.1 million and 6.6 million days, respectively.
On average, each person who was affected missed about 15.8 days of work. Here’s how it breaks down:
- 6 days off for injuries
- 8 days off for health problems
- 6 days off for stress, depression, or anxiety
- 9 days off for MSDs
- Companies need to see the clear connection between poor health and safety practices, higher absenteeism, and lower productivity.
It’s crucial to take proactive steps to prevent injuries and improve mental health to create a stronger and more successful workplace in the year ahead as per Workplace Safety Statistics.
 (Reference: linkedin.com)
- Stress, depression, and anxiety are still the top causes of work-related health problems, making up 49% of all such cases.
- It’s not surprising that industries with higher rates of these issues include healthcare and social work, public administration and defense, and education.
- In 2022/23, 875,000 workers dealt with work-related stress, depression, or anxiety.
- Workplace Safety Statistics stated that this equals a rate of 2,590 cases per 100,000 workers, which is higher than the pre-pandemic level in 2018/19.
(Reference: nsc.org)
- Musculoskeletal disorders (MSDs) continue to be the second most common cause of work-related health problems, accounting for 27% of all cases.
- In the same period, 473,000 workers suffered from new or ongoing work-related MSDs, which is a rate of 1,400 per 100,000 workers as stated by Workplace Safety Statistics.
- The most affected areas were the upper limbs or neck (196,000 cases) and the back (195,000 cases).
Workplace Safety Recent Statistics
-
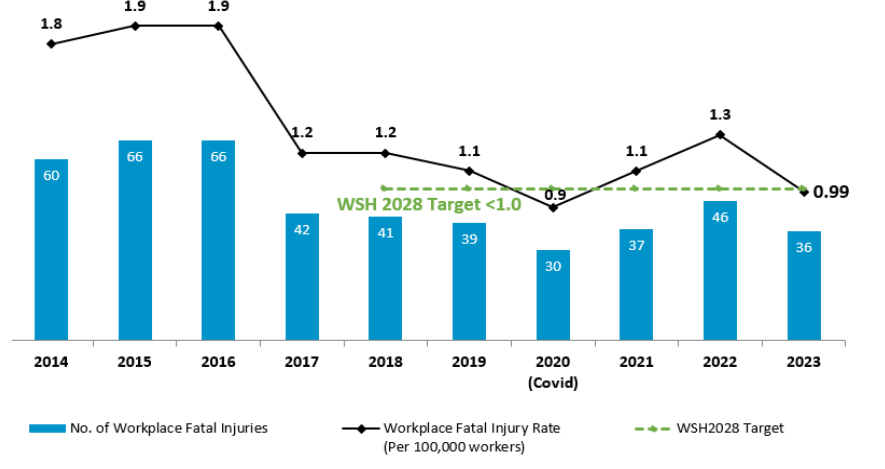
Number and rate of workplace fatal injuries, 2014-2023
 (Source: mom.gov.sg)
|
Year |
Workplace Fatal Injuries Rate(Per 100,000 workers) | Number of Workplace Fatal Injuries |
| 2014 | 1.8 |
60 |
|
2015 |
1.9 | 66 |
| 2016 | 1.9 |
66 |
|
2017 |
1.2 | 42 |
| 2018 | 1.2 |
41 |
|
2019 |
1.1 | 39 |
| 2020 | 0.9 |
30 |
|
2021 |
1.1 | 37 |
| 2022 | 1.3 |
46 |
|
2023 |
0.99 |
36 |
-
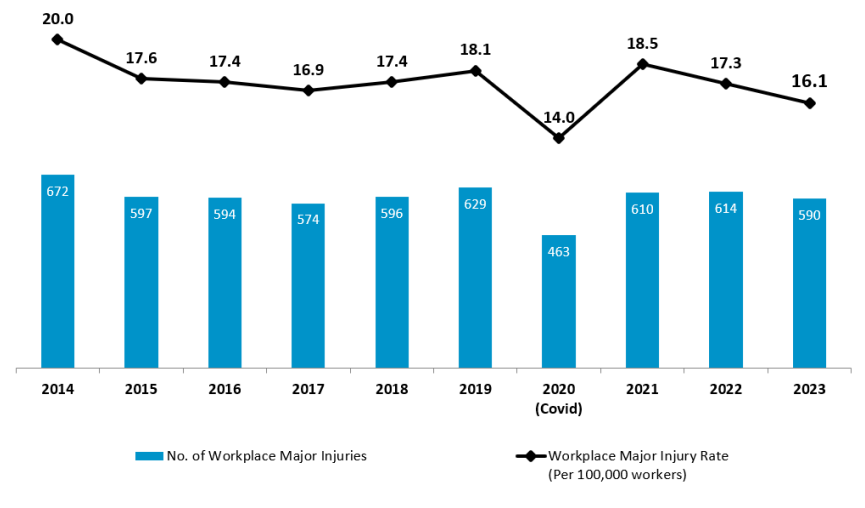
Number and rate of workplace major injuries, 2014-2023
 (Source: mom.gov.sg)
|
Year |
Number of Workplace Major Injuries | Workplace Major Injuries Rate (Per 100,000 workers) |
| 2014 | 672 |
20.0 |
|
2015 |
597 | 17.6 |
| 2016 | 594 |
17.4 |
|
2017 |
574 | 16.9 |
| 2018 | 596 |
17.4 |
|
2019 |
629 | 18.1 |
| 2020 | 493 |
14.0 |
|
2021 |
610 | 18.5 |
| 2022 | 614 |
17.3 |
|
2023 |
590 |
16.1 |
Ways To Build A Safe Working Surrounding
- Employers must first identify hazards and safety issues in the workplace and then take steps to address them.
#1. Common Workplace Hazards Include:
- Mechanical Problems: Issues with machinery can happen at times, and working with heavy equipment is risky.
- Dangerous Chemicals: Chemicals can burn, poison, or even kill if they are inhaled or swallowed.
- Electrical Hazards: Faulty electrical equipment can cause electric shocks.
To manage these hazards, employees should understand the equipment and potential risks in their workplace. For instance, metal detectors can help spot hidden metal hazards in food packaging areas. Employers should also provide training on how to use and maintain machinery properly.
#2. Setting Up Workplace Safety Programs
- Creating a safety program starts with getting all employees to commit to safety. Including safety in the company’s mission statement can help.
- Everyone should be responsible for following safety policies.
- Employers should investigate all workplace accidents and encourage employees to follow safety procedures as stated by Workplace Safety Statistics.
- Clearly stating the consequences of not following safety rules can help reduce mistakes.
#3. Providing Safety Training
- Training is crucial to protect employees from accidents.
- Studies show that new employees are more likely to have accidents because they may not be aware of workplace hazards or safe work practices.
- Employers should provide training so employees can use machinery and equipment safely. Only trained or certified employees should operate heavy machinery. Expert-led safety training is essential.
#4. Using Protective Safety Gear
- Wearing safety equipment is important to avoid injuries. Without it, employees might face serious injuries or even death.
- Employees working with chemicals, machines, or electronics need personal protective equipment (PPE).
- PPE should be well-designed, safe, and comfortable. Examples of PPE include gloves, safety goggles, protective clothing, earplugs, and hard hats.
#5. Reporting Unsafe Conditions
- Employees should report any safety hazards or risks to management.
- Employers are legally required to provide a safe working environment and address any safety issues.
#6. Practicing Good Posture
- Poor posture can lead to back pain. Proper posture is important to avoid injury. For example, use specially designed chairs if you sit for long periods and always sit up straight.
- Reducing Workplace Stress
- Workplace stress can lead to health problems like anxiety and depression. Stress can be caused by job insecurity, bullying, or high workloads.
- Finding ways to manage workplace stress can prevent its negative effects on health and productivity.
#7. Taking Regular Breaks
- Employers should encourage employees to take regular breaks. Breaks help prevent fatigue and keep employees fresh and focused, reducing the risk of injuries and illnesses.
#8. Staying Sober and Alert
- Substance abuse is a major cause of workplace deaths, responsible for about 40% of all industrial fatalities.
- Being under the influence of drugs or alcohol impairs alertness and coordination, increasing the risk of accidents.
#9. Ensuring Easy Access to Emergency Exits
- In emergencies, having easy access to exits is important to minimize injuries and deaths. It’s also crucial to have quick ways to shut down equipment.
#10. Using Mechanical Aids
- When working with heavy objects, it’s safer to use mechanical aids like conveyor belts, forklifts, or wheelbarrows instead of lifting manually. This reduces the risk of injury.
Conclusion
A safe work environment is a sign of a good company anywhere in the world. Employees want to be sure that they are safe and protected. Workplace safety is very important. Employers must make sure their employees are working in a safe setting. Managers and business owners are in charge of promoting safety at work. They should encourage employees to follow safe practices and use safety gear. Employers should also support safety policies and programs. Employees need to be aware of the dangers involved in operating hazardous machinery.
Sources
FAQ.
Each day, around 6,000 people die from work-related accidents or illnesses, totalling over 2.2 million work-related deaths each year. Of these, about 350,000 are due to workplace accidents, and more than 1.7 million are from work-related diseases.
The accident rate measures the number of accidents that occur in a workplace over a specific time period relative to the number of employees. It is a key indicator of how well a company is ensuring safety and protecting its workers from hazards.

Saisuman is a professional content writer specializing in health, law, and space-related articles. Her experience includes designing featured articles for websites and newsletters, as well as conducting detailed research for medical professionals and researchers. Passionate about languages since childhood, Saisuman can read, write, and speak in five different languages. Her love for languages and reading inspired her to pursue a career in writing. Saisuman holds a Master's in Business Administration with a focus on Human Resources and has worked in a Human Resources firm for a year. She was previously associated with a French international company. In addition to writing, Saisuman enjoys traveling and singing classical songs in her leisure time.