QR Code Statistics By Usage, Adoption, Regions, Behavior, Demographics, Benefits, Impacts And Future
Updated · Oct 11, 2024

WHAT WE HAVE ON THIS PAGE
- Introduction
- Editor’s Choice
- Types Of QR Codes
- General QR Code Statistics
- QR Code Usage Statistics
- QR Code Adoption Statistics
- QR Codes Application Statistics
- Companies That Use QR Code
- QR Code Regional Statistics
- Consumer Behavior QR Code Statistics
- QR Code Demographics Statistics
- Benefits Of QR Codes To Businesses And Consumers
- Impact Of COVID-19 On QR Code Statistics
- How Businesses Are Using QR Codes
- QR Code Future Predictions
- Conclusion
Introduction
QR Code Statistics: In today’s digital world, QR codes are becoming very popular. Businesses and individuals are using these codes more and more, leading to a global increase in their use. It’s important to understand how QR codes work and their benefits to see why they’re being adopted so widely. QR codes, or Quick Response codes, are two-dimensional barcodes that can be scanned with a smartphone or a special QR code reader.
These codes can store information like website links, contact info, or other types of data. The ease of scanning a QR code makes it handy for both businesses and customers. Because of this, many businesses are taking advantage of QR codes for various uses. We shall shed more light on QR Code Statistics through this article.
Editor’s Choice
- The number of people in the United States who scan QR codes with their smartphones is expected to increase by 16 million from 2022 to 2025.
- According to QR Code Statistics, around 84% of mobile users have scanned a QR code at least once.
- The number of U.S. households scanning QR codes grew from 9.76 million in 2018 to 11 million in 2023.
- The market for QR code labels is predicted to reach an impressive $2.1 billion by 2027, growing at a strong annual rate of 8.9%, which presents great opportunities for businesses.
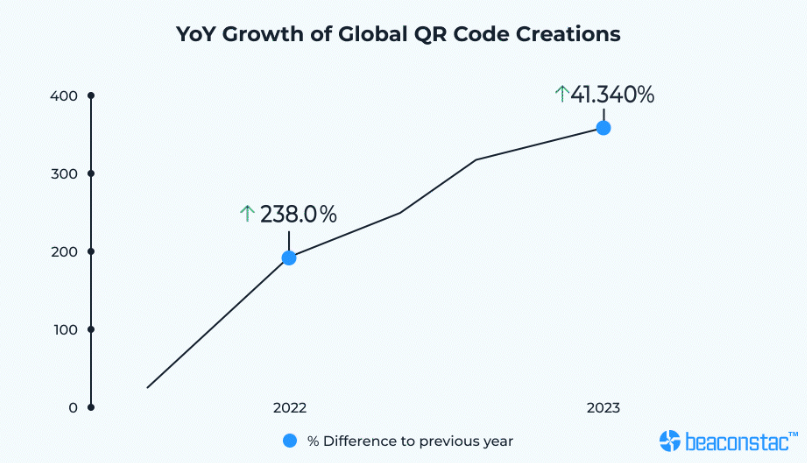
- Black is the most common color for QR codes, preferred by 85% of users. In 2022, the U.S. generated over 200,000 QR codes, a huge 248% increase from 2021.
- By 2024, about 89.5 million Americans are expected to scan QR codes with their smartphones. The creation of QR codes rose by 43% in 2023.
- Big brands like Starbucks, IKEA, General Motors, Walmart, and Nike are using QR codes.
- More than half of China’s population interacts with QR codes several times a week.
- QR Code Statistics stated that Chinese users typically engage with QR codes 10-15 times a day.
- QR codes provide important benefits in marketing across many industries.
- Marketing and advertising lead the way in QR code usage, with retail and logistics following closely behind.
- According to QR Code Statistics, healthcare and other sectors are also starting to adopt QR codes, seeing their potential to improve efficiency and engagement.
- By understanding how various industries use QR codes in marketing, you can find new and creative ways to apply them in your own business.
- 55% of people would like to see more QR codes on physical items for information and deals.
Types Of QR Codes
If you’re asking, “What does a QR code look like?” QR codes are typically black and white, but they can come in various colors and backgrounds. Additionally, many types of QR codes are designed for specific uses. Right now, more than 20 different QR code types or solutions are available for various purposes.
Each type has its capacity for storing information, size, and level of error correction, which affects how each QR code is used.
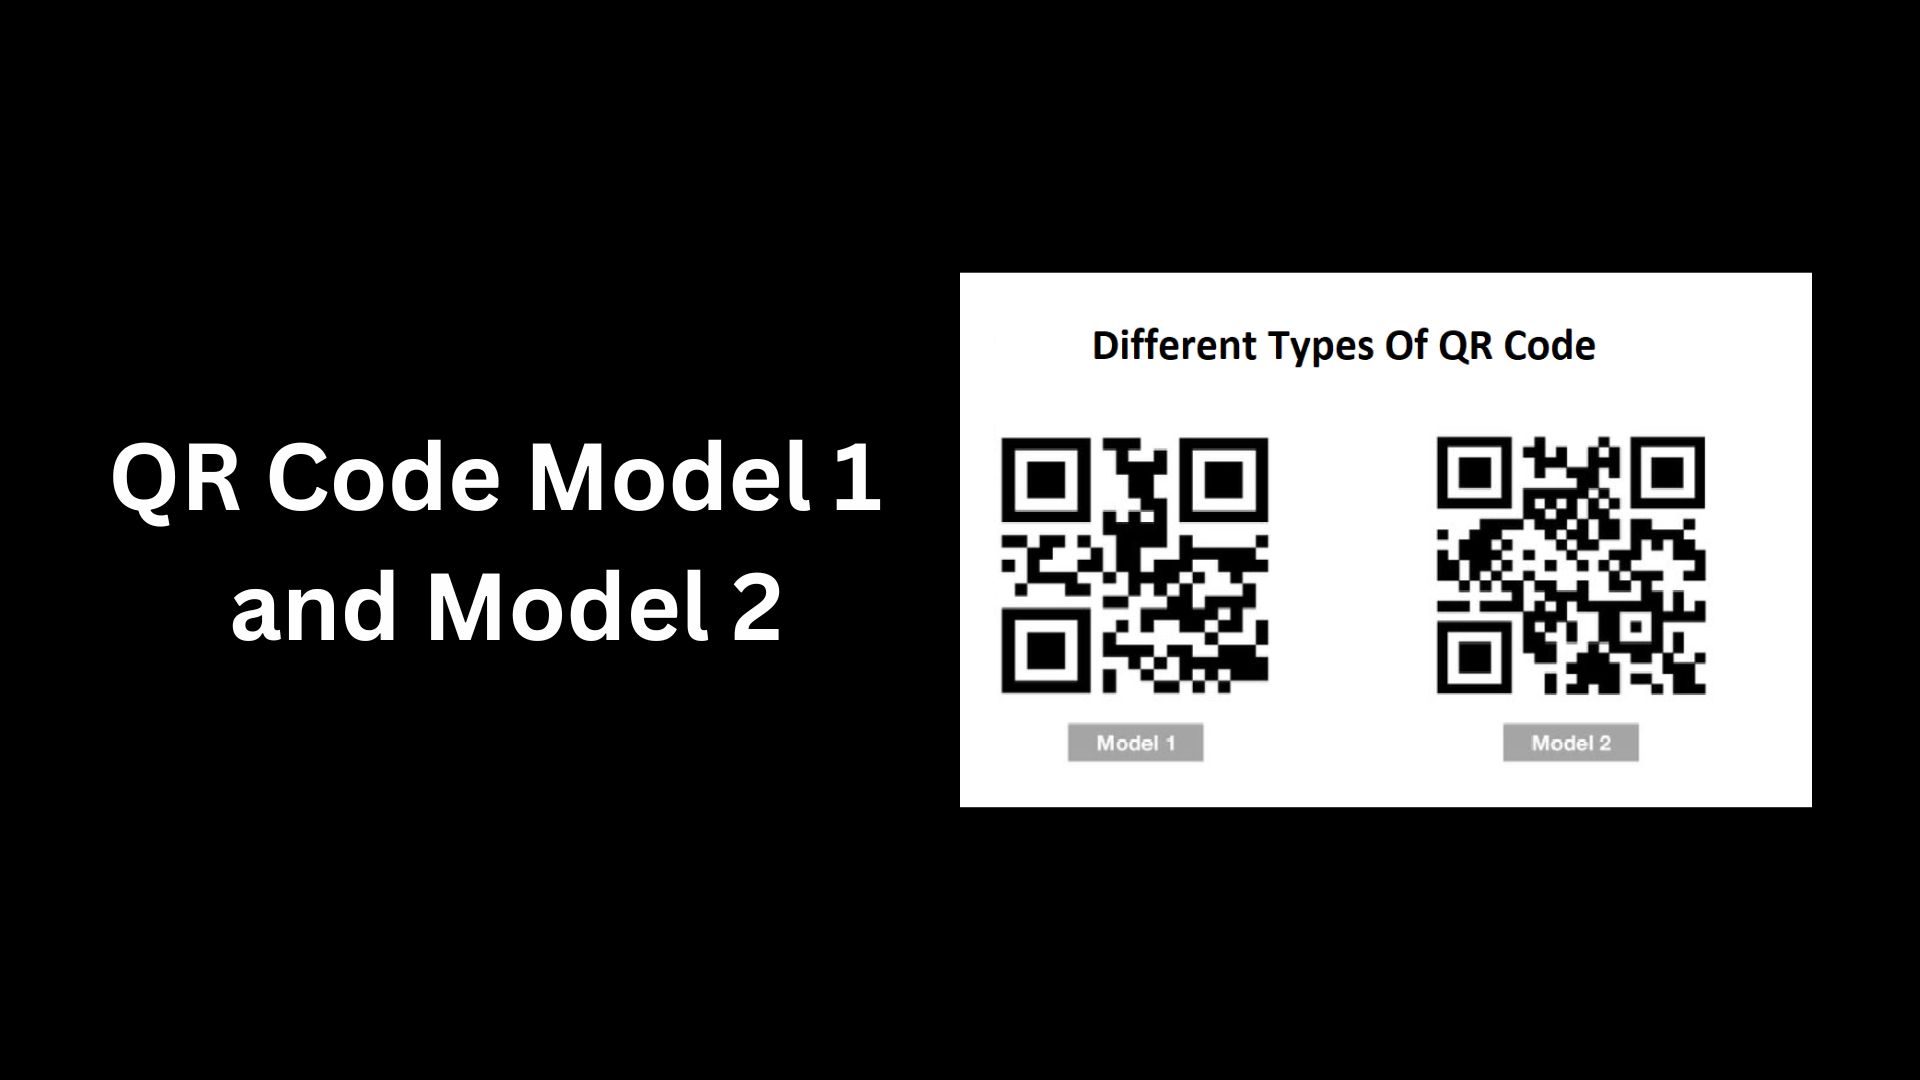
#1. QR Code Model 1 and Model 2
- You can find these QR codes on marketing posters, TVs, the internet, and many other places.
 (Source: qrcode-tiger.com)
- Model 1 and Model 2 look almost the same, but they have important differences in how much data they can store and their error correction abilities, which you can see if you look closely.
- Model 1 is the first design and is the basis for later QR code types. Because it’s the original, it holds less data than Model 2.
- It can store up to 1,167 numeric characters, 707 alphanumeric characters, and 299 Kanji characters, but it has lower error correction and is harder to scan.
- Model 2 has better features.
- It can store up to 7,089 numeric characters, 4,296 alphanumeric characters, 2,953 binary bytes, and 1,817 Kanji characters. Its added alignment pattern makes it easier to scan than the original.
#2. Micro QR Code
 (Source: qrcode-tiger.com)
- The Micro QR code is a smaller version of the regular QR code. This means it holds less data and is physically smaller, but it can still store a good amount of information.
- It can encode Kanji characters, 8-bit graphic characters, alphanumeric characters, and other special characters.
- Because of its compact size, the Micro QR code is often used for small items in production and inventory management.
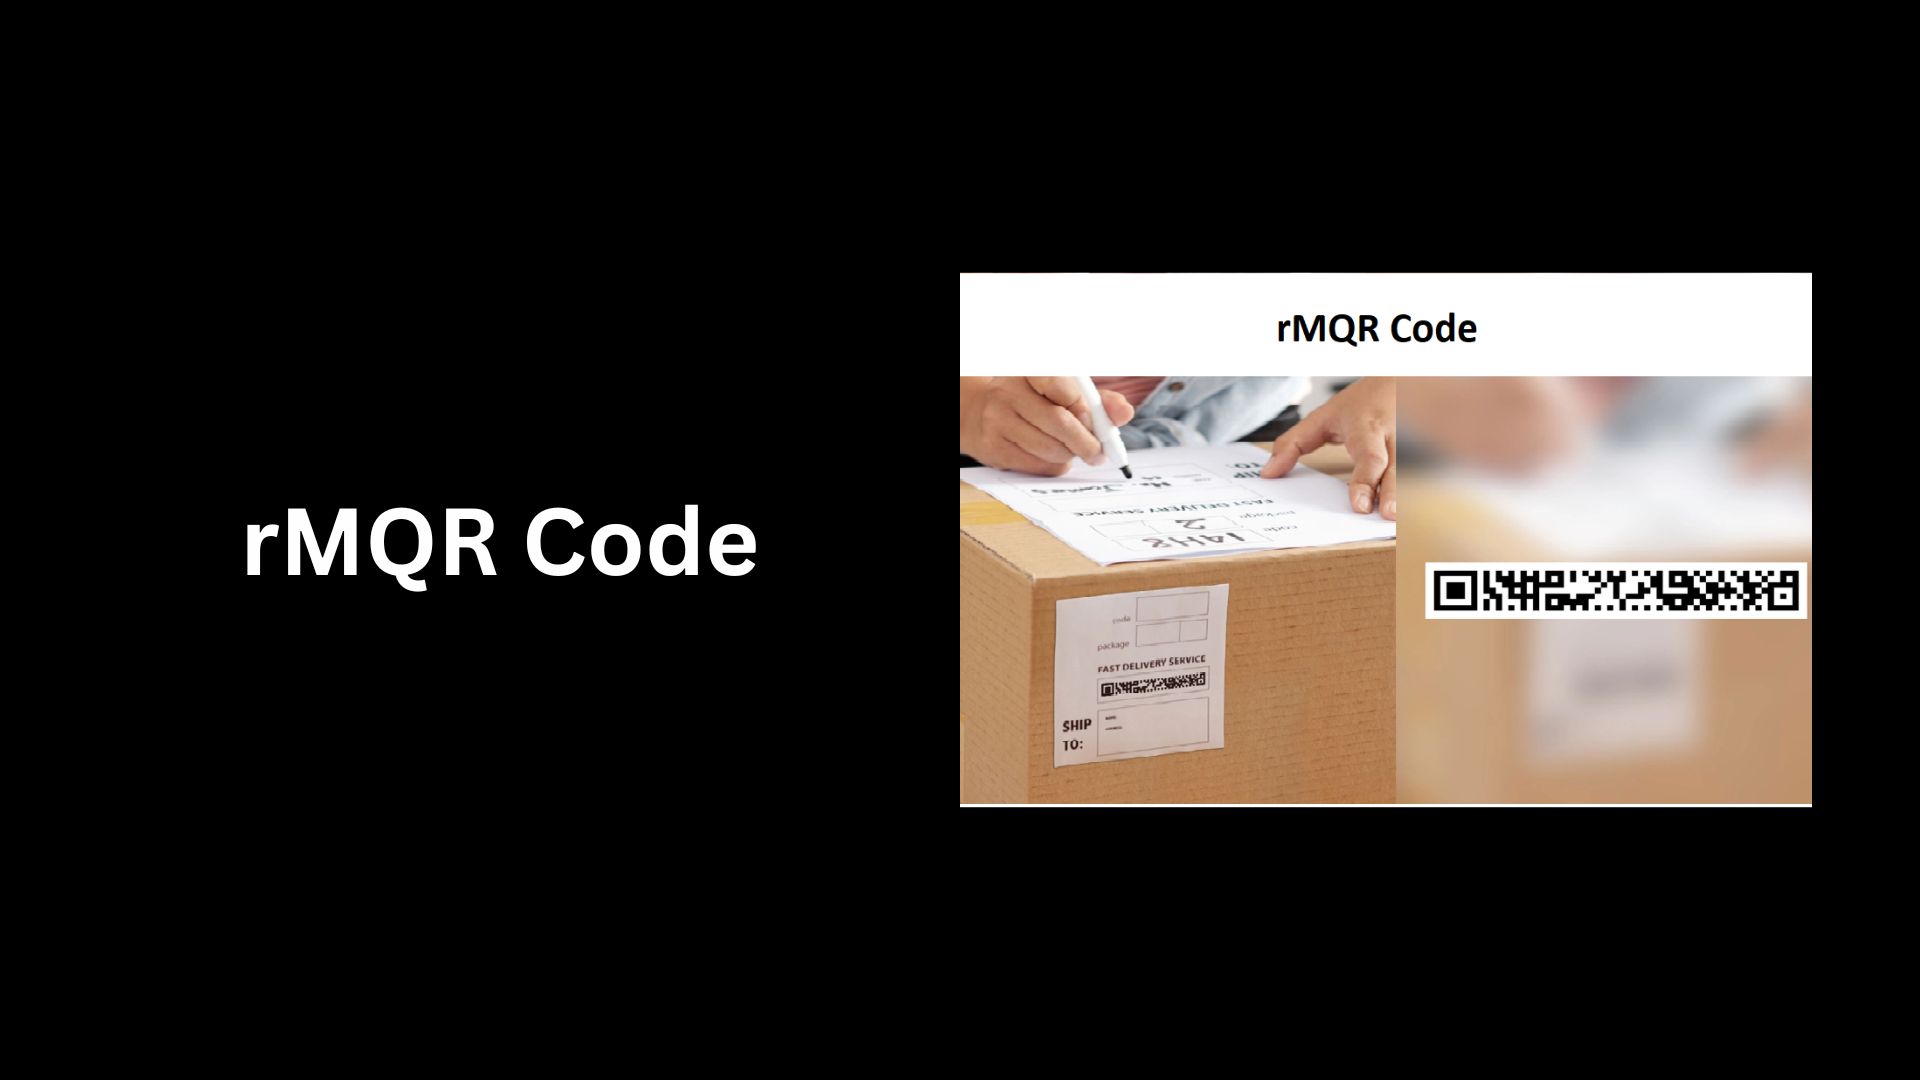
#3. rMQR Code
 (Source: qrcode-tiger.com)
- The rectangular Micro QR code (rMQR) is a narrow version of the Micro QR code. Denso Wave created it to save space.
- Despite being smaller, the rMQR code is still very scannable and can hold 219 alphanumeric characters, 361 numeric characters, and 92 Kanji characters.
- Its capacity makes it a great option for tracking products, allowing businesses to provide details without taking up too much space on labels.
- Medical and pharmaceutical companies also use the rMQR to manage tools and equipment.
#4. SQRC
 (Source: qrcode-tiger.com)
- The Secret Function QR Code (SQRC) is designed to restrict access to information.
- Unlike the regular QR code, which lets anyone see the information by scanning, the SQRC has a feature that keeps unauthorized users from accessing its data.
- It looks just like a regular QR code but can store two types of information: public and private.
- You need a special SQRC scanner to access the private data. When scanned with a smartphone, it shows public information that may not relate to the private data inside.
#5. Frame QR Code
 (Source: qrcode-tiger.com)
- The Frame QR code is designed like a picture frame, with a space in the middle for an image or logo.
- You can customize this area into different shapes and change the colors of the Frame QR code, making it attractive for branding.
General QR Code Statistics
- QR Code Statistics says there were 6.64 billion smartphones worldwide in 2022, and this number is expected to grow to 7.33 billion by 2025.
- As more people get smartphones, the potential audience for QR codes has increased a lot.
- Global smartphone use has risen from 3.2 billion in 2016 to an estimated 6.8 billion in 2023, with an annual growth rate of 4.2%.
- The number of consumers in the U.S. scanning QR codes with their smartphones is expected to increase by 16 million between 2022 and 2025.
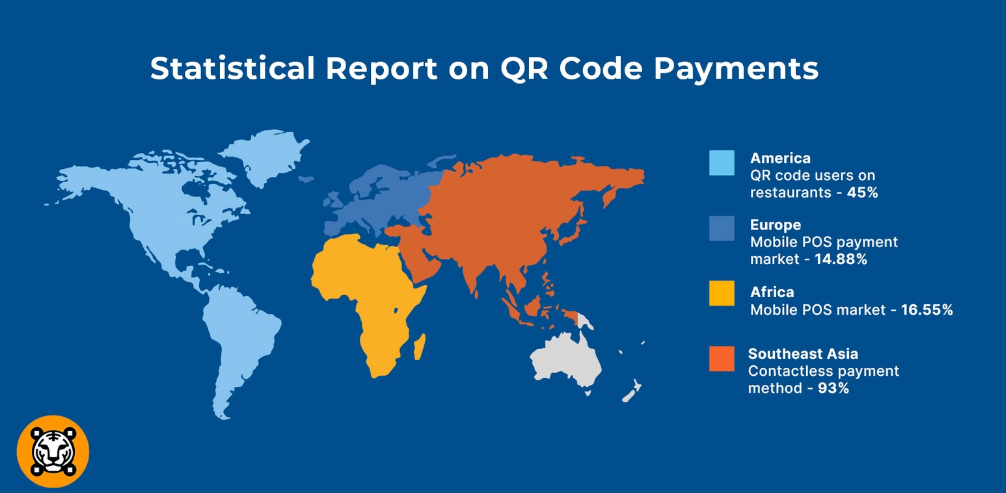
- The global QR code payment market was valued at $10.28 billion in 2022 and is expected to grow at an annual rate of 17.03% until 2028. By 2030, it is projected to reach $35.07 billion.
- QR code payments provide an easy way to make quick transactions anytime and anywhere, as per QR Code Statistics.
 (Reference: websiteplanet.com)
- As of 2023, 44.6% of internet users had scanned a QR code at least once. This rise is linked to the growing popularity of contactless payments, which are anticipated to make up 80% of all transactions by 2024.
- QR codes are increasingly used in marketing. About 60% of customers enjoy receiving digital coupons, leading to a 323% rise in QR code usage from 2021 to 2023.
- QR code use is expected to keep growing, with Juniper Research forecasting that over 2.2 billion people will use QR codes by 2025.
- Additionally, 90% of users reported scanning a QR code in the past month.
- QR codes are inexpensive and simple to use compared to traditional advertising. They can be quickly created and shared with minimal investment.
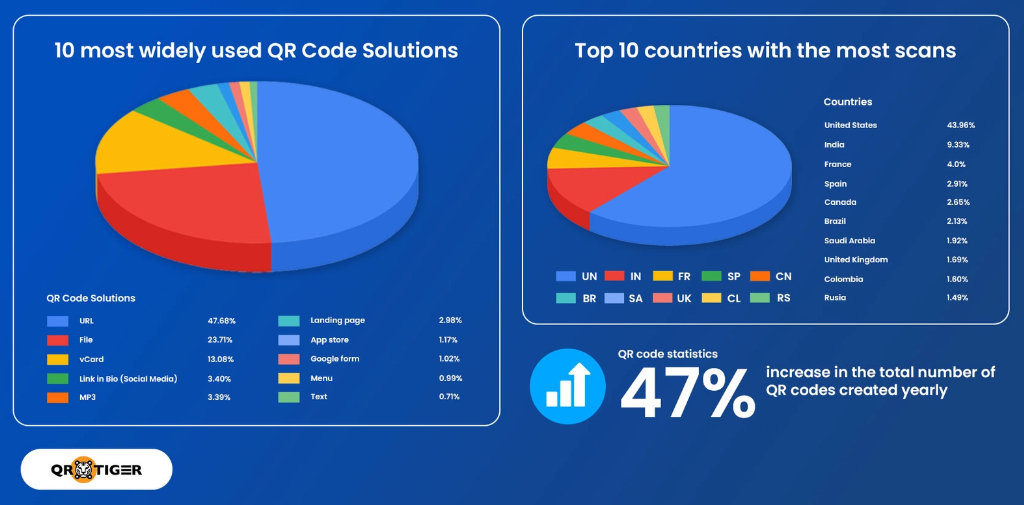
- By 2024, the U.S. is leading in QR code usage, accounting for 42.2% of scans in 2022 and 43.9% in 2023, a rise of 10.72%.
- In 2024, user-generated dynamic QR codes saw 6,825,842 scans, a 433% increase since 2021.
 (Source: qrcode-tiger.com)
- In the U.S., contactless payments increased by 150% since March 2019, and by 2024, 80% of payments and checkout services are expected to be contactless.
- The global search volume for “QR Code” has reached 2.5 million. There were 26.95 million QR code scans globally across more than 50 countries.
The top industries using QR codes are:
#1. Retail: 42%
#2. Restaurant: 41%
#3. Logistics: 83%
#4. Travel and Tourism: 210%
#5. Marketing and Advertising: 323%
- 84% of mobile users have scanned a QR code at least once.
- QR Code Statistics stated that almost 53% of consumers are likely to share personal information via a QR code scan.
- 68% of QR code users are between the ages of 24 and 54, while those aged 55 and older make up 18%.
- Up to 30% of a QR code can be damaged, but it still works.
- In Australia, QR code use surged during the COVID-19 pandemic for contact tracing.
- In the U.S., 45% of people use a marketing QR code at least once every three months.
- As smartphone use grows, it is estimated that there will be 6.8 billion smartphone users worldwide by 2023.
 (Source: uniqode.com)
- The number of unique mobile phone users globally has surpassed 5.61 billion, and smartphone penetration is projected to reach 6.4 billion by 2029. QR code creation increased by 43% in 2023.
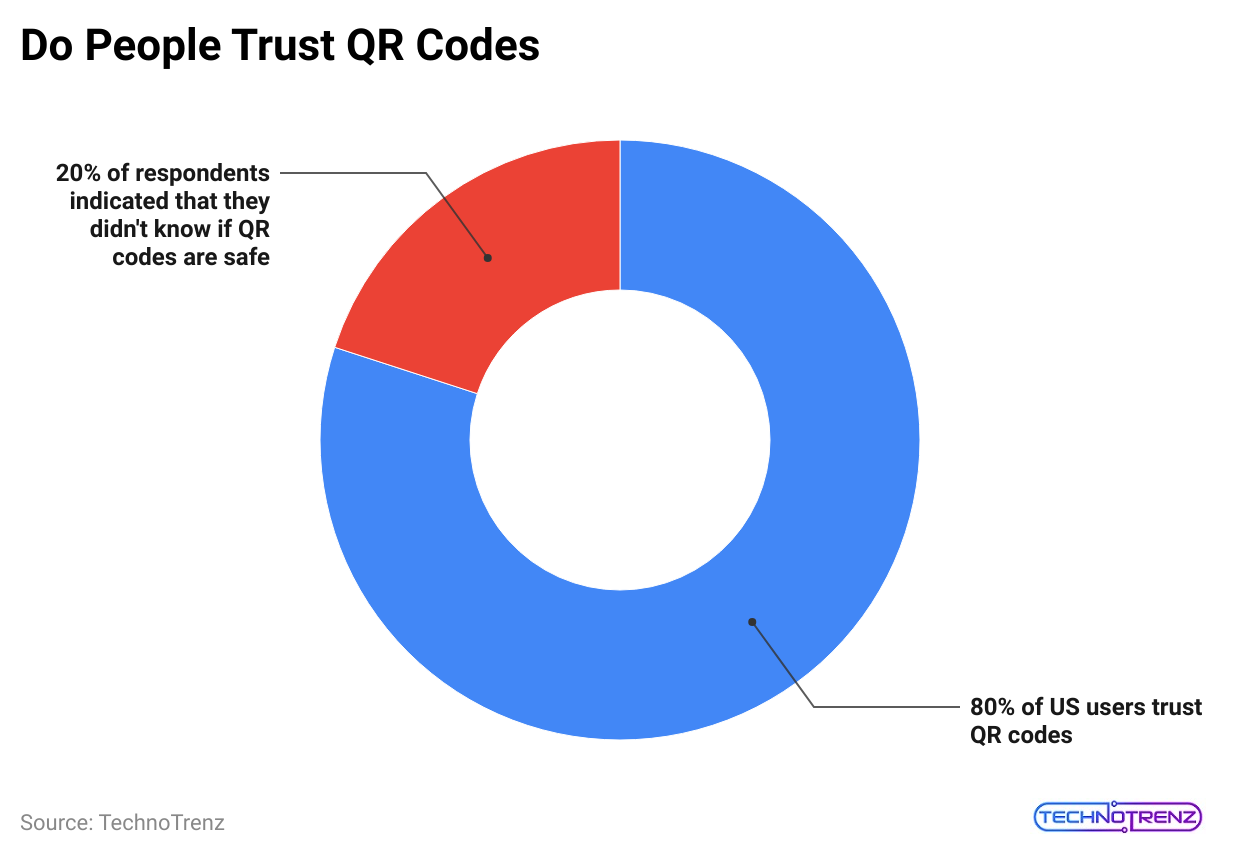
- In the U.S., 80% of users trust QR codes.
- 7% of Chinese users prefer QR code payments, using them 10-15 times a day.
- India ranks second, with 1,101,723 million QR code scans.
- QR Code Statistics stated that around 61% of Japanese customers have scanned a QR code.
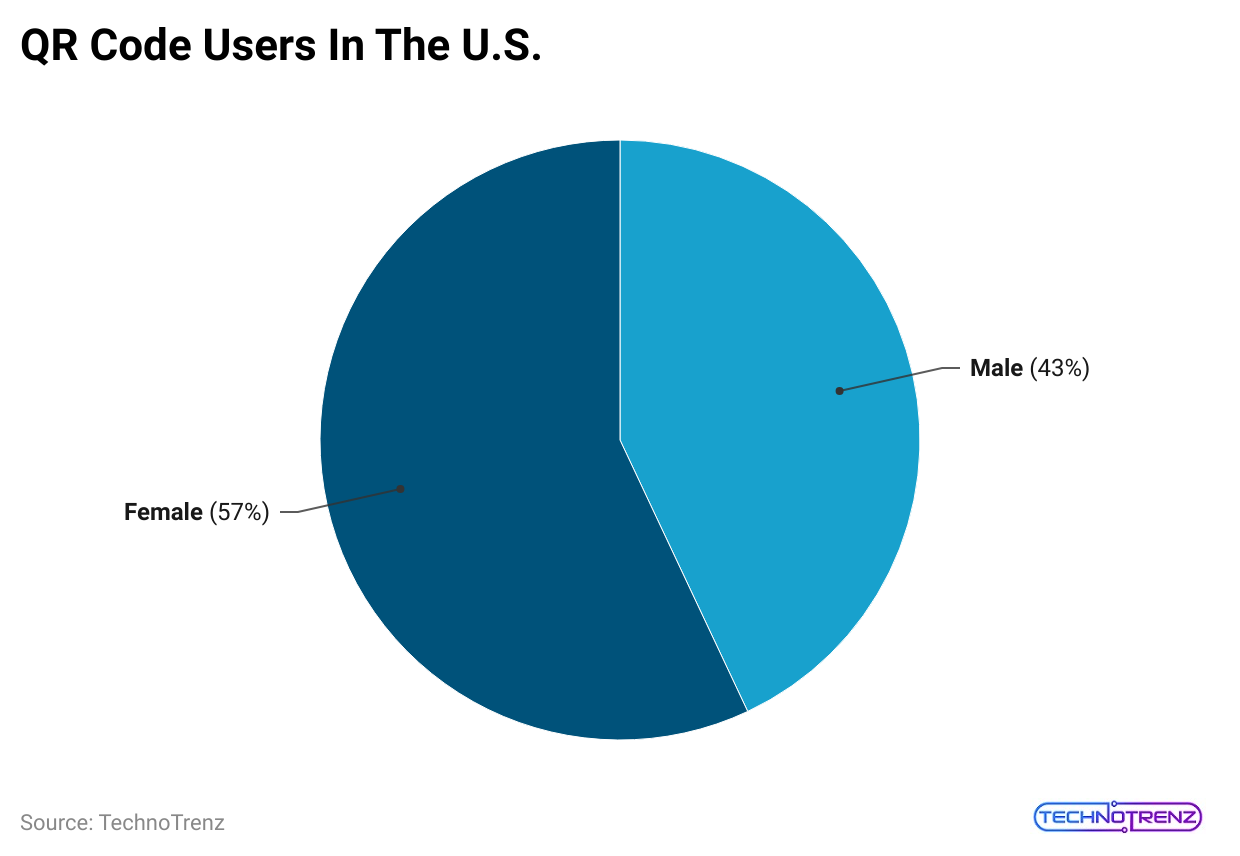
- QR codes are used by 57% of women and 43% of men.
- QR scanners are built into 91% of iOS devices and 86% of Android devices.
- About 13% of people in Latin America use QR codes.
- This growing trend in QR code usage highlights their importance in various sectors and suggests a strong future for this technology.
QR Code Usage Statistics
- QR code scanning in marketing and advertising increased by 323% worldwide in 2023.
- The travel and tourism industry uses QR codes for hotel check-ins, boarding passes, and tour information. Marketing and advertising are also using QR codes for promotions and augmented reality experiences.
- China, India, and Nigeria are the top three countries for QR code usage.
- In China, QR codes are used for various services, such as renting portable chargers and paying for groceries.
- In India, they are commonly used for restaurant orders and public transport.
- In Nigeria, QR codes assist with mobile payments and provide tourist information.
- During the same period, the consumer goods sector saw a 247% rise in QR code usage. Last year, over 50 countries reported a total of 26.95 million QR code scans.
- QR Code Statistics stated that the rise in smartphone use mainly drives the growth in QR code popularity.
- The United States leads in QR code scans, increasing its share from 42.2% of the global total in 2022 to 43.9% in 2023.
- Overall, 84% of mobile users around the world have scanned a QR code at least once.
- Regular scanning is also common, with 72% of people scanning at least once a month and 32% scanning weekly.
QR Code Adoption Statistics
- QR code scans increased by 28% in the first quarter of 2021 compared to the same time in 2023.
- QR code payments in the U.S. grew by 200% in 2023.
- 46% of marketers in the U.S. are currently using QR codes in their campaigns.
- QR code scanning rose by 83% in 2023 compared to the previous year.
- The global market for QR codes is expected to reach $14.8 billion by 2027.
- QR code usage in retail stores increased by 40% in 2023, as per QR Code Statistics.
- Over 2.3 billion QR code coupons are expected to be redeemed by 2025.
- QR code usage for payments is projected to grow by 14% each year until 2025.
- The usage of QR codes is anticipated to grow at a rate of 11.2% from 2021 to 2026.
- QR code scanning jumped by 130% in 2021 compared to 2022.
- 37% of marketers use QR codes to connect online and offline marketing efforts.
- QR code usage for mobile payments is expected to increase by 26% annually through 2025.
- The food and beverage industry saw a 21% rise in QR code usage in 2021.
- QR Code Statistics: Almost 56% of marketers include QR codes in their packaging for product verification.
- Nearly 44% of marketers use QR codes to generate leads.
- QR codes are expected to bring in over $1.65 billion in revenue by 2022.
QR Codes Application Statistics
The use of QR codes has significantly grown in recent years, with nearly every industry using them for marketing and administrative tasks. Here are some important statistics about QR code applications:
Marketing
- QR codes are valuable tools for brands. They link online and offline marketing and help bring offline customers to online platforms.
- Many brands use QR codes to share discount coupons. The number of coupons redeemed through QR codes jumped from 1.3 billion in 2017 to 5.3 billion in 2019.
- Awareness: About 37% of people know that QR codes can download apps, and 22% understand they can share map locations.
- Omnichannel Strategies: Brands with a multi-channel approach keep around 90% of their customers, compared to just 33% for those with only one channel. Additionally, 72% of online shoppers say the in-store experience is important for their buying decisions, and 71% of in-store shoppers view their smartphones as essential.
- QR codes are among the best tools for creating a seamless shopping experience.
Payments
- QR codes are essential for digital payments, allowing users to make quick and secure transactions.
- The global QR code payment market was valued at $8.07 billion in 2020 and is expected to reach $35.07 billion by 2030, with a compound annual growth rate (CAGR) of 16.11%.
- QR Code Statistics stated that India sees QR transactions worth over INR 12 crore each year.
- In China, the average quarterly value of QR transactions is about RMB 40.6 trillion.
- Global QR transactions are expected to rise from $2.4 trillion in 2022 to $3 trillion by 2025.
Restaurants and Hotels
- The hospitality industry has widely adopted QR codes, especially after the pandemic.
- 52% of restaurants in the U.S. now use QR code menus.
- 33% of restaurant owners using QR codes report improved business.
- Some governments, like Uruguay’s, have made it mandatory for restaurants to use QR codes.
Food and Product Packaging
 (Reference: qrcode-tiger.com)
- Smart packaging uses codes and sensors to enhance packaging with digital features, like tracking and sharing detailed product information.
- The smart packaging market was valued at $22 billion in 2020 and is projected to reach $38 billion by 2030, with a CAGR of 5.5%.
- The QR code packaging market was worth $5.3 billion in 2019 and is expected to grow at a CAGR of 8%.
- Well-known brands like L’Oréal, Nestlé, and Coca-Cola have improved their packaging with QR codes.
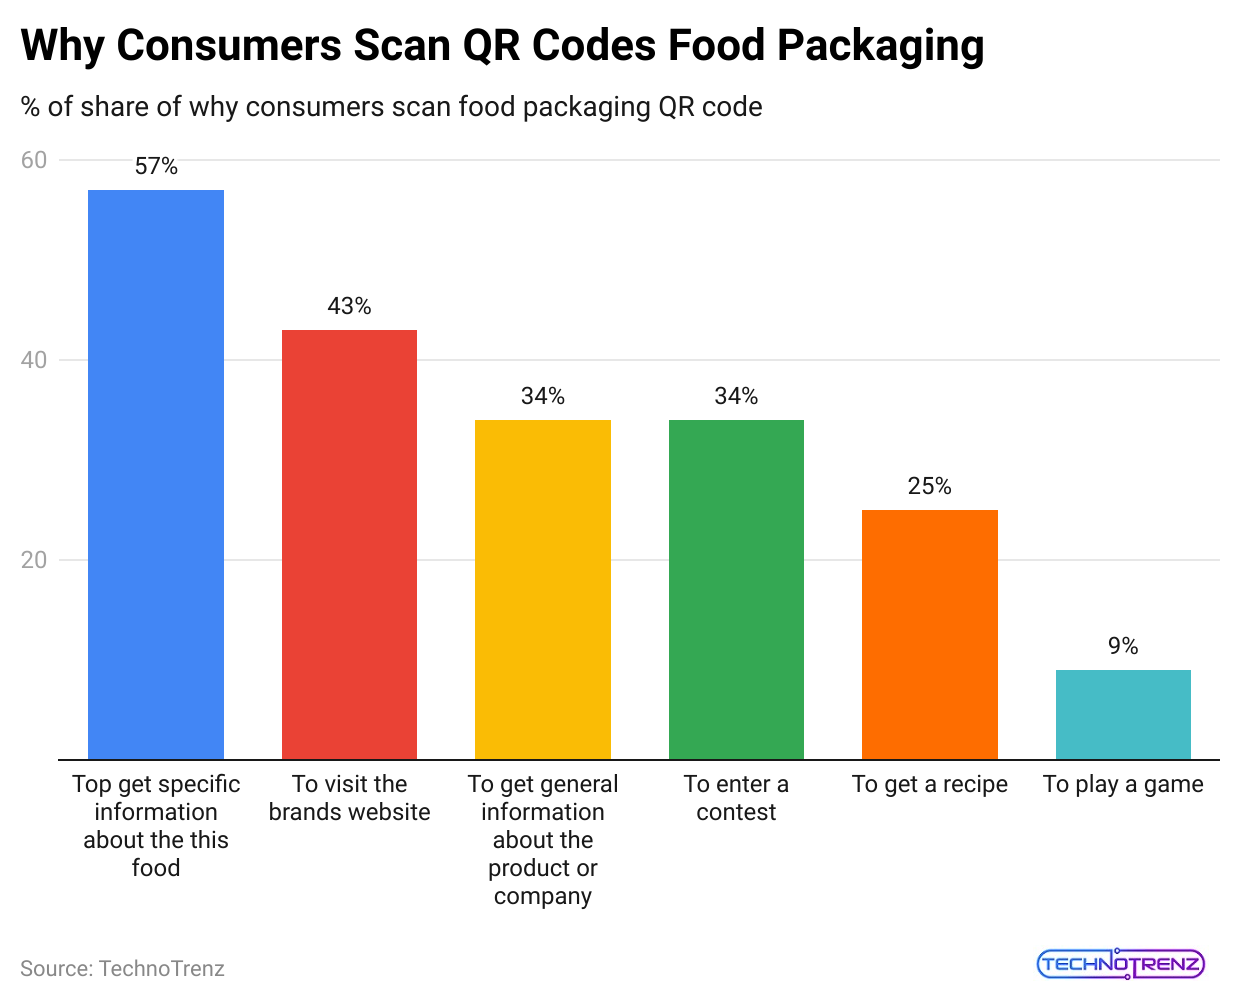
- 57% of consumers have scanned QR codes on food packaging for more details as per QR Code Statistics.
- 43% scanned QR codes on product packaging to visit a brand’s website, while 34% did so to learn about the company or enter contests.
- 65% of Chinese consumers find QR codes on packaging important for building trust.
- The Asia Pacific region saw an 83% increase in QR codes for packaging from 2014 to 2018.
Miscellaneous
- QR codes also help enhance augmented reality (AR) experiences, with the global AR and virtual reality (VR) market expected to grow by $162.71 billion by 2025.
- Additionally, QR codes can lead users to digital business cards, with that market projected to reach $242.3 million by 2027.
Companies That Use QR Code
- Alipay: This Chinese payment app is the most popular worldwide, apart from social media apps. Around 15 million small and medium-sized businesses (SMBs) in China accept payments through Alipay’s QR codes.
- WeChat: This versatile app from China ranks fourth in mobile payments, behind Facebook, WhatsApp, and Messenger.
- Paytm: In India, 9 million merchants use Paytm, a digital wallet that allows payments via QR codes.
- Netherlands Payment Options: Major QR payment systems in the Netherlands include iDEAL, while Belgium uses Bancontact, and Brazil has Cielo and Mercado Pago.
- North America: The top QR code payment companies in North America are Apple Pay, PayPal, and Amazon Pay.
- UnionPay in the UAE: By 2020, 10,000 merchants in the UAE were expected to accept UnionPay QR codes.
- Mastercard: In partnership with Facebook, Mastercard’s Masterpass QR is launching in Africa. This allows people to buy solar energy systems and use their phones for small everyday payments, which cost less than kerosene lamps.
- LINE Pay: Japan’s largest digital payment system, LINE Pay, has teamed up with WeChat Pay in Japan.
- UnionPay International (UPI)*: UPI QR code payments are available at 450,000 locations outside Mainland China, which is a 50% increase compared to the first half of 2019.
QR Code Regional Statistics
In recent years, QR codes have become much more popular, with both developed and developing countries using this technology. Here are some key QR code facts from various countries:
 (Source: qrcode-tiger.com)
#1. United States
- A June 2021 survey showed that 45% of people had used a marketing QR code at least once in the last three months. Among younger individuals, 54% of those aged 18-29 and 48% of those aged 30-44 reported using them.
- The number of U.S. households scanning QR codes grew from 9.76 million in 2018 to 11 million in 2023.
- About 27.95% of American consumers believe QR code usage has increased since the pandemic, with 18.8% strongly agreeing.
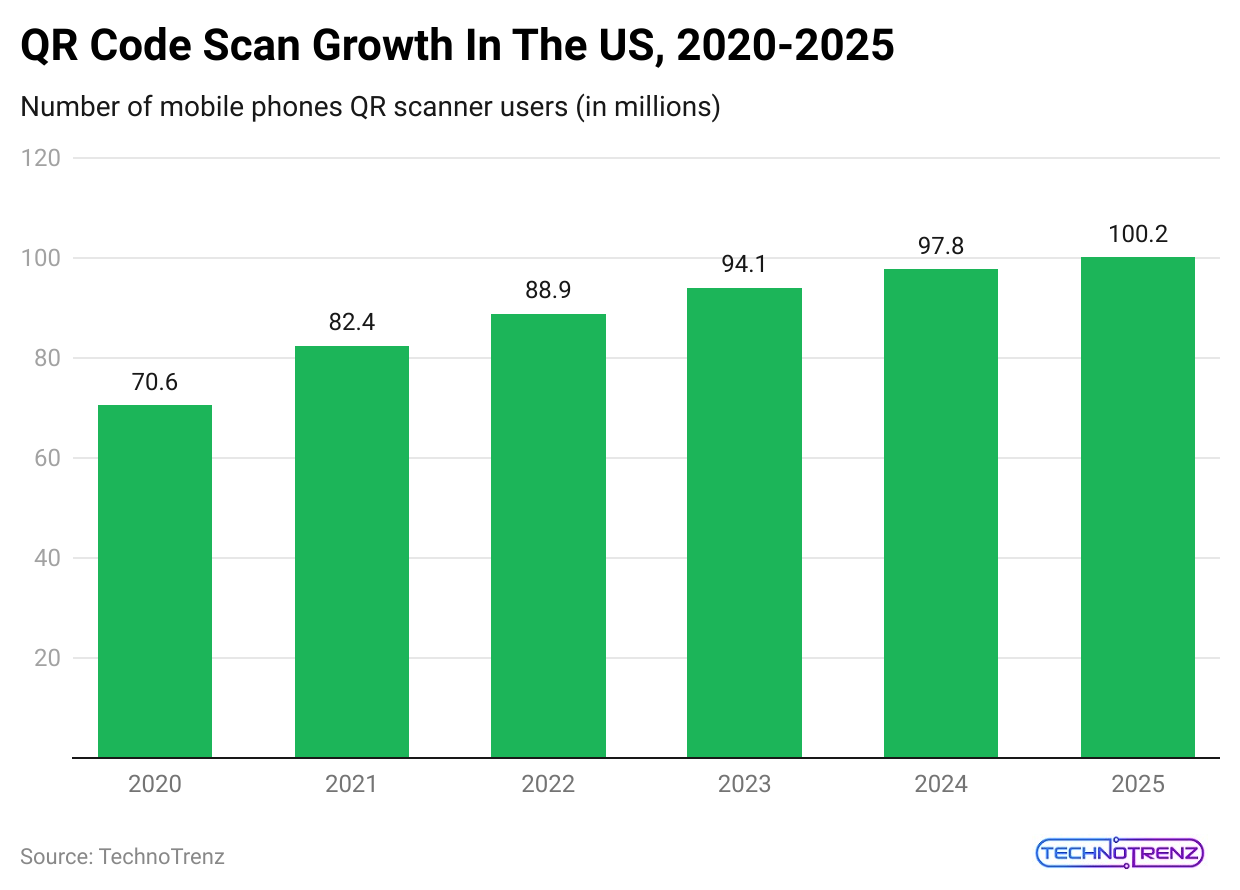
- The number of smartphone users in the U.S. using QR codes is expected to rise from 83.4 million in 2022 to 99.5 million by 2025.
#2. China
- Although QR codes originated in Japan, China was the first country to use and widely implement them in daily life.
- More than half of China’s population interacts with QR codes several times a week.
- QR Code Statistics stated that Chinese users typically engage with QR codes 10-15 times a day.
- In 2023, China recorded QR code transactions totaling $5.5 trillion.
#3. India
- The fast growth of digital payments and UPI (Unified Payments Interface) in India has greatly increased the use of QR codes.
- Over 9 million merchants in India accept payments through QR codes.
- The UPI system handled 2.8 billion transactions worth INR 5 trillion in June 2023 using QR codes.
#4. Europe
- Europe has been slower in adopting QR codes compared to other regions but is quickly integrating them for payments and other uses.
- 66% of smartphone users in the UK and Europe have scanned a QR code at least once.
- 40% of smartphone users scan at least one QR code each week.
These facts show the growing importance and acceptance of QR codes around the world.
Consumer Behavior QR Code Statistics
- 1 in 5 consumers have scanned a QR code in the past year.
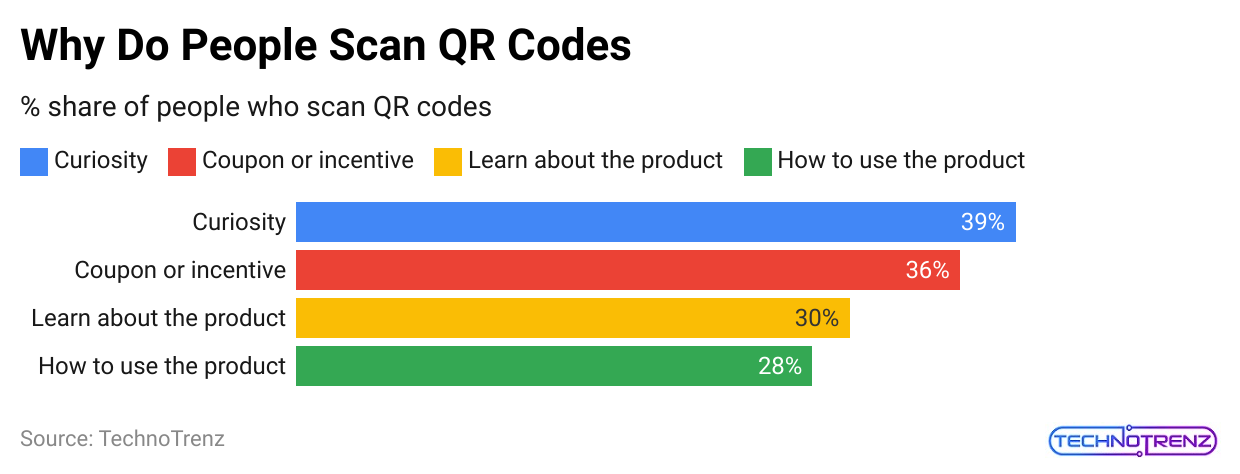
- 64% of people say they would likely scan a QR code in a store to learn more about a product.
- 8% of respondents used QR codes last year for mobile boarding passes.
- Almost 70% of consumers have a more positive view of QR codes since the pandemic began.
- Nearly 89% of users who scanned a QR code on a product wanted more information about it.
- QR code scans that lead to a video have a 53% retention rate.
- Almost 42% of shoppers think QR codes will be important for their future shopping experiences.
 (Source: qrcode-tiger.com)
- Around 76% of consumers are familiar with QR codes
- Almost 75% of millennials are likely to respond to offers received via QR codes on their smartphones.
- Around 50% of QR code scanners are aged 45 and older.
- 55% of people would like to see more QR codes on physical items for information and deals.
- 3 in 10 Americans have purchased their smartphone by scanning a QR code.
- QR Code Statistics stated that almost 89% of consumers use QR codes to access product information.
- 57% have scanned a QR code to get a coupon or special offer.
- Almost 30% of consumers have scanned a QR code in a magazine.
- QR Code Statistics stated that around 45% of QR code scans in 2020 came from users aged 35-54.
- Almost 44% of consumers have scanned a QR code to enter an event.
- QR Code Statistics stated that almost 70% think QR codes make life easier.
- 4 million households in the U.S. are expected to scan a QR code by the end of 2021.
 (Reference: qrcode-tiger.com)
- Nearly 61% find QR codes helpful for making purchase decisions.
- 36% have scanned a QR code to access a loyalty program or rewards.
- Around 35% have scanned a QR code for healthcare information.
- Almost 34% of shoppers have scanned a QR code in a store for product information.
- Roughly 52% say they have scanned a QR code for contactless payment.
- Almost 31% have scanned a QR code to connect to Wi-Fi.
- 40% have scanned a QR code for contactless delivery instructions.
- QR code scans that encourage app downloads have a 25% conversion rate.
- In the UK, 67% of people have used a QR code to visit a website.
- 25% of QR code scans lead to a purchase on mobile devices.
- Almost 41% have scanned a QR code to sign up for a loyalty program.
- QR Code Statistics stated that around 33% of all QR code scans in 2021 were for digital product information.
- Nearly 60% say using QR codes makes their lives easier.
- Almost 28% have used QR codes to access digital coupons.
- Nearly 37% of scans are for music or video content.
- 50% have used a QR code to join a contest or sweepstakes.
- 36% have scanned a QR code for virtual event registration.
- QR Code Statistics state that 47% have scanned a QR code to read customer reviews.
- 44% have scanned a QR code for product information while shopping in-store as per QR Code Statistics.
QR Code Demographics Statistics
 (Reference: enterpriseappstoday.com)
- In 2023, a report on QR Code Usage by Demographics found that a higher percentage of women scan QR codes compared to men, with 57% of users being female and 43% male.
 (Reference: scanova.io)
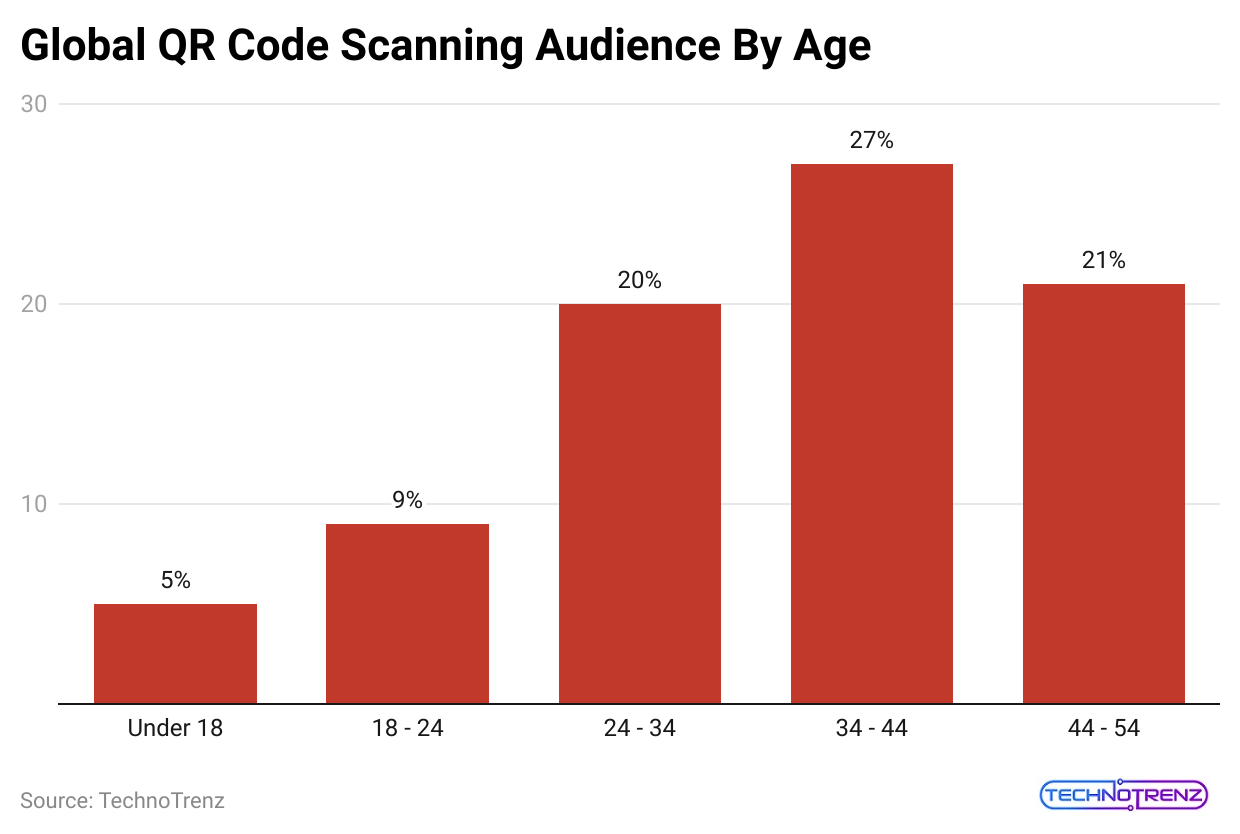
- As we can see in the chart above, just 5% of people under 18 years use QR Code, whereas 9% of people use QR Code who are between 18-24 years. Around 20% of people use QR codes between 24-34 years, 27% of people use them between 34-44 years, and finally, 21% use 44-54 years old.
Benefits Of QR Codes To Businesses And Consumers
QR codes have changed how businesses and consumers interact, offering several important benefits:
- Cost-Effective – QR codes are cheap to create, making them great for businesses of any size. Since they are digital, there’s no need for expensive equipment, keeping costs low.
- Easy to Use – Scanning a QR code is quick and straightforward, as most smartphones can do it easily. This simplicity encourages more people to engage with them.
- Versatile – QR codes can link to different types of content, such as websites, contact details, and videos. This makes them useful for marketing, sharing information, and more.
- Real-Time Analytics – Businesses can track the number of times QR codes are scanned, giving them immediate insights into customer behavior and the success of their marketing efforts. This information can help improve decisions and strategies.
- Space-saving – Space is limited in printed materials like business cards and flyers. QR codes can hold a lot of information in a small area, making them practical.
- Connects Physical and Digital – QR codes create a bridge between physical items and digital content. By scanning a code, users can easily move from a physical object to an online resource.
These advantages show why QR codes are becoming essential tools for modern marketing and customer engagement.
Impact Of COVID-19 On QR Code Statistics
- COVID-19 has greatly increased digital payments in Asia. A report from McKinsey & Company shows a 80/20 rise in digital payments.
- This means that while the user base is expected to grow by 20%, 80% of that increase happened during the height of the pandemic.
- This trend is likely to continue even after the pandemic ends.
- The UK and Europe are also using QR codes more than ever.
 (Reference: websiteplanet.com)
- A survey by MobileIron revealed that 86.66% of smartphone users in the UK and Europe have scanned a QR code at least once, and 36.40% scan at least one QR code each week.
- Moreover, 46.81% of people said QR codes make life easier in a contactless world, and 38.99% want to see QR codes used even more in the future. This indicates that QR codes are changing the digital landscape in the UK as well.
Here are some additional interesting QR code statistics:
- Gartner: COVID-19 has sped up contactless payments, with 80% of payments and checkout services expected to be contactless by 2024.
- Statista: 18.8% of U.S. consumers believe QR code usage has increased after the pandemic.
- CNBC: QR code downloads have risen by 750% since the pandemic began.
How Businesses Are Using QR Codes
- It’s no surprise that entrepreneurs and small to medium-sized businesses (SMBs) are at the forefront of using QR codes.
- They provide a budget-friendly and easy way to enhance customer interaction and improve overall user experience.
 (Reference: smbguide.com)
- In 2023, small businesses accounted for 38% of all QR codes created. While larger companies have established brands, smaller ones must continuously work on building and maintaining their brand image.
- One effective way to build brand loyalty is through better customer interactions and smoother experiences, and QR codes can help achieve that.
- Small businesses can strengthen brand loyalty over time by connecting more effectively with customers through these simple tools.
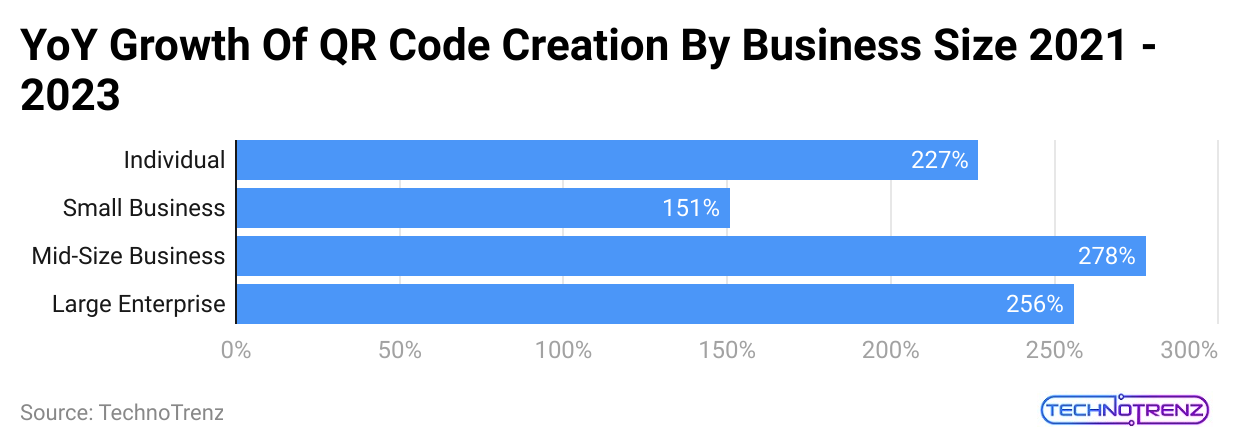
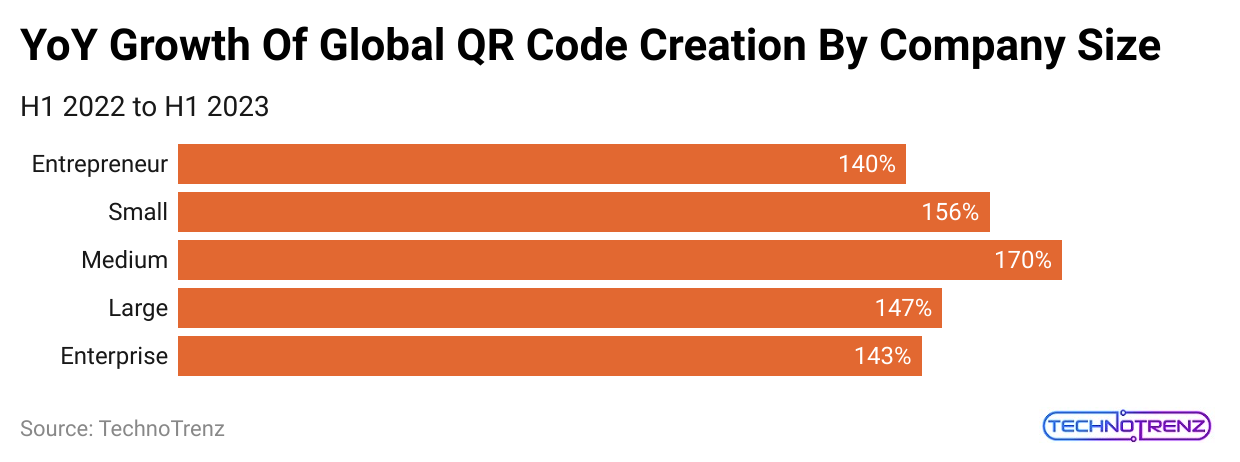
- Year over year, QR code creation for individual businesses grew by 140% as per QR Code Statistic
- For mid-sized businesses, it increased by 170%, while large businesses saw growth of 147% and 143%.
 (Reference: smbguide.com)
- It’s important to note that the figures for large companies may be slightly skewed, as they already have a vast customer base.
- Even a single QR code campaign can generate thousands or even millions of codes for them.
- That said, the standout statistic is the 140% growth in QR code creation for individual businesses.
QR Code Future Predictions
- Integration with New Technologies: QR codes are expected to work well with new technologies like Augmented Reality (AR), Virtual Reality (VR), and Artificial Intelligence (AI), which will create more engaging and customized user experiences.
- Emphasis on User Experience: As QR codes become more popular in marketing, there will be a greater focus on user-friendly designs and clear benefits to encourage more people to scan them.
- Privacy and Security: With increasing worries about data privacy, marketers will need to be open about how they use data and implement strong security measures to maintain consumer trust.
- Creative Uses: We can expect more inventive applications of QR codes, such as interactive packaging, AR experiences triggered by scans, and personalized marketing campaigns.
- Global Growth: While the U.S. and India are currently leaders in QR code usage, other countries are expected to see significant growth in using QR codes for marketing.
- Industry-Specific Innovations: Different industries will find unique ways to use QR codes in their marketing plans. For example, retail may focus on making checkout easier, while the hospitality industry might use QR codes for contactless services and personalized guest experiences.
Conclusion
In conclusion, QR codes in marketing are a flexible and growing tool that helps businesses connect with consumers in fresh and interesting ways. As technology advances and consumer habits shift, QR codes are expected to become even more important in marketing strategies across various industries.
Marketers who creatively and responsibly use QR codes in their campaigns can look forward to improved engagement, valuable data insights, and better customer experiences in the future. We have shed enough light on the QR Code Statistics through this article.
Sources
FAQ.
Yes, QR code trends are increasing and are still very important in 2024, with a growth rate of 43.20% since 2022. They are becoming more popular, with new applications spreading across various industries.
One major change I see coming is the increased use of QR codes to create immersive experiences. As augmented reality (AR) and virtual reality (VR) technologies become more popular, QR codes will be essential in linking the physical world to the digital world.
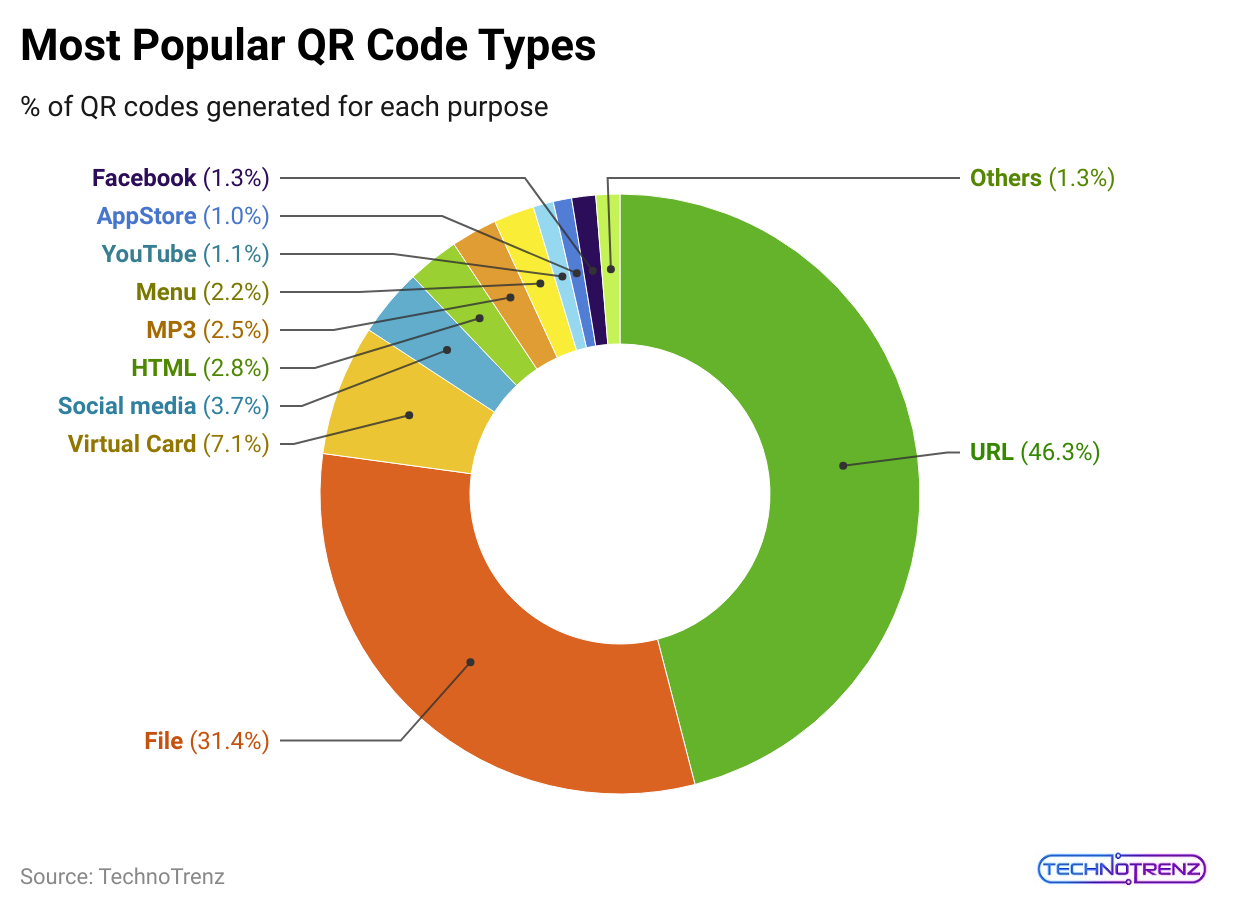
According to research from QR Code KIT, the most popular QR code types in the last year have been:
- Website QR codes
- Menu QR codes
- File download QR codes
- Social media QR codes
- App store QR codes
GS1 is assisting consumers and retailers in shifting to 2D barcodes for point-of-sale (POS) and point-of-care (POC) systems. You might be curious if QR codes are replacing regular barcodes. The answer is yes, but this will happen slowly, not instantly.
QR codes are easy to use and flexible, so they will probably stay important for many years. However, new technologies like NFC, AR, and BLE could replace them because they might offer better ways to interact with digital content.
QR codes were invented in 1994 to track car parts. Over the years, they have changed into useful tools for quickly getting information with just a scan. These 2D barcodes can store data that takes users to various digital resources when scanned by a smartphone camera.

Saisuman is a professional content writer specializing in health, law, and space-related articles. Her experience includes designing featured articles for websites and newsletters, as well as conducting detailed research for medical professionals and researchers. Passionate about languages since childhood, Saisuman can read, write, and speak in five different languages. Her love for languages and reading inspired her to pursue a career in writing. Saisuman holds a Master's in Business Administration with a focus on Human Resources and has worked in a Human Resources firm for a year. She was previously associated with a French international company. In addition to writing, Saisuman enjoys traveling and singing classical songs in her leisure time.