Sales Funnel Statistics By Conversion Rate, Middle Of The Funnel, Effective Content, Software And Landing Pages
Updated · Oct 15, 2024

WHAT WE HAVE ON THIS PAGE
- Introduction
- Editor’s Choice
- What is A Sales Funnel?
- General Sales Funnel Statistics
- Online Shopping Conversion Rate Globally
- Sales Funnel Conversion Rates Statistics
- Middle Of The Funnel (MOFU) Statistics
- Most Effective Type Of Content Through Sales Funnel
- Sales Funnel Software Statistics
- Sales Funnel Statistics By Landing Pages
- Conclusion
Introduction
Sales Funnel Statistics: Imagine walking into a party where you don’t know anyone. It feels awkward. That’s where a sales funnel helps by guiding potential customers from “Who are you?” to “Take my money!” But how can we tell if our sales funnel is working? This is where data and statistics come into play. Understanding how well your sales funnel performs is more than just counting sales.
It’s about examining each step, from awareness to action, to determine what’s successful and what needs fixing. This article, “Sales Funnels Statistics”, serves as a guide through the customer journey, filled with important statistics for each stage of the sales funnel. We’ll help you understand what works, what doesn’t, and where you can improve.
Editor’s Choice
- On average, 70-95% of revenue for companies that offer these options comes from upsells and renewals.
- Upselling is 68% less expensive than gaining a new customer.
- Upsells contribute 10% to 30% of eCommerce site revenues, with some store owners making up to 40% of their total income from sales funnels.
- The average conversion rate for an order bump in a tripwire sales funnel is 40%.
- In 2023, 570,000 websites were using at least one sales funnel tool.
- Sales Funnels Statistics stated that Click Funnels is the most popular tool, capturing nearly 55% of the market.
- The chance of selling to an existing customer is 3 to 35 times greater than the chance of selling to a new customer.
- When selling a product, you have a 60%- 70% chance of making a sale with a returning customer, compared to only 5%- 20% with a new customer.
- About 68% of companies still need to define or measure their sales Funnel.
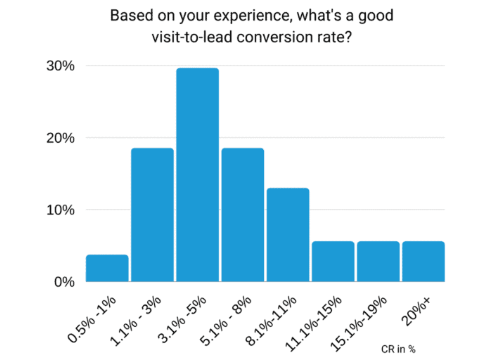
- Most businesses believe that a good conversion rate for a sales funnel is between 3.1% and 5% for many industries.
- The average conversion rate for upsells in a tripwire sales funnel is 20%, with anything above that considered good.
- As stated in Sales Funnels Statistics, a good conversion rate for a tripwire sales funnel is between 1.5% and 3%.
- 55% of companies say that articles and blog posts are the best way to guide prospects through the sales funnel.
- Less than 1% of people earn over $1 million from their sales funnels.
What is A Sales Funnel?
A sales funnel is the path that potential customers take to become buyers. Each step in the Funnel helps guide them closer to making a purchase. A good sales funnel outlines what your business needs to do to help prospects move to the next step.
We call it a funnel because it starts by bringing in many people and then narrows down to those who actually buy your product.
 (Source: mailmunch.com)
Some drop-off is expected—you won’t convert everyone. However, a well-designed funnel can turn as many prospects as possible into buyers. Businesses should always work on improving and testing their funnels to make them more effective.
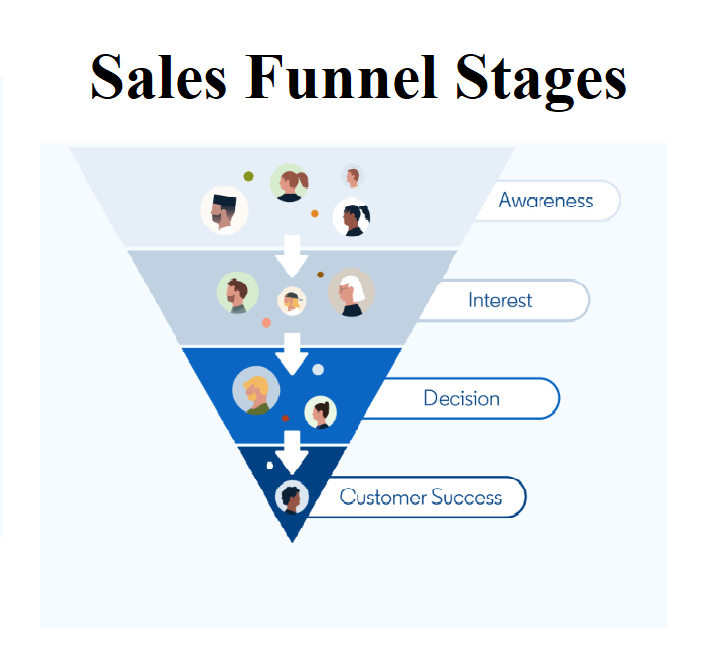
Stages of Sales Funnels
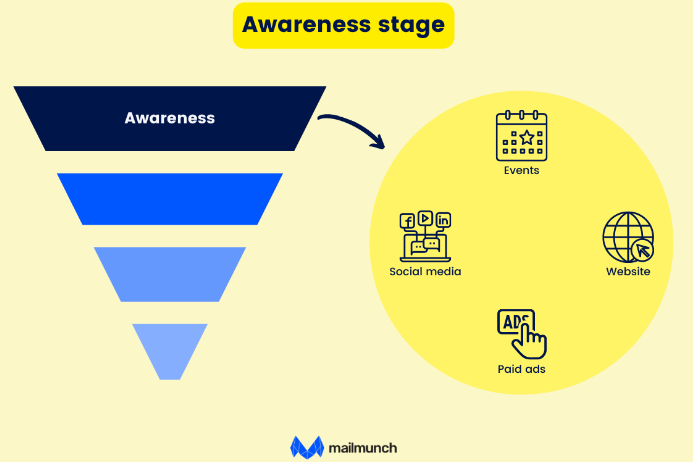
#1. Awareness
 (Source: mailmunch.com)
This is the first step in people’s starting to notice your product or service. They realize they have a problem and might find your brand through ads, Google searches, social media, or friends. Building awareness is key to reaching more potential customers.
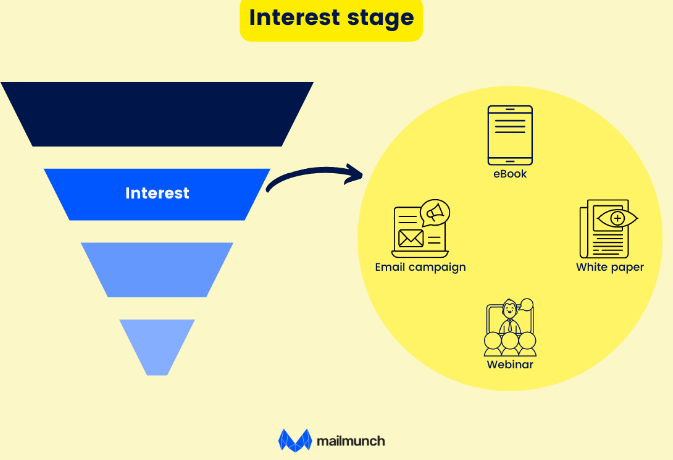
#2. Interest
 (Source: mailmunch.com)
Once they know about your brand, they start looking into it more. They search for ways to solve their problems and compare your offerings with others. You can keep their interest with helpful articles, videos, or emails that share useful information.
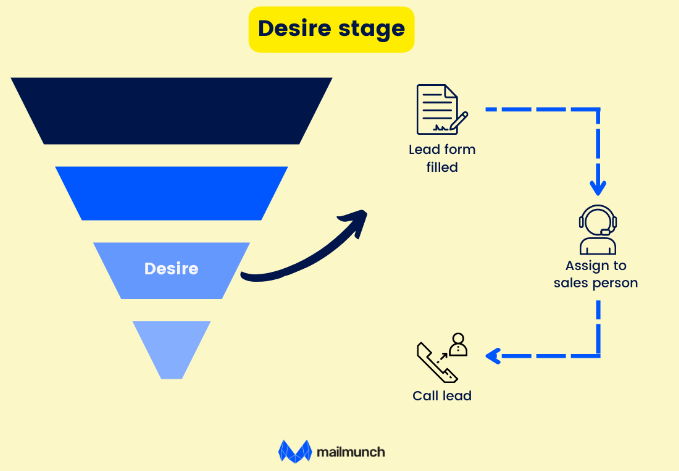
#3. Desire
 (Source: mailmunch.com)
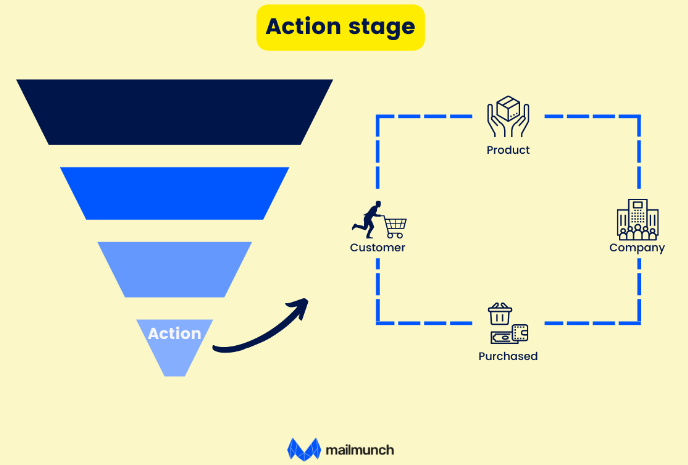
#4. Action
 (Source: mailmunch.com)
This is the critical step in deciding to buy. Make the buying process easy and consider offering discounts or special deals to encourage them. If they wait to buy right away, follow up to keep your brand in their minds for future needs.
By focusing on these stages, you can effectively guide customers toward making a purchase and boost your sales.
General Sales Funnel Statistics
- Nearly 570,000 websites are using these tools to attract new customers and improve their sales funnel effectiveness.
- The average conversion rate for sales funnels across all industries is 2.35%, as per Sales Funnels Statistics.
- Businesses using sales funnels see an average deal size that’s 102% higher.
- Companies with a well-organized sales funnel experience revenue growth that is 18 times greater.
 (Source: ecommercebonsai.com)
- Email is the most effective way to communicate at every stage of the sales funnel.
- Only 17% of marketers currently have a fully functioning sales funnel.
- Personalized calls to action (CTAs) perform 202% better than standard ones.
- About 23% of companies that didn’t meet their revenue targets needed a clear sales funnel.
- The average B2B sales cycle has increased by 22% in the past five years due to more complex buying processes.
- Including video content in the middle of the Funnel can raise conversion rates by 66%.
- Optimizing for mobile can result in a 160% increase in mobile conversions.
- Sales Funnels Statistics stated that almost 68% of B2B organizations still need to define their sales Funnel.
- Retargeted ads can boost conversion rates by 147%.
- Only 34% of companies regularly optimize their sales funnel.
- Adding customer testimonials at the bottom of the Funnel can increase conversions by 34%.
- 63% of high-performing companies have documented their sales funnels.
 (Reference: passivesecrets.com)
- These points show how important it is to have a clear and optimized sales funnel to improve conversions and increase revenue.
- Marketers are always creating new and better plans for their sales funnels. In fact, 48 out of 100 are currently working to make improvements.
- It’s about 2.35%, meaning that only 2.35 out of every 100 visitors end up making a purchase. This shows that you should invest more time in designing effective landing pages for your business.
- B2B consumers often take their time. They do research and usually finalize their purchases only if they find a really good product. About 47% of the respondents focused on buying B2B products.
- Calls to action (CTAs) have greatly improved sales efforts.
- Businesses using CTAs see an average conversion rate of 13.50%, which is much higher than the typical 2.35%. This highlights how important CTAs are on pages.
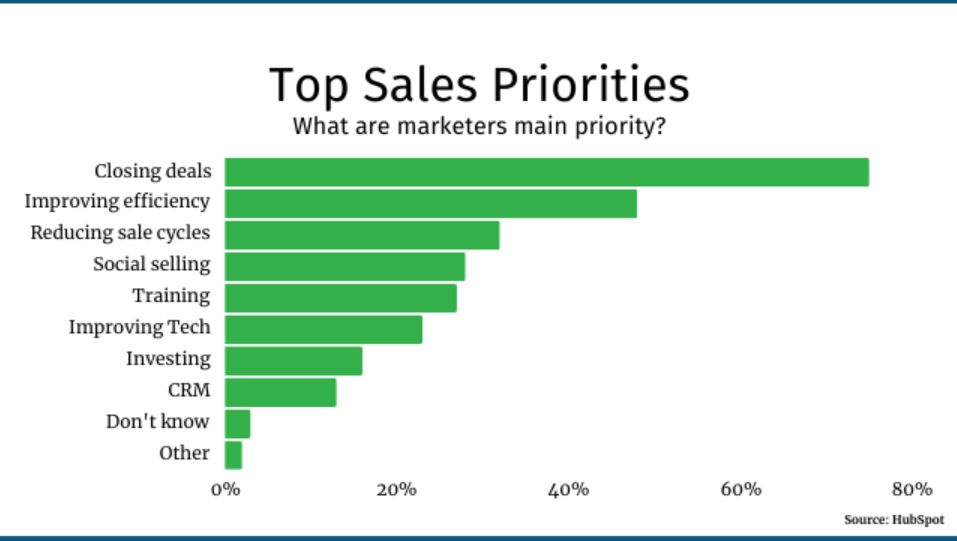
- Sales Funnels Statistics stated that marketers have important insights into their marketing and sales efforts.
- About 69% prioritize conversion rates, aiming to turn marketing leads into customers and maximize business performance.
Online Shopping Conversion Rate Globally
 (Reference: statista.com)
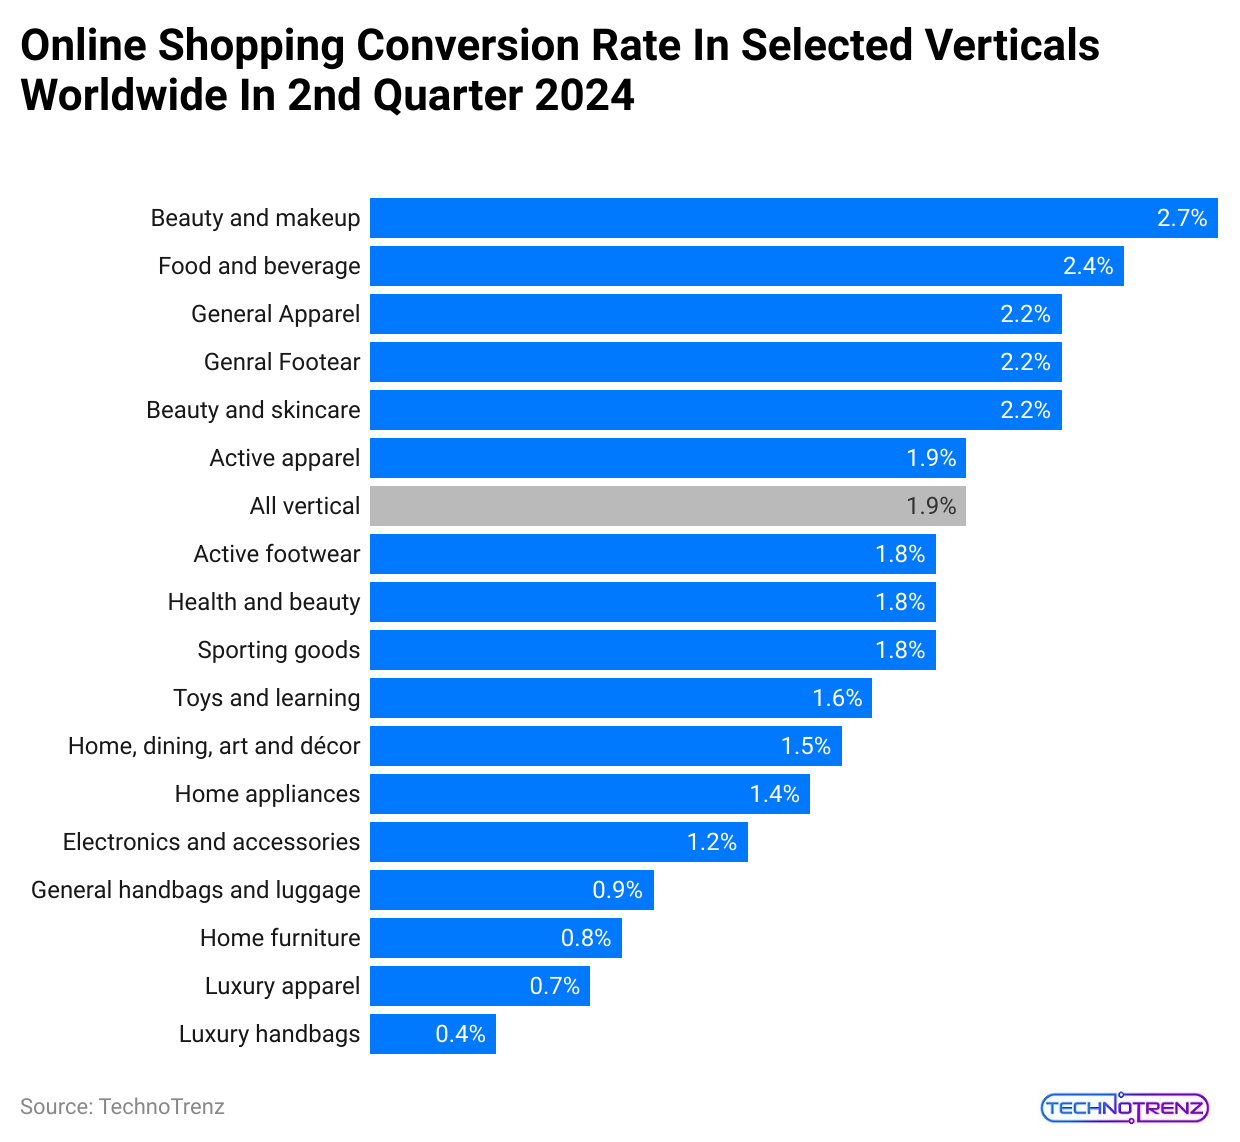
- In the second quarter of 2024, e-commerce sites in the beauty and health sector had the highest online conversion rates at almost 3%.
- The food and beverage sector followed closely with a 2.4% conversion rate.
- For comparison, the average conversion rate across all e-commerce sectors was just over 1.9%.
- The conversion rate, which shows the percentage of visits to e-commerce websites that result in purchases, varies by country and region.
- Since at least 2023, shoppers in Great Britain have had higher conversion rates than those in the United States and other regions.
- Additionally, even though mobile shopping is becoming more common, conversions are still better on larger screens like tablets and desktops.
- The rate at which consumers abandon their online shopping carts has been increasing and will exceed 70% in 2024.
- This trend indicates that e-commerce sites are finding it harder to convert website visitors into buyers, according to Sales Funnels Statistics.
- By the end of the year, the food and beverage category had one of the lowest cart abandonment rates, supporting its higher conversion rate.
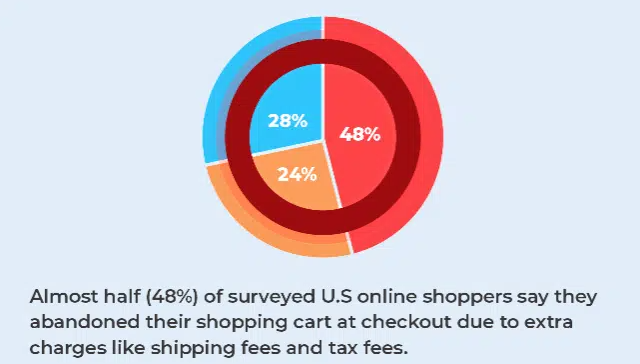
- In the United States, the main reason customers abandon their carts is that extra costs, like shipping, taxes, and fees, should be lowered at checkout.
Sales Funnel Conversion Rates Statistics
- The average conversion rate for sales funnels is between 3% and 7%.
- To find the sales funnel conversion rate, use this formula: Total Conversions ÷ Total Leads in the Funnel × 100.
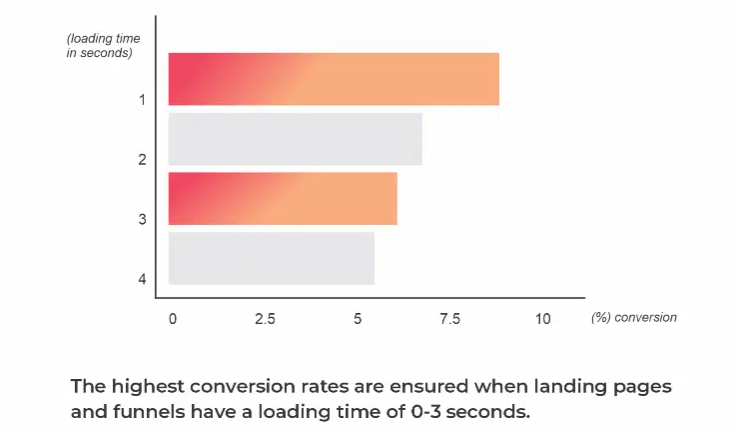
- The best conversion rates occur when landing pages and funnels load in 0-3 seconds.
 (Source: passivesecrets.com)
- Sales Funnels Statistics stated that about 71% of marketers trust their marketing strategies.
- 69% of surveyed marketers say their yearly goal is to turn contacts and leads into paying customers.
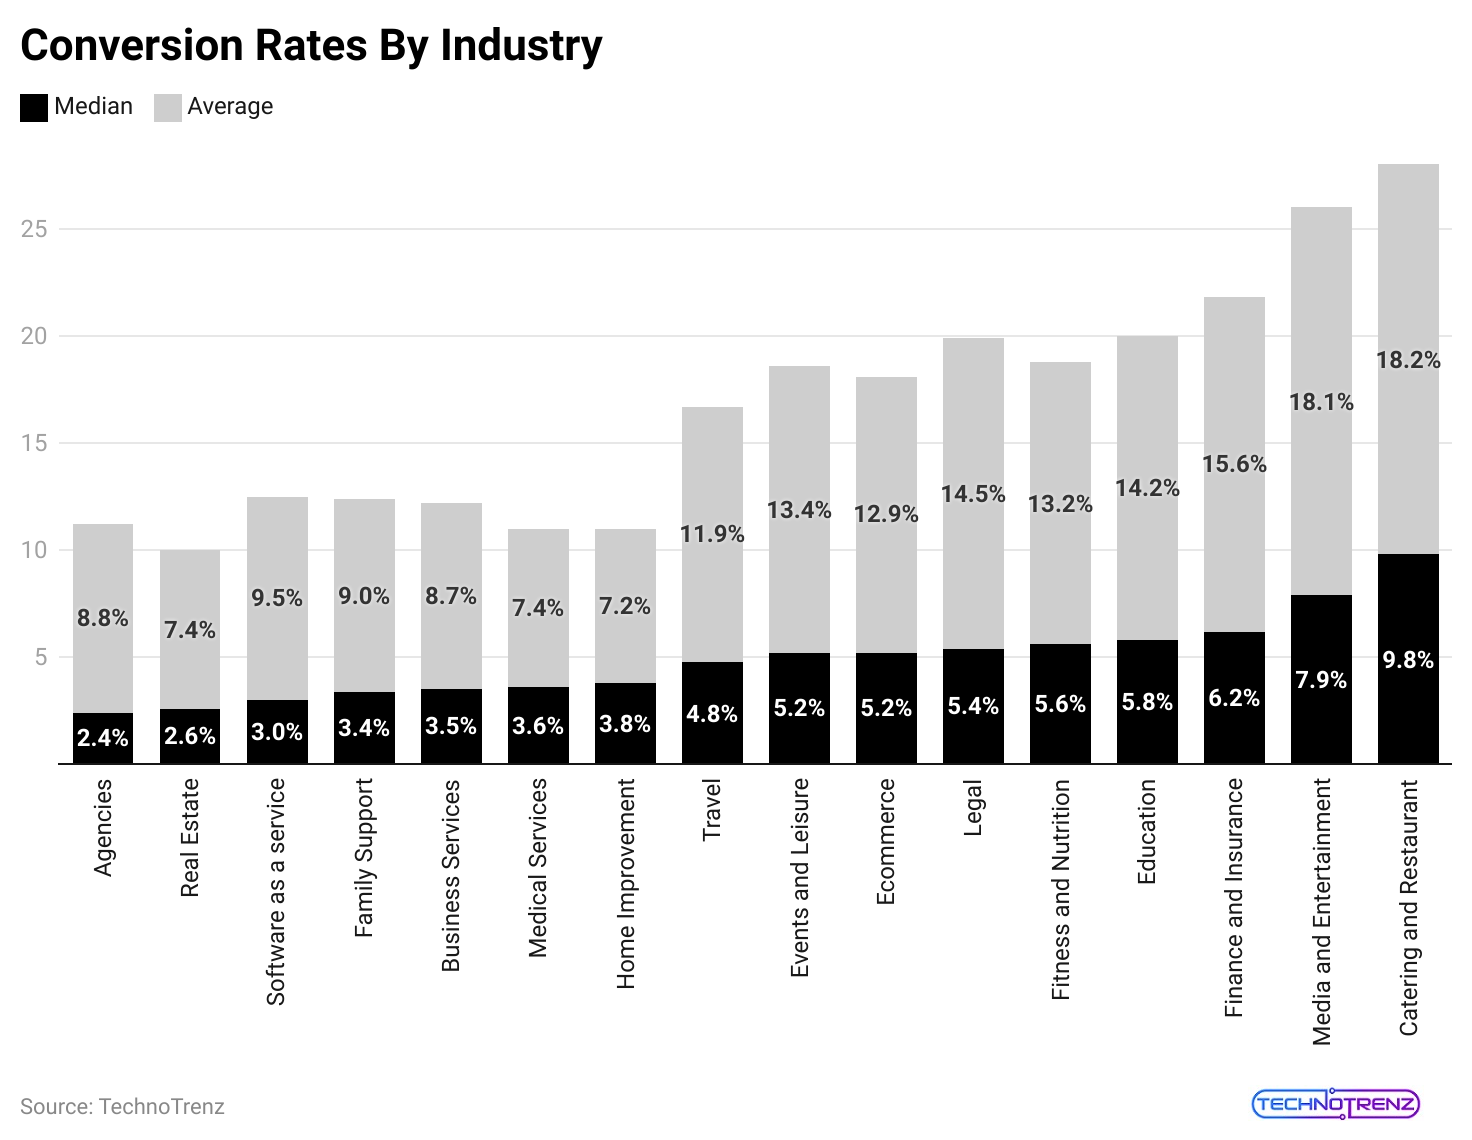
- The biggest B2B medium sales funnel change rate by market is 10% in professional and financial services.
- The minimal B2B median sales funnel conversion rate is 2% in the non-profit sector.
- Almost half (48%) of U.S. online shoppers report abandoning their carts at checkout because of extra costs like shipping and taxes.
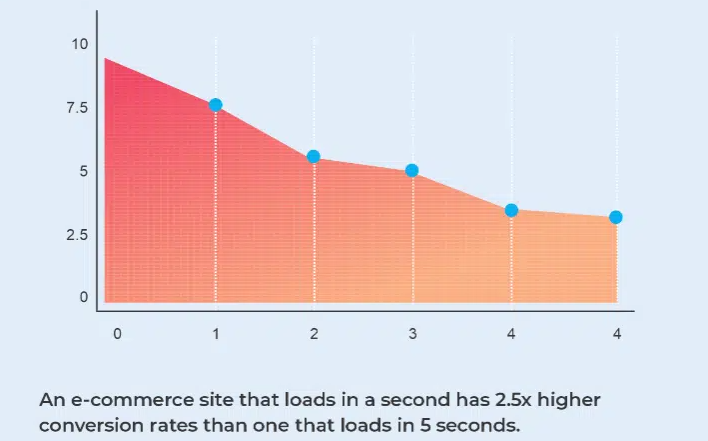
- An e-commerce site that loads in 1 second has conversion rates that are 2.5 times higher than a site that takes 5 seconds to load.
 (Source: passivesecrets.com)
- 96% of visitors to your website are not ready to buy anything on their first visit.
- However, many are likely to share their personal information in exchange for helpful content.
- The average conversion rate for landing pages is 2.35% across all industries. The top 25% of landing pages achieve conversion rates of 5.31% or higher.
- The best landing pages have conversion rates of 11.45% or more, as per Sales Funnels Statistics.
- The average conversion rate for desktop sites is 1.9%. A conversion rate of 0.3% puts you in the lowest 20%. If your rate is 4.7% or 7.2%, you’re in the top 20% or 10%, respectively.
- In 2022, the mobile e-commerce conversion rate was 2%, which accounted for 68% of total e-commerce traffic.
- The highest average conversion rate for sales funnels from traffic sources is 2.9% for paid search.
 (Source: passivesecrets.com)
- Facebook ads convert at an average of about 9.21%. However, this can vary widely and may not be the best way to measure ad success. For instance, retail ads convert at 3.26%, while fitness ads have a conversion rate of 14.29%.
- Following are the conversion rates by acquisition channels:
| Acquisition Channel | Conversion Rate- Lead to Opp | Conversion Rate (normalized) |
|
Sales Prospecting |
0.90% | 0.31 |
| 0.55% |
0.19 |
|
|
Inbound |
3.82% | 1.30 |
| Event | 1.48% |
0.50 |
|
Paid Marketing |
2.98% | 1.01 |
| Webinar | 1.61% |
0.55 |
|
Nurture |
0.58% | 0.20 |
| Referral | 10.99% |
3.74 |
|
Partner |
4.54% | 1.54 |
| Social Media | 1.95% |
0.66 |
- A strong middle-of-the-funnel (MoFu) engagement and lead management strategy can boost your opinion rate by 4 to 10 times.
- As of late 2022, the average conversion rate for e-commerce is 3.65%, and all e-commerce segments saw a growth of 19.63% in July 2022.
- Only 22% of businesses are happy with their conversion rates, as per Sales Funnels Statistics.
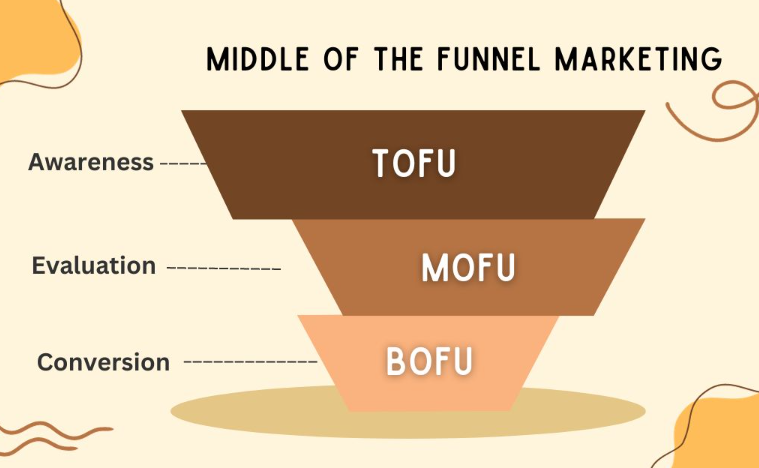
Middle Of The Funnel (MOFU) Statistics
 (Source: justwords.in)
#1. Lead Qualification Statistics
- About 85% of B2B companies see lead generation and qualifying marketing qualified leads (MQLs) to sales qualified leads (SQLs) as their main goal. This shows how essential a strong sales funnel is for turning leads into sales opportunities.
- Around 53% of marketers spend more than half of their budget on lead generation, highlighting the need for an effective sales funnel to nurture leads from first contact to sales qualification.
- Companies that publish 15 blog posts each month can generate about 1,200 new leads, showing how content marketing helps fill the sales funnel with quality MQLs.
- 78% of businesses use email marketing to generate leads, emphasizing the importance of targeted email campaigns in moving MQLs closer to becoming SQLs.
- 66% of marketers successfully generate leads by spending just six hours a week on social media, showing how it can enhance the sales funnel.
- For B2B companies, 80% of social media leads come from LinkedIn, making it a great source for high-quality MQLs that are likely to convert into SQLs.
- Marketing automation software can increase qualified leads by up to 451%, demonstrating how this technology helps streamline strategies for finding and nurturing potential SQLs.
- Despite focusing on lead generation, 68% of B2B businesses struggle with it, indicating a need for better methods to qualify leads.
- 68% of B2B businesses use strategic landing pages for lead generation, showing the importance of targeted content in converting visitors into MQLs.
- Only 56% of B2B businesses check leads before sending them to sales, suggesting room for improvement to ensure only quality leads are pursued.
- Sales Funnels Statistics stated that almost 80% of B2B businesses generate leads through content marketing, showing its role in helping MQLs become SQLs.
- Companies with a blog get 67% more leads than those without, highlighting the blog’s importance in attracting potential customers.
- Content marketing produces three times more leads than traditional methods at 62% lower costs, demonstrating its efficiency in building a strong sales funnel.
- Marketers who use blogging and content marketing are 13 times more likely to see a positive return on investment (ROI), proving these strategies are effective for generating leads and boosting profits.
- Email marketing is the top lead generation tool, potentially bringing in $44 for every $1 spent, emphasizing its role in converting MQLs to SQLs.
#2. Lead Nurturing
- Nurtured leads create 20% more sales opportunities than those that aren’t nurtured, showing the importance of lead nurturing in improving sales conversion rates.
- Companies that excel at lead nurturing have a 23% shorter sales cycle for nurtured leads compared to those that aren’t nurtured, speeding up the sales process.
- Nurtured leads tend to spend 47% more than those who are not nurtured, indicating that nurturing helps increase the value of each sale.
- Lead nurturing emails get 4 to 10 times more responses than regular email blasts, showing their effectiveness in a comprehensive sales strategy.
- The best types of content for lead nurturing are e-books (71% effectiveness), white papers (83%), on-demand webinars (63%), and infographics (22%), which engage and educate leads.
- According to Sales Funnels Statistics, marketers face major challenges in the lead nurturing, including creating relevant content (59%) and personalizing campaigns (32%).
- Marketing automation can increase qualified leads by 451%, showcasing its potential to enhance lead nurturing.
- 50% of buyers choose the vendor that responds the fastest, highlighting the need for timely engagement in lead nurturing.
- Effective lead nurturing not only helps convert new leads but also maintains relationships with current customers, building loyalty and encouraging repeat business.
Most Effective Type Of Content Through Sales Funnel
 (Reference: markinblog.com)
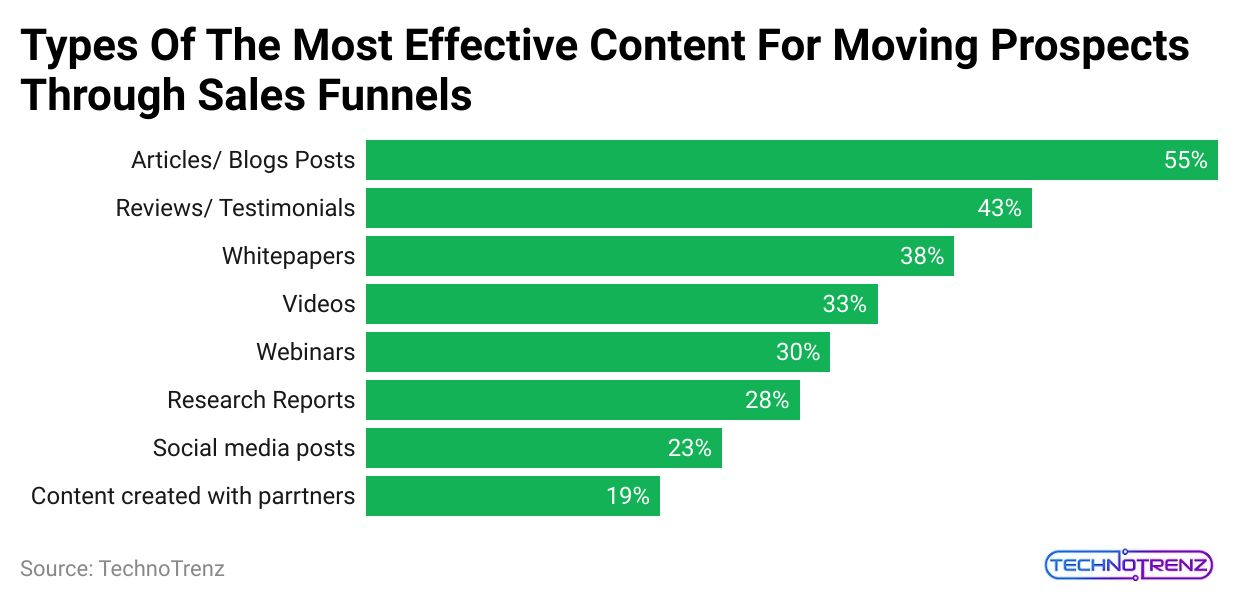
- According to Sales Funnels Statistics, about 55% of companies think that articles and blog posts are the best way to help prospects move through the sales funnel.
- In a 2023 survey of B2B marketing professionals in the U.S., 55% of the respondents said that articles and blog posts were the most useful content for guiding prospects through the sales funnel.
- Additionally, 43% of respondents mentioned that customer reviews and testimonials also helped move prospects through the B2B sales funnel.
- Conversely, social media content and content created with partners were seen as the least effective, with only 23% and 19% of respondents considering them helpful, respectively.
Sales Funnel Software Statistics
| No. | Technology | Website |
|
10 |
Deadline Funnel | 7,300+ |
| 9 | CartFlows |
8,300+ |
|
8 |
Ontraport | 9,800+ |
| 7 | Kartra |
14,100+ |
|
6 |
GrooveFunnels | 14,500+ |
| 5 | Kajabi |
34,000+ |
|
4 |
Keap | 37,800+ |
| 3 | Builerall |
54,000+ |
|
2 |
OptimizePress | 56,900+ |
| 1 | ClickFunnels |
319,900+ |
Sales Funnel Statistics By Landing Pages
 (Source: enterpriseappstoday.com)
- Landing pages and sales pages with video content can boost conversion rates by 86%.
- Every e-commerce product page should include 4-5 videos and over eight images. Buyers aged 18-24 and 35-44 especially prefer this.
- Funnels and landing pages that show social proof see a conversion increase of 1.10%.
- 78% of the best landing pages have location information in their titles, 36% include testimonials, and 30% highlight featured testimonials.
- Only 20% of visitors focus on the content of a website, while 80% only glance at the headlines.
- Using testing and targeting can raise the conversion rate of the sales funnel by 300%.
- Landing pages with 1 Call-To-Action (CTA) convert 1.6% more visitors, resulting in a 13.5% conversion rate. Pages with 2-4 CTAs convert 11.9% of visitors.
- In 2022, companies with over 30 landing pages generated seven times more leads, while those with 40 landing pages produced 12 times more leads.
- About 60% of businesses use A/B split testing, which is a valuable method for evaluating landing page performance.
- Fewer than 20% of businesses have used effective testing methods, as per Sales Funnels Statistics.
Conclusion
The article on Sales funnel statistics highlights how much the industry has improved in the past year. Sales funnel statistics are useful for creating targeted content that connects with customers and increases conversion rates for businesses. A sales funnel is divided into four main stages: awareness, interest, consideration, and action. This article shares important statistics to help newcomers understand sales funnels better.
Sources
FAQ.
The sales funnel conversion rate is the percentage of potential customers who move through the stages of the sales funnel and make a purchase or reach another goal. This rate is essential for understanding the effectiveness of your sales process and marketing strategies.
The funnel CRM, or customer relationship management funnel, is a user-friendly tool designed for freelancers and small businesses. It helps them capture leads, manage customer relationships, grow their client base, and increase their business.

Saisuman is a professional content writer specializing in health, law, and space-related articles. Her experience includes designing featured articles for websites and newsletters, as well as conducting detailed research for medical professionals and researchers. Passionate about languages since childhood, Saisuman can read, write, and speak in five different languages. Her love for languages and reading inspired her to pursue a career in writing. Saisuman holds a Master's in Business Administration with a focus on Human Resources and has worked in a Human Resources firm for a year. She was previously associated with a French international company. In addition to writing, Saisuman enjoys traveling and singing classical songs in her leisure time.