Instagram Demographics Statistics By Users, Gender, Region, Business, Growth, Influencer And Audience
Updated · Sep 27, 2024

WHAT WE HAVE ON THIS PAGE
- Introduction
- Editor’s Choice
- Features Of Instagram
- General Instagram Statistics
- Instagram User Statistics
- Instagram Influencer Marketing Statistics
- Instagram Gender Demographics Statistics
- Instagram Regional Demographics Statistics
- Instagram Demographics By Income And Education
- Instagram Demographics For Business
- Global Instagram Monthly Active Usage Growth Trends
- Instagram Reels Demographics Statistics
- Instagram Stories Business Statistics
- Instagram Influencer Statistics
- Instagram Demographics Statistics By Age
- Instagram Engagement Statistics
- Instagram Audience Demographics Statistics
- Conclusion
Introduction
Instagram Demographics Statistics: Instagram is a popular platform known for its eye-catching visuals and user-generated content. With over 2 billion monthly active users, it offers a lively and engaged community for brands and businesses of all sizes.
Here’s a look at key Instagram Demographics Statistics for 2024 that every social media manager should be aware of. This includes important user demographics, trends in usage, advertising insights, and the rise of video content. Understanding this information can help you improve your brand’s social media strategy and connect better with Instagram’s diverse audience.
Editor’s Choice
- Nearly 51.8% of Instagram users are male, while 48.2% are female. About 47% of American adults prefer using Instagram. It’s the top platform for Gen Z, with most internet users aged 16-24 choosing it over other social media sites.
- According to Instagram Demographics Statistics, 61% of users aged 16-24 are active on Instagram every week.
- Almost one-third (31.3%) of Instagram users are aged 18 to 24, making this the largest group.
- 10% link to a blog post. Only 5% of brands link to campaign pages, and 3% link to apps.
- On average, 130 million users click on shopping posts each month, and it’s expected that 44% of users will purchase Instagram in 2024.
- Additionally, 15% of US shoppers start their online buying journey by searching on Instagram, and almost 83% of consumers use the platform to discover new products or services.
- Most Instagram users are under 34 years old; 70% fall into this age group. Specifically, 7% are aged 13-17, 30% are 18-24, 33% are 25-34, 16% are 35-44, 8% are 45-54, 4% are 55-64, and 2% are 65 and older.
- The largest age group is 25-34, which makes up 31.7% of all users.
- Around 87% of Instagram users live outside the U.S. India has the highest number of users at nearly 230.5 million, followed by the US with 159.75 million and Brazil with 119.45 million.
- The Asia-Pacific region has the most Instagram users, totaling 893 million, followed by Europe, with 338 million, and South America, with 289 million.
- Nearly 62% of Instagram users say they become interested in a brand after seeing it in a creator’s story.
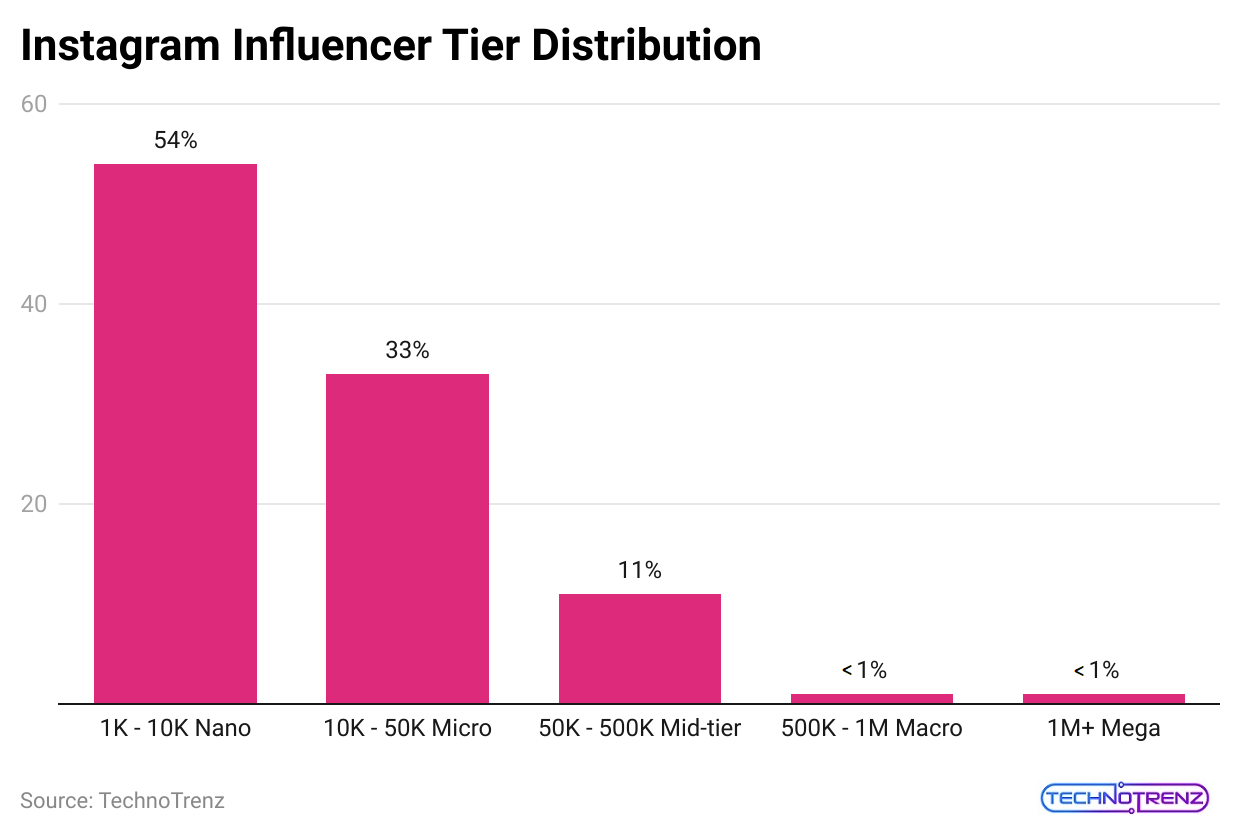
- Almost 54% of influencers are Nano influencers, while 33% are micro-influencers.
- Nano influencers, who have between 1,000 and 5,000 followers, have an average engagement rate of 5.6%.
- 61% of consumers trust recommendations from influencers more than brand messages, and almost 90% of Instagram users follow a business account. The platform has over 2 billion active users each month, and more than 150 million people message brands every month, according to Instagram Demographics Statistics.
- Different industries see varying rates of follower growth: 0.03% for education, 1.59% for entertainment and media, 0.07% for financial services, 0.88% for food and beverage, 0.06% for real estate, 0.37% for retail, and 0.33% for travel and hospitality.
- The potential audience for Instagram ads is 849.3 million users, with 61% of that audience aged 18-34, where males slightly outnumber females.
- About 21% of Gen Z adults in the US use Reels weekly.
Features Of Instagram
When we look at Instagram’s Daily Active Users (DAUs) over time, it’s clear that the addition of exciting new features has greatly boosted user engagement.
- Instagram Stories: A fun way to share photos and videos that disappear after 24 hours.
- Instagram Television (IGTV): This feature lets users upload longer videos, offering more diverse content options.
- Live Video: Users can stream live videos, allowing real-time interaction with their followers.
- Reels: Introduced to compete with TikTok, Reels enables users to create 15-second videos.
- Real-Time Translation: This feature instantly translates comments, captions, and bios, helping Instagram reach non-English-speaking users around the world.
- Ephemeral Messages: Messages that disappear after being viewed, ensuring privacy for users.
- Feed Algorithm: Instagram uses an algorithm to sort the feed, predicting which posts users will enjoy most, which enhances the overall experience.
General Instagram Statistics
- Currently, Instagram has over 2.4 billion users and is expected to reach 2.5 billion by the end of 2024.
- In 2023, India led with 359 million Instagram users, followed by the United States with 158.5 million and Brazil with 123 million. Indonesia, Turkey, and Japan completed the top six.
- As of 2023, about 31% of global Instagram users were aged 18-24, 30.3% were 25-34, and 15.7% were 35-44.
- It’s estimated that around 95 million Instagram users might be bots, costing marketers about $1.3 billion each year.
- In the US, as of August 2023, 27.4% of Instagram users were 25-34 years old, 25.1% were 18-24, less than 6% were 13-17, and those aged 65 and older made up 5.2%.
- On a typical day, the average Instagram user spends 33.1 minutes on the app.
- As of January 2023, about 18% of active worldwide Instagram operators were men aged between 18 and 24.
- In January 2019, there were 500 million daily active Stories users on Instagram, up from 400 million in June 2018. By 2022, over 900 million people were engaging with Instagram Stories.
- According to Meta, their new Threads app gained 2 million users within the first two hours of launch.
- According to Instagram Demographic Statistics for January 2024, Cristiano Ronaldo had the most followers on Instagram, with over 617 million.
- In India, as of January 2024, Virat Kohli leads with over 265 million followers, while Priyanka Chopra Jonas has nearly 90.2 million followers, making her second among actors.
Instagram User Statistics
- Instagram Demographics Statistics stated that more than half of Instagram users worldwide are 34 years old or younger.
- As of January 2024, almost 17% of global active Instagram users are men between the ages of 18 and 24.
- The largest groups of Instagram users are Millennials and Gen Z, who will make up 61.8% of all users in 2024.
- Instagram is the second most popular social media platform for Gen Z, with 75% of users saying they use it, just behind YouTube at 80%.
- About 37.74% of the world’s 5.3 billion active internet users regularly visit Instagram.
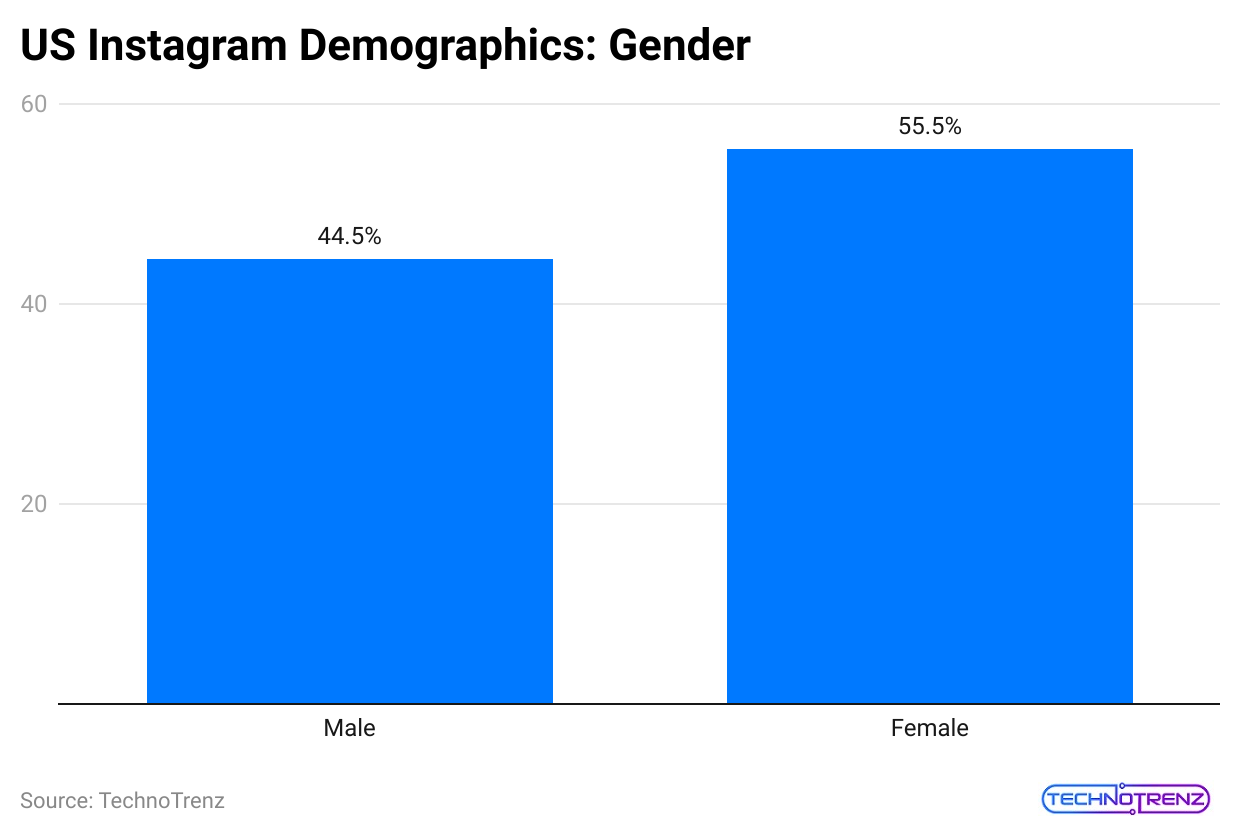
- In January 2024, 55% of Instagram users in the US were women, while 44% were men.
- Instagram Demographics Statistics stated that only 7% of Instagram users in the US are between the ages of 13 and 17.
- As of 2024, just 5.7% of Instagram users in the US are 65 years old or older.
 (Reference: oberlo.com)
- Only 0.2% of Instagram users are unique to the platform. Most also use Facebook (80.8%), YouTube (77.4%), and TikTok (52.8%).
- Instagram users often have higher incomes, with 47% reporting a household income over $75,000.
- On average, Instagram users on Android spend about 29.7 minutes each day (14 hours and 50 minutes each month) on the app.
- 73% of US teens think Instagram is the best way for brands to connect with them.
- More than 500 million accounts use Instagram Stories every day.
- 35% of music fans in the US who follow artists on Facebook and Instagram do so to connect with other fans or feel part of a community.
- The average Instagram user spends about 33 minutes a day on the app.
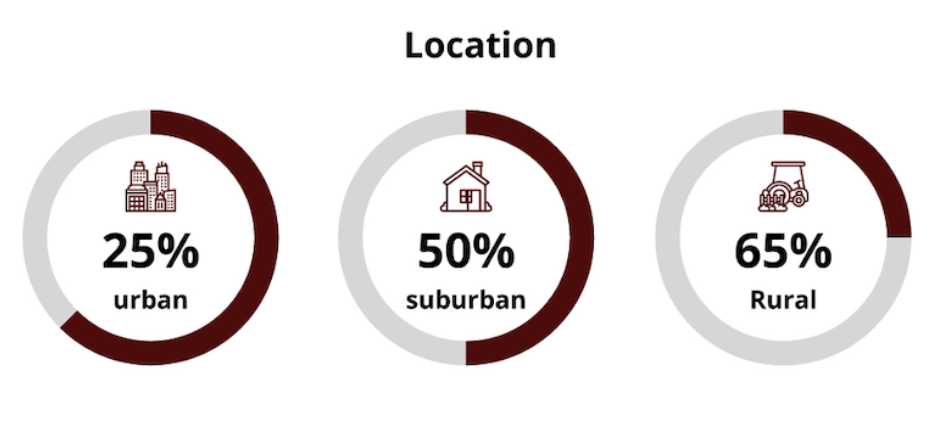
- 45% of people in cities use Instagram, while only 25% of those in rural areas do.
- Around 85% of Instagram users are under 45 years old, according to Instagram Demographics Statistics.
- As of January 2024, the largest age group on Instagram is 18-24, making up 32%, followed by 30.6% who are 25-34 years old.
- Globally, the gender distribution on the platform is nearly equal, with 51.8% male users and 48.2% female users.
- The figures are a bit different in the US: 56% of users aged 13 and older are female, while 44% are male.
- As of January 2024, Instagram has the most users in India, with 358.55 million, followed by the United States (158.45 million), Brazil (122.9 million), Indonesia (104.8 million), and Turkey (56.7 million).
- 49% of Instagram users have completed a college degree.
- More than 1.628 billion Instagram users can be targeted through advertising.
- As of January 2024, 20.3% of people around the world use Instagram.
Instagram Influencer Marketing Statistics
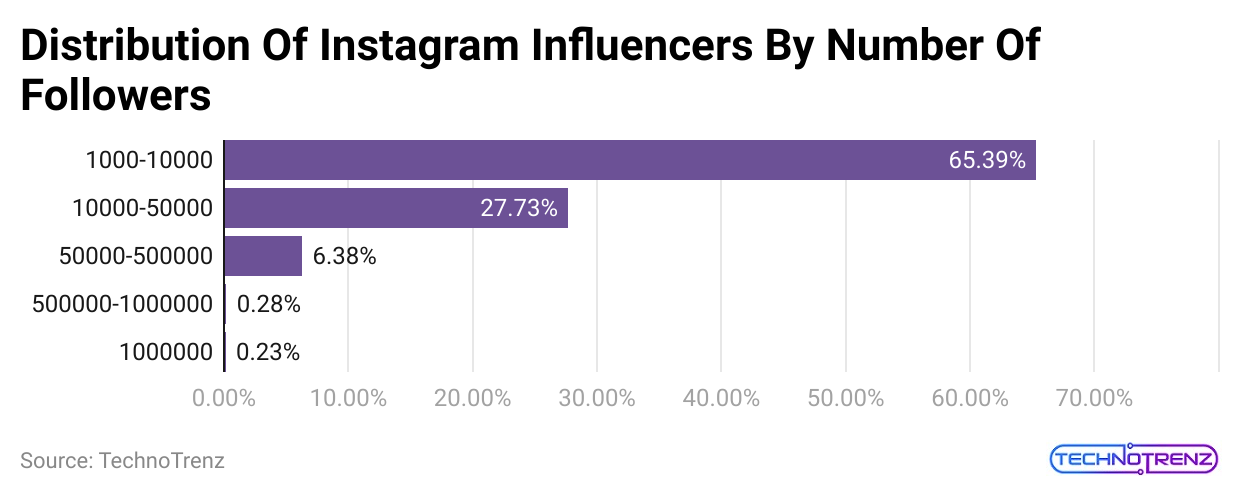
- There are over 500,000 active influencers on Instagram.
- Around 65.39% of these influencers have between 1,000 and 10,000 followers.
 (Reference: bizcognia.com)
| Number of Followers | % |
|
1,000-10,000 |
65.39% |
| 10,000-50,000 |
27.73% |
|
50,000-500,000 |
6.38% |
| 500,000-1,000,000 |
0.28% |
|
1,000,000 |
0.23% |
- Instagram is considered the most important social media platform for influencer marketing by 89% of marketers.
- Influencers on Instagram with 1,000 to 10,000 followers usually charge between $20 and $100 for each post.
- Following are the distribution of Instagram Influencers and their Fees by number of followers:
| Number of Followers | Minimum | Maximum |
|
1,000-10,000 |
$20 | $100 |
| 10,000-50,000 | $35 |
$450 |
|
50,000-500,000 |
$150 | $2,500 |
| 500,000-1,000,000 | $350 |
$7,000 |
|
1,000,000 |
$1,200 |
N/A |
- Around 84.2% of Instagram influencers get requests to create posts for brands.
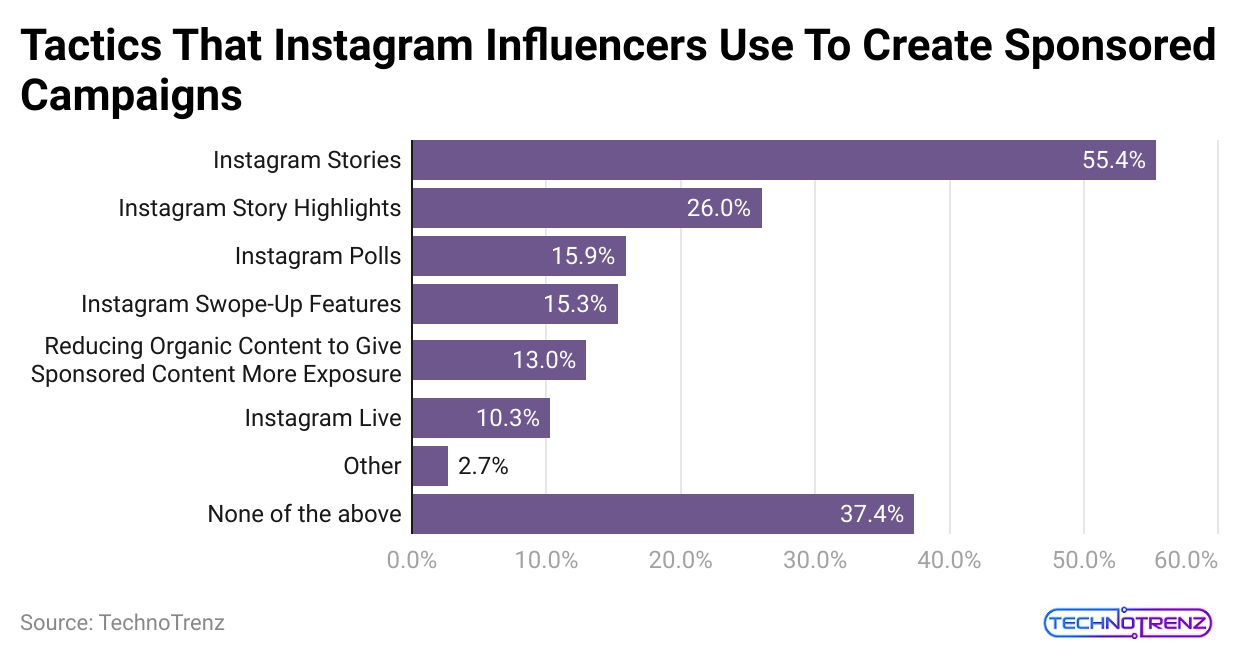
- About 55.4% of Instagram influencers worldwide use stories for their sponsored campaigns.
 (Reference: bizcognia.com)
| Tactics | % |
|
Instagram Stories |
55.4% |
| Instagram Story Highlights |
26% |
|
Instagram Polls |
15.9% |
| Instagram Swope-Up Features |
15.3% |
|
Reducing Organic Content to Give Sponsored Content More Exposure |
13% |
| Instagram Live |
10.3% |
|
Other |
2.7% |
| None of the above |
37.4% |
- Around 45.32% of Instagram influencers have used fake methods to increase their engagement rates and follower numbers.
- About 61.23% of influencers with more than one million followers have been involved in such dishonest practices.
- The typical engagement rate for Instagram influencers is 1.9%, as stated in Instagram Demographics Statistics.
- Influencers with 1,000 to 10,000 followers see the highest engagement rate at 2.53%.
- Most Instagram influencers, around 14.32%, focus on lifestyle content.
Instagram Gender Demographics Statistics
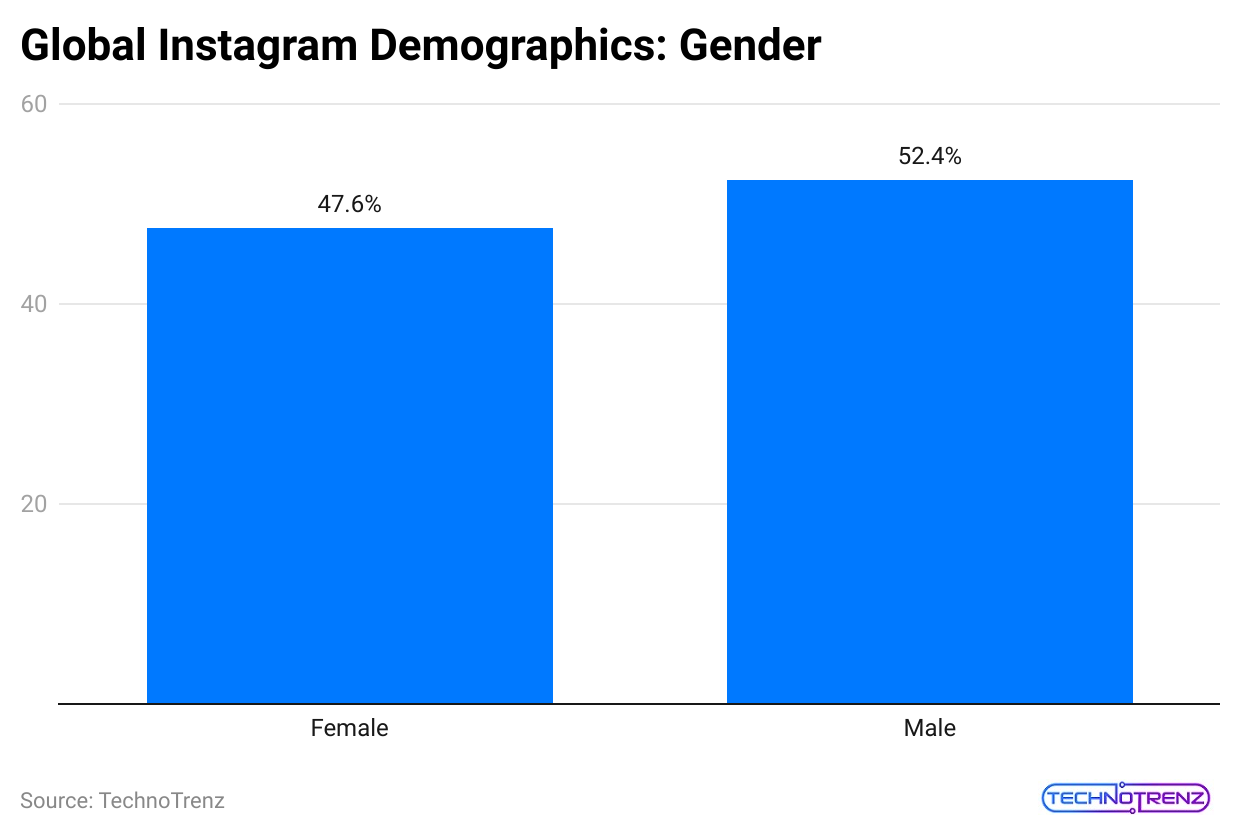
- Recent data shows that Instagram has a fairly equal distribution of genders among its global users.
- Specifically, 47.6% of Instagram users are female, while males make up 52.4% of the total user base.
- This almost even split suggests that Instagram appeals to a wide variety of gender groups, making it a flexible platform for different types of content and interactions.
- The male-to-female ratio on Instagram is similar to that of other major social media platforms like Facebook, TikTok, and YouTube, where males also make up a larger portion of the users.
 (Reference: oberlo.com)
| Gender of Instagram user (global) | Market share |
|
Male |
52.4% |
| Female |
47.6% |
- Additionally, the global usage rate of Instagram shows that 29.2% of men use the platform, which is slightly higher than 26.2% of women.
| Gender of Instagram users (Global) | Adoption rate |
|
Male |
29.2% |
| Female |
26.2% |
 (Reference: oberlo.com)
| Gender of the Instagram user (US) | Market share |
|
Male |
44.5% |
| Female |
55.5% |
- Unlike the global numbers, Instagram’s gender demographics in the United States show a different trend.
- According to the latest statistics from 2024, there are more female users than male users in the US. Females account for 55.5% of the user base, while males make up 44.5%.
| Gender of the Instagram user (US) | Market share |
|
Male |
54.1% |
| Female |
65.0% |
- The adoption rate of Instagram among women in the US is 65%, which means that nearly two-thirds of women there actively use the platform. In comparison, the rate for men is much lower at 54.1%.
- This difference suggests that gender preferences and social media habits can vary a lot from one area to another.
- Businesses looking to target the US market should consider these demographics to create effective sales strategies.
Instagram Regional Demographics Statistics
 (Reference: doofinder.com)
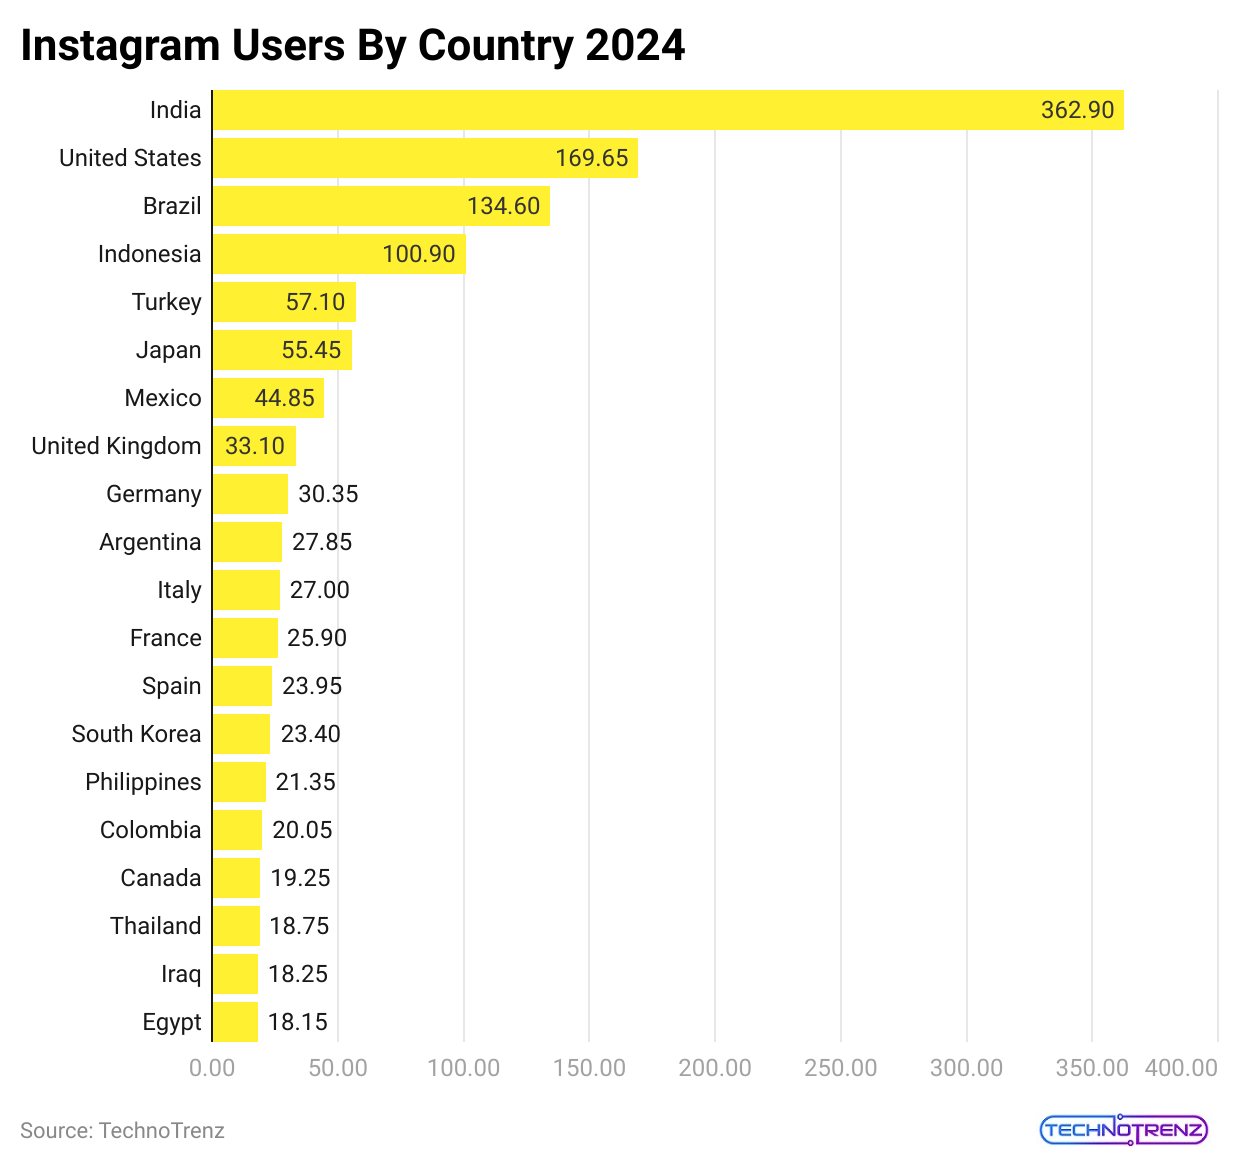
- India: With an impressive 362.90 million users, India shows how Instagram is part of daily life and entertainment.
- United States: With 169.65 million users, the US remains a key market for Instagram, highlighting its ongoing popularity among diverse groups.
- Brazil: Known for its vibrant social media scene, Brazil has 134.60 million users, reflecting the country’s love for lively online interactions and visual content.
- Indonesia: With 100.90 million users, Indonesia has a strong presence on the platform and embraces Instagram’s storytelling through visuals.
- Turkey: Turkey has 57.10 million users, which shows the app’s importance in business and social connections.
- Japan: Close behind Turkey, Japan has 55.45 million users, blending Instagram’s visuals with its rich culture of art.
- Mexico: With 44.85 million users, Instagram is a popular platform in Mexico, demonstrating its reach across North and South America.
- United Kingdom: The UK has 33.10 million users, showing strong engagement with Instagram. This reflects its citizens’ love for trends and global connections, as per Instagram Demographics Statistics.
- Germany: With 30.35 million users, Germany shows a growing interest in the platform’s features and influencer culture.
- Argentina: Argentina has 27.85 million users, representing a passionate group of social media fans in South America.
 (Source: wordstream.com)
Beyond The Top Ten, Instagram’s Global Reach Continues:
- Italy: 27 million users
- France: 25.90 million users
- Spain: 23.95 million users
- South Korea: 23.40 million users, reflecting its high-tech society
- Philippines: 21.35 million users
- Colombia: 20.05 million users
- Canada: 19.25 million users
- Thailand: 18.75 million users
- Iraq: 18.25 million users
- Egypt: 18.15 million users
 (Reference: bizcognia.com)
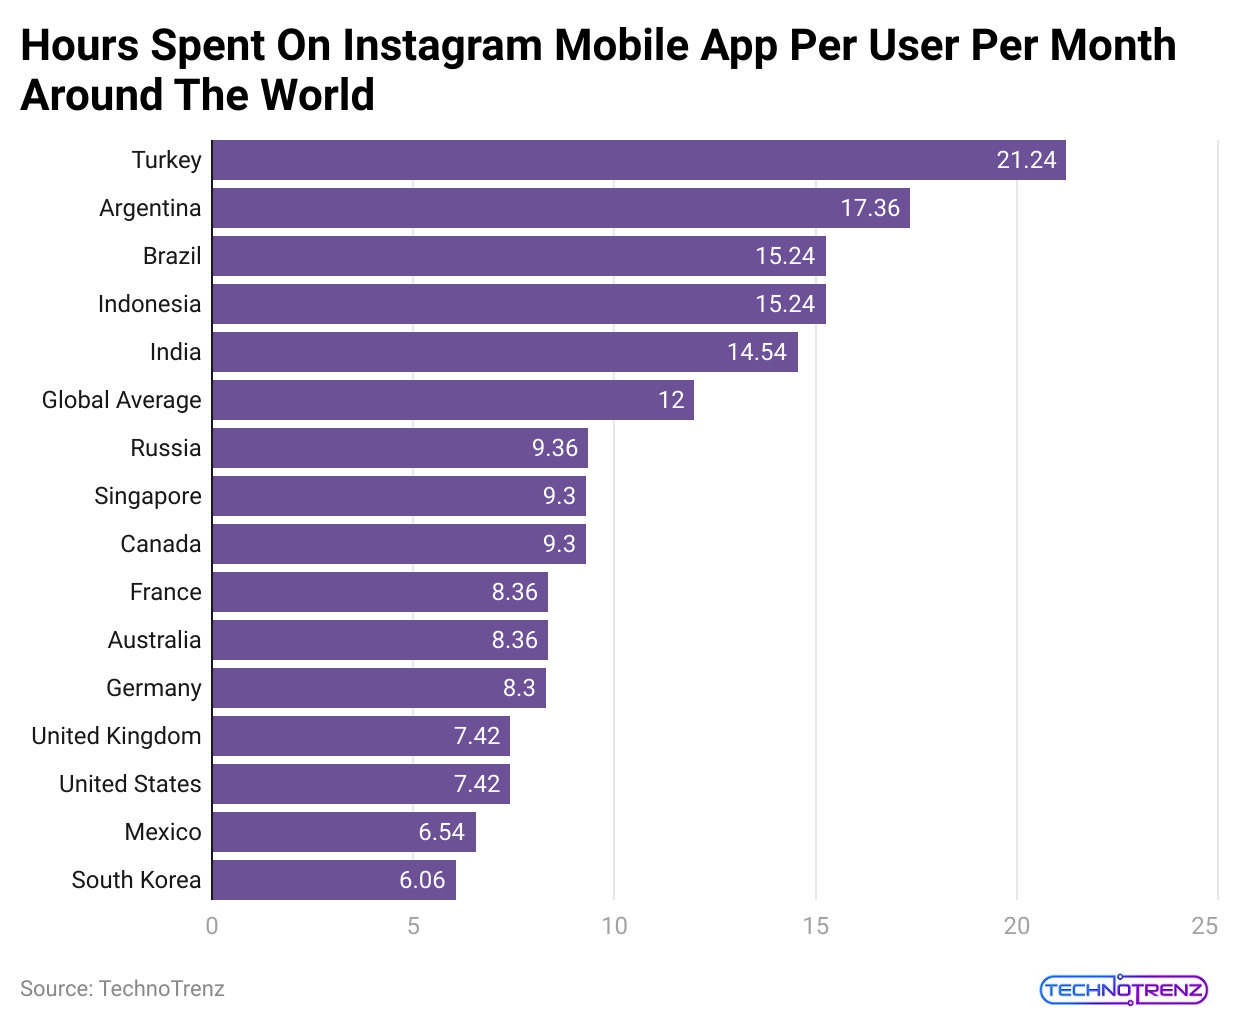
| Country | Hours |
|
Turkey |
21.24 |
| Argentina |
17.36 |
|
Brazil |
15.24 |
| Indonesia |
15.24 |
|
India |
14.54 |
| Global Average |
12 |
|
Russia |
9.36 |
| Singapore |
9.3 |
|
Canada |
9.3 |
|
France |
8.36 |
| Australia |
8.36 |
|
Germany |
8.3 |
|
United Kingdom |
7.42 |
|
United States |
7.42 |
| Mexico |
6.54 |
|
South Korea |
6.06 |
- India’s remarkable 362.90 million users are notable, showing the country’s rapid growth in digital technology and the young population’s eagerness for social media.
- Whether for sharing personal thoughts, engaging in business, or exchanging cultures, Instagram’s strong presence in these top 20 countries clearly shows its essential role in today’s global digital world.
Instagram Demographics By Income And Education
- Instagram earnings vary a lot depending on the niche, follower count, engagement, and partnerships. Here’s what we found for influencers in the USA:
 (Source: wordstream.com)
Travel Influencers:
- Travel bloggers showing off stunning destinations can earn between $200 and $800 per sponsored post if they have 10,000 to 50,000 followers. Those with over 500,000 followers can make between $3,000 and $10,000 per post.
Food Influencers:
- Food influencers sharing tasty dishes and recipes may earn $150 to $600 per post for smaller accounts, while those with over 100,000 followers can earn $1,000 to $5,000 for sponsored content.
Fashion Influencers:
- Fashion influencers with a strong sense of style can make between $200 and $1,000 per post for smaller accounts and $3,000 to $15,000 per post for those with more than 500,000 followers.
Beauty Influencers:
- Beauty influencers focusing on makeup and skincare can earn $200 to $800 per sponsored post for smaller accounts and $1,000 to $5,000 for larger ones. Top beauty influencers with millions of followers can charge $10,000 to $50,000 or more per post.
Fitness Influencers:
- Fitness influencers sharing health tips can earn between $150 and $600 per sponsored post for smaller accounts and $1,000 to $5,000 for those with over 100,000 followers. Those with more than 500,000 followers can make $3,000 to $10,000 or more per post.
- Overall, these figures show that becoming a successful Instagram influencer in different niches can lead to significant income and financial stability.
- Instagram’s education demographics are often overlooked, but they’re very important.
- A Pew survey found that 43% of US adults using Instagram have a college degree or higher, while 37% have a college education.
- Only about 33% of users have a high school diploma or less.
- Many famous colleges and universities worldwide have Instagram accounts. They use the platform to keep current students and alumni connected and engaged with their schools.
Instagram Demographics For Business
#1. Top Platform for Brand Interaction
According to a study by Meta and Ipsos Marketing, Instagram is the best platform for users who want to connect with brands. Users mainly go to Instagram to keep up with their favorite brands, which shows how important it is for brand visibility.
#2. Monthly Follower Growth
On average, Instagram business accounts grow by 0.98% in followers each month. This growth varies by industry:
- Education: 2.43%
- Entertainment and Media: -0.18%
- Financial Services: 3.78%
- Food and beverage: -4.67%
- Real Estate: -8.66%
- Retail: 2.44%
- Healthcare and Wellness: -3.57%
#3. Posting Frequency and Content-Type
Business accounts usually post about 1.71 times a day. Here’s how the content breaks down:
- Photos: 48.9%
- Videos: 31.8% (up from 16.3% last year)
- Carousel Posts: 19.3%
- Engagement Metrics
(Source: impulze.ai)
The average engagement rate for business posts is 0.54%. Videos have a slightly higher rate at 0.61%, while photos get 0.46% as per Instagram Demographics Statistics.
#4. Buying Behavior on Instagram
(Reference: impulze.ai)
In 2023, about 35% of Instagram users are expected to purchase on the platform, closely following Facebook and TikTok, both at 37%.
#5. Starting Shopping Searches
About 15% of US shoppers begin their online searches on Instagram, making it more popular than TikTok, which is at 11%.
#6. Web Traffic Contributions
Instagram drives 7.51% of web traffic referrals from social media, marking an impressive growth of 88.2% from the previous year.
#7. User Trust and Privacy Concerns
Only 25% of Instagram users feel that the platform protects their privacy and data, down from 41% in 2020. However, Instagram is seen as more trustworthy than Facebook, which sits at only 18%.
These insights can help businesses reach their target audience better and create strategies that align with their interests and behaviors.
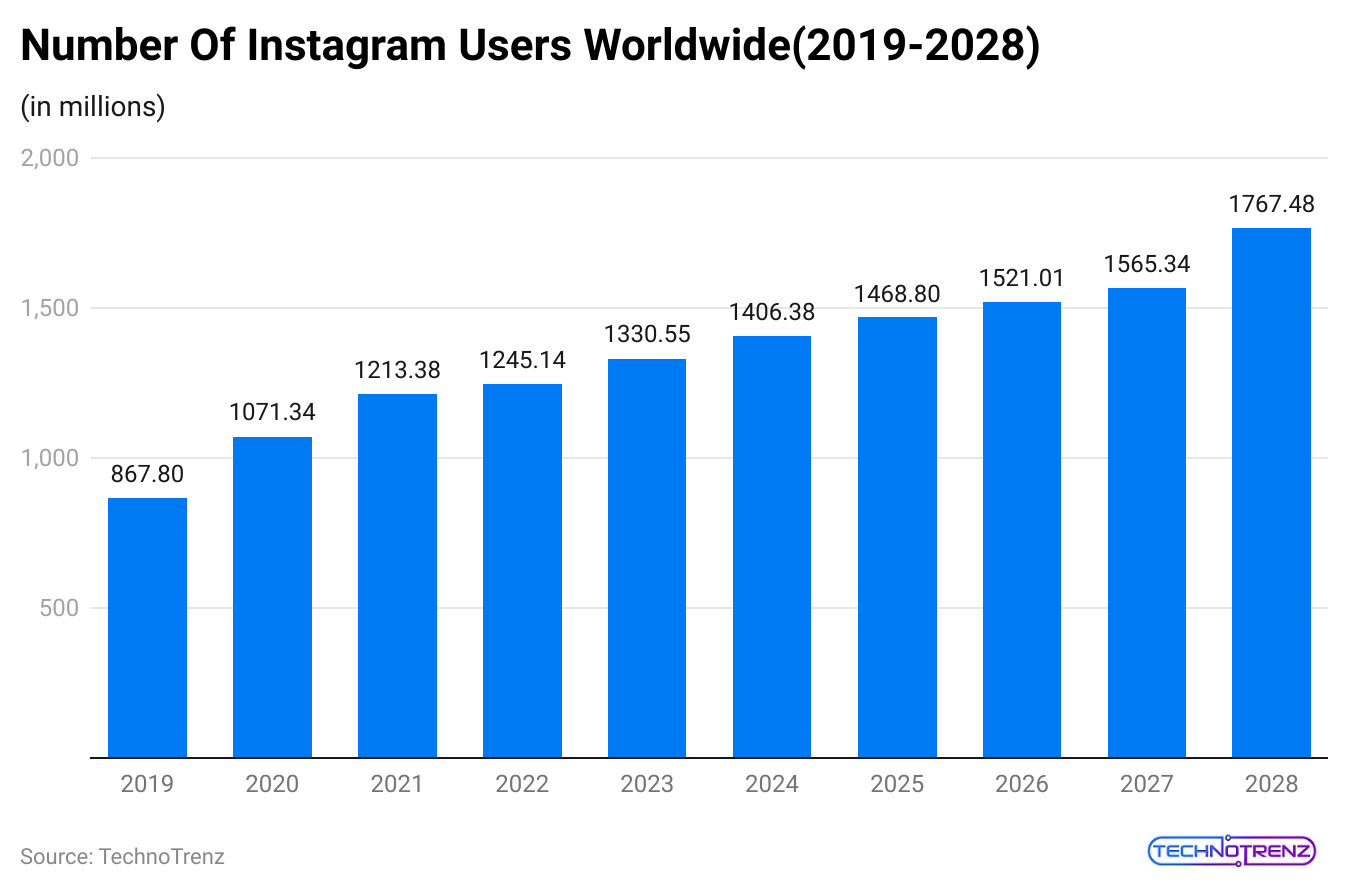
Global Instagram Monthly Active Usage Growth Trends
Instagram has seen different growth rates in its global monthly active users over the past few years, according to the latest data from Instagram, a Facebook company. Here’s a summary of the yearly changes in users:
- 2020 to 2021: Instagram gained about 170 million new users, a big increase likely due to more people using digital platforms during the pandemic.
- 2021 to 2022: Growth slowed down, with around 70 million new users joining. This drop might have been due to things returning to normal around the world.
- 2022 to 2023: The platform continued to grow steadily, adding another 70 million users, showing that interest remained strong despite the earlier slowdown.
- 2023 to 2024: New user growth decreased to 50 million, suggesting a gradual slowdown in the rate at which users join.
- 2024 to 2025: The expected increase is about 40 million users, continuing the trend of slower growth. This prediction is based on current trends and may change due to different market conditions.
Instagram Reels Demographics Statistics
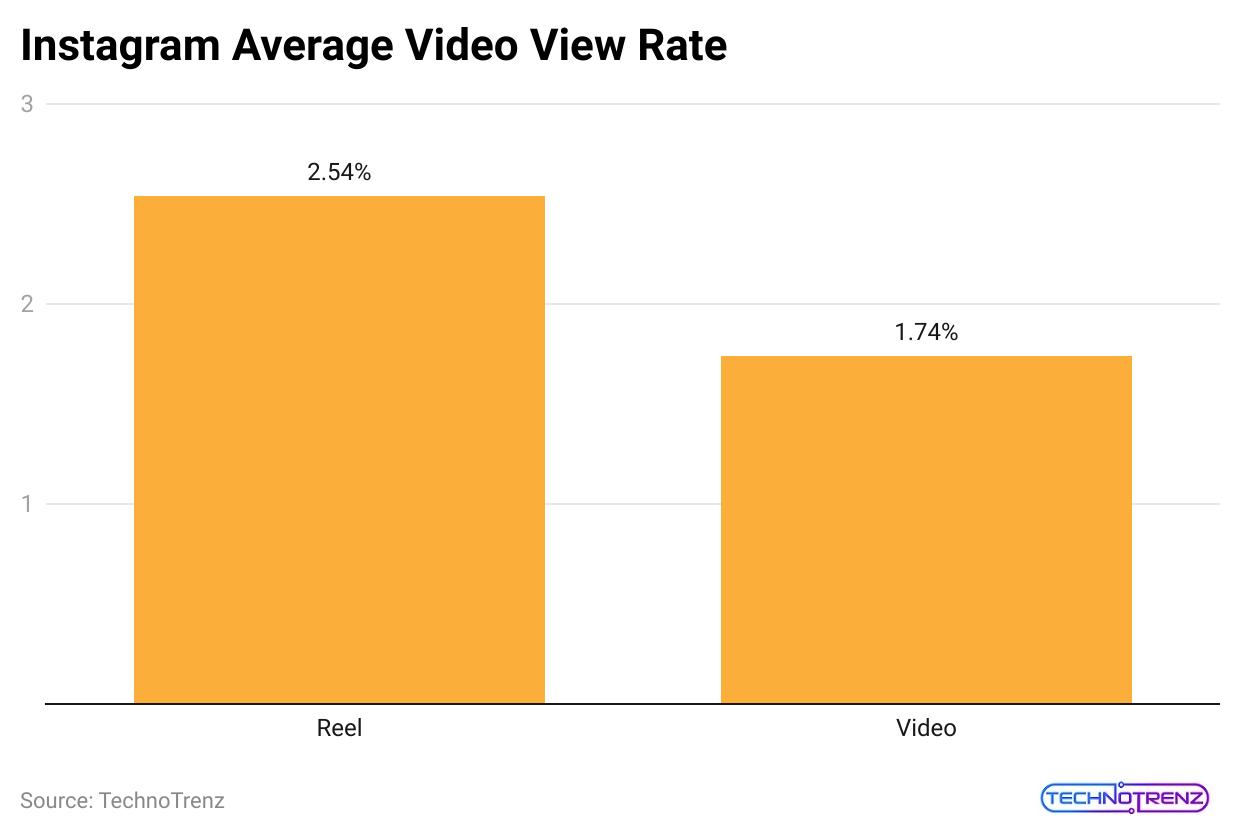
- Reels have the highest reach on Instagram, averaging 30.81%, while images only reach about 13.14%.
- They also have an engagement rate of 1.23%, which is 22% higher than that of regular video posts, according to Instagram Demographics Statistics.
- The number of brands using Reels increased from 19.67% in 2022 to 30.85% in 2023.
(Reference: readwrite.com)
- Although engagement rates are slightly down, Reels remain the most engaging content type on Instagram compared to Stories, Feed Posts, and IGTV. For instance, Nike averages 4.6 million views per Reel.
- About 2.35 billion people interact with Instagram Reels every month.
(Reference: readwrite.com)
- India has the most Reel users, followed by countries where short videos are very popular.
- Gen Z is a major group for Reels, with 87% seeing them as similar to TikTok.
- People watch over 17.6 million hours of Reels every day, and each Reel can be up to 90 seconds long. More brands are using Reels, with a 57.4% increase in usage in 2023.
- 87% of Gen Z believes Instagram Reels and TikTok are pretty much the same.
- Brands typically post an average of 9.44 Reels each month, while they share about 7.67 TikTok’s.
- The average watch rate for Instagram Reels is 13.09%, compared to 9.06% for TikTok.
- Instagram Demographics Statistics stated that TikTok has a higher average engagement rate of 5.53%, while Reels has a rate of 4.36%.
- Users comment on TikTok at a rate of 0.9%, whereas the comment rate on Reels is 0.5%.
Instagram Stories Business Statistics
- One-third of the most-viewed Instagram stories come from businesses.
- Over 50% of Instagram business accounts share a story at least once a month.
- Businesses typically post at least two stories each week, with an average of eight individual frames per story.
- One in five stories receives a direct message response from viewers.
- 36% of users have liked, commented on, or shared a brand’s story.
- 67% of users have swiped up on links in branded Instagram stories, as per Instagram Demographics Statistics.
- Stories make up 34% of all sponsored content on Instagram.
- 79% of Instagram business profiles post stories, and 7% post more stories than feed posts.
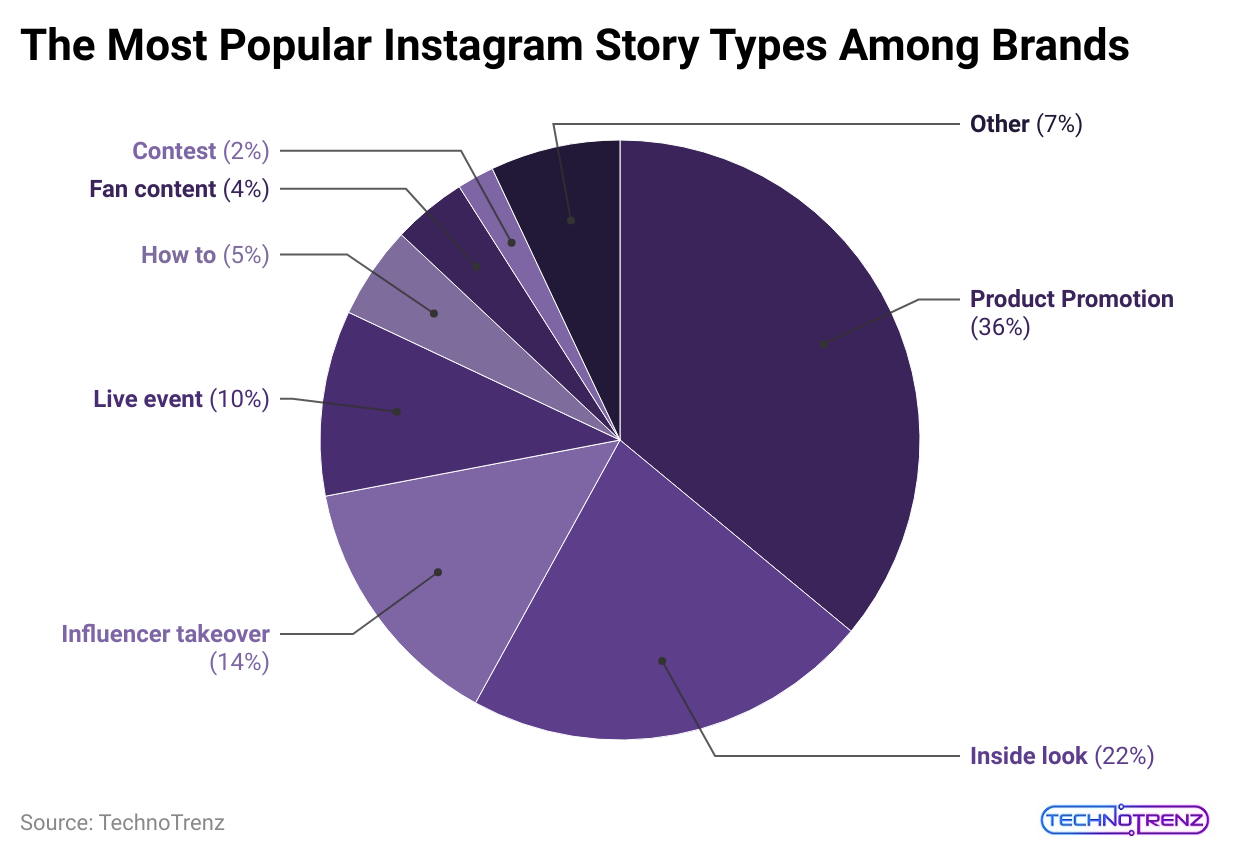
- 36% of businesses use stories to promote products, while 22% share behind-the-scenes looks. Influencer takeovers and live events are used by 14% and 10% of brands, respectively.
 (Reference: bizcognia.com)
- Instagram Demographics Statistics stated that almost 59% of brands connect their stories to pages where users can shop.
- 23% of businesses link their stories to other social media sites.
 (Source: bizcognia.com)
- 10% link to a blog post. Only 5% of brands link to campaign pages, and 3% link to apps.
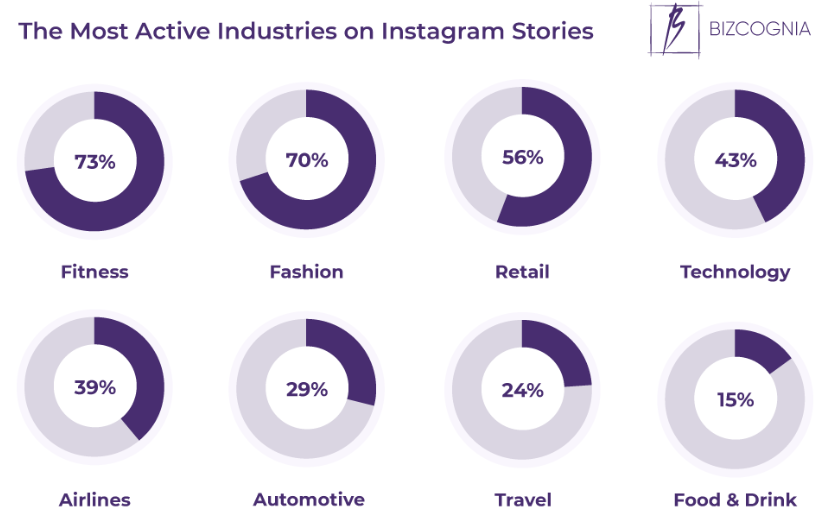
- Fitness and fashion brands use Instagram stories the most.
Instagram Influencer Statistics
Instagram is a key part of the influencer economy, where people earn money based on the number of followers they have.
- There are over 500,000 active influencers on Instagram, according to Instagram Demographics Statistics.
- About 14.32% of these influencers focus on lifestyle content, according to Instagram Demographics Statistics.
- 8% of marketers plan to use Instagram for influencer marketing.
- Influencers get paid based on their follower counts, but if many of their followers are fake accounts, marketers lose money.
 (Reference: grin.co)
- For instance, an influencer with 43,000 followers who posts eight times and shares eight stories each month could earn about $37,442 a year, which is similar to the average income of a UK citizen.
- Influencers with fewer than 10,000 followers usually earn around $80-$90 per post.
- Those with fewer than 100,000 followers make about $200 per post.
- Instagram Demographics Statistics stated that influencers with between 250,000 and 500,000 followers can earn roughly $670 per post.
- Influencers with more than 1 million followers typically earn about $1,900 per post.
- According to Instagram, 87% of people say an influencer has influenced their buying decisions. Additionally, around 70% of “shopping enthusiasts” use Instagram to find new products.
- Even if users don’t buy directly from influencers, their influence helps keep Instagram popular as a shopping destination.
- Picture posts (78%) and stories (73%) are seen as the most effective types of content for engaging shoppers.
Instagram Demographics Statistics By Age
- Almost one-third (31.3%) of Instagram users are aged 18 to 24, making this the largest group.
- The next largest group, 31%, consists of users aged 25 to 34. Together, these two age groups account for over 60% of all Instagram users, indicating that most users are younger.
In these age brackets, there are more male users than female users:
- Male users aged 18–24: 17%
- Female users aged 18–24: 14.3%
- Male users aged 25–34: 17.1%
- Female users aged 25–34: 13.9%
- According to Instagram Demographics Statistics, the third largest age group is users aged 35 to 44, who make up 16.4% of Instagram’s total users.
- Following that, 9% of users are aged 45 to 54, 4.8% are between 55 and 64, and only 3% are 65 and older.
- Notably, among users aged 45 and up, there are more females than males.
 (Reference: oberlo.com)
| The age range of US Instagram users | Share |
|
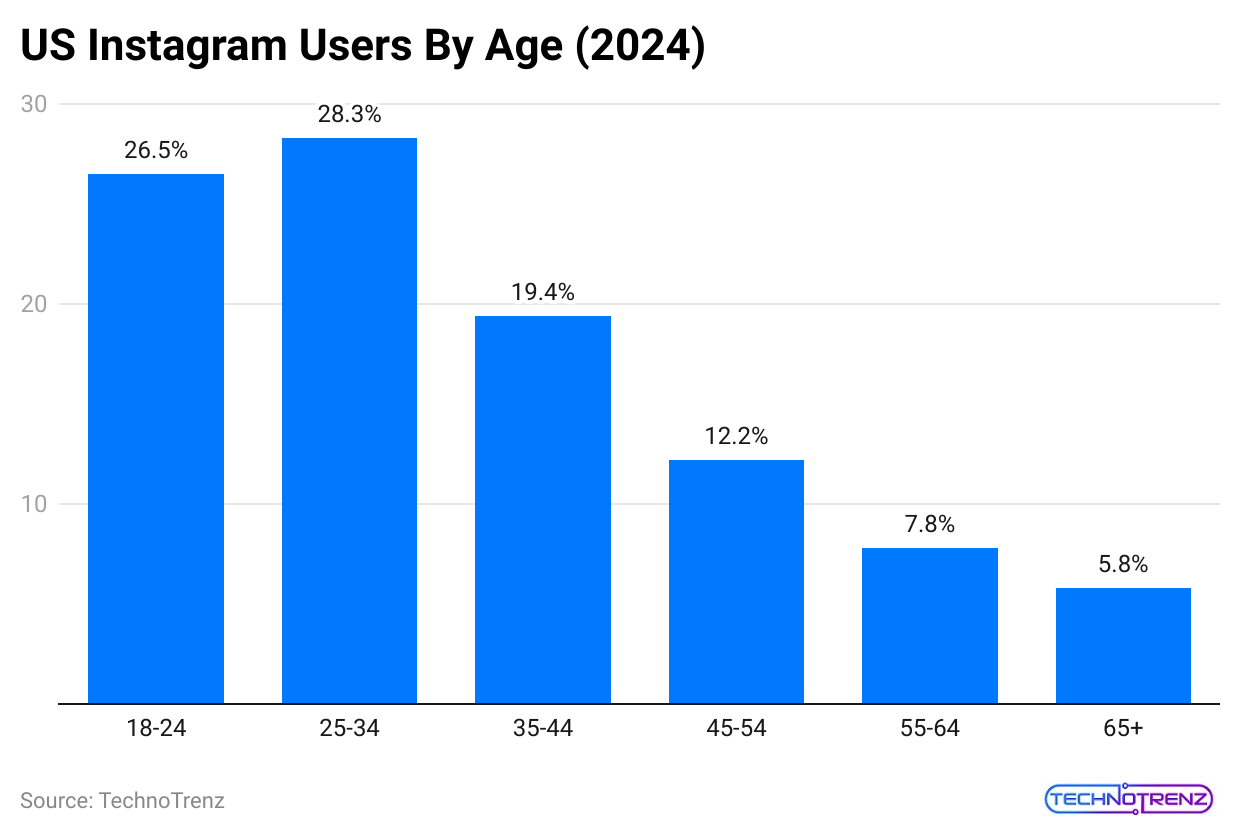
65+ |
5.8% |
| 55-64 |
7.8% |
|
45-54 |
12.2% |
| 35-44 |
19.4% |
|
25-34 |
28.3% |
| 18-24 |
26.5% |
- If your target audience is in the United States, it’s crucial to look at specific data for that area.
- A recent study shows some differences in Instagram age demographics between global users and those in the US.
In the US, the largest group of Instagram users is aged 25 to 34, making up 28.3% of the total users.
- The next biggest group is users aged 18 to 24, who account for 26.5%.
- Users aged 35 to 44 represent 19.4%.
The percentages decrease for older age groups:
- Users aged 45 to 54 make up 12.2%.
- Users aged 55 to 64 account for 7.8%.
- Lastly, users aged 65 and older represent the smallest group at 5.8%.
- If your target audience is between 18 and 34 years old, Instagram is a smart choice for your digital marketing. Running ads or partnering with influencers on Instagram can effectively help grow your brand.
- On the other hand, if your target customers are 45 years old and up, it might be better to look at other marketing options since there are fewer Instagram users in that age group.
Instagram Engagement Statistics
- In 2024, the average Instagram post received 15.66 comments, 513.37 likes, and 19.79 saves. In 2023, posts garnered 14.62 comments, 509.15 likes, and 20.28 saves.
- The category most searched for on Instagram is “Fashion Brands,” making up 12% of searches.
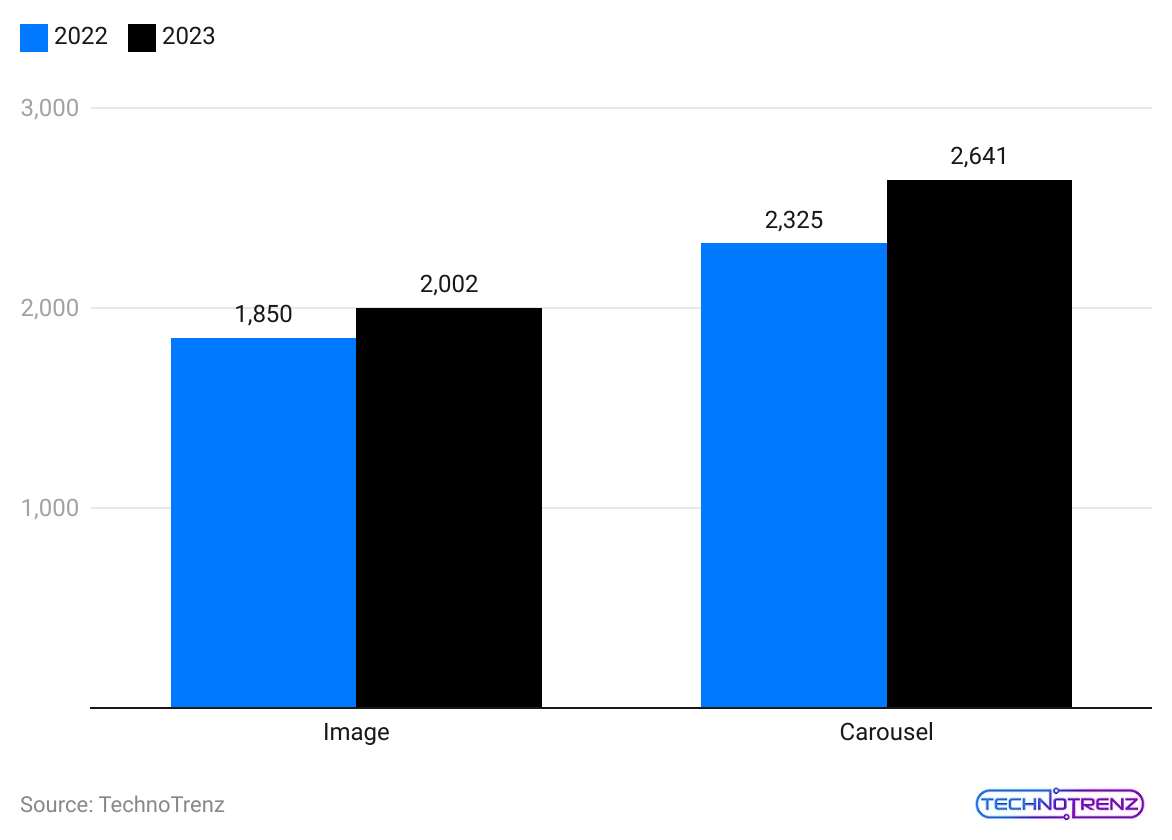
- According to Instagram Demographics Statistics, regular image posts reach about 2,002 users, while carousel posts, which feature multiple images, attract around 2,641 users.
(Reference: socialpilot.co)
- The average engagement rate on Instagram across all industries is 0.43%, with the highest rate for higher education at 2.43%.
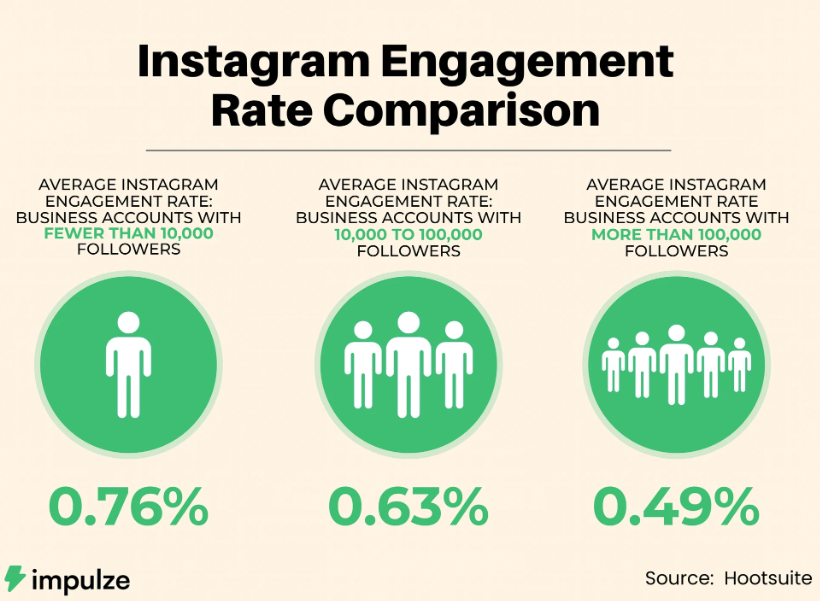
- Business accounts with fewer than 10,000 followers have an average engagement rate of 0.98%.
- Accounts with 10,000 to 100,000 followers have a rate of 0.68%, and those with over 100,000 followers see a rate of 0.57%.
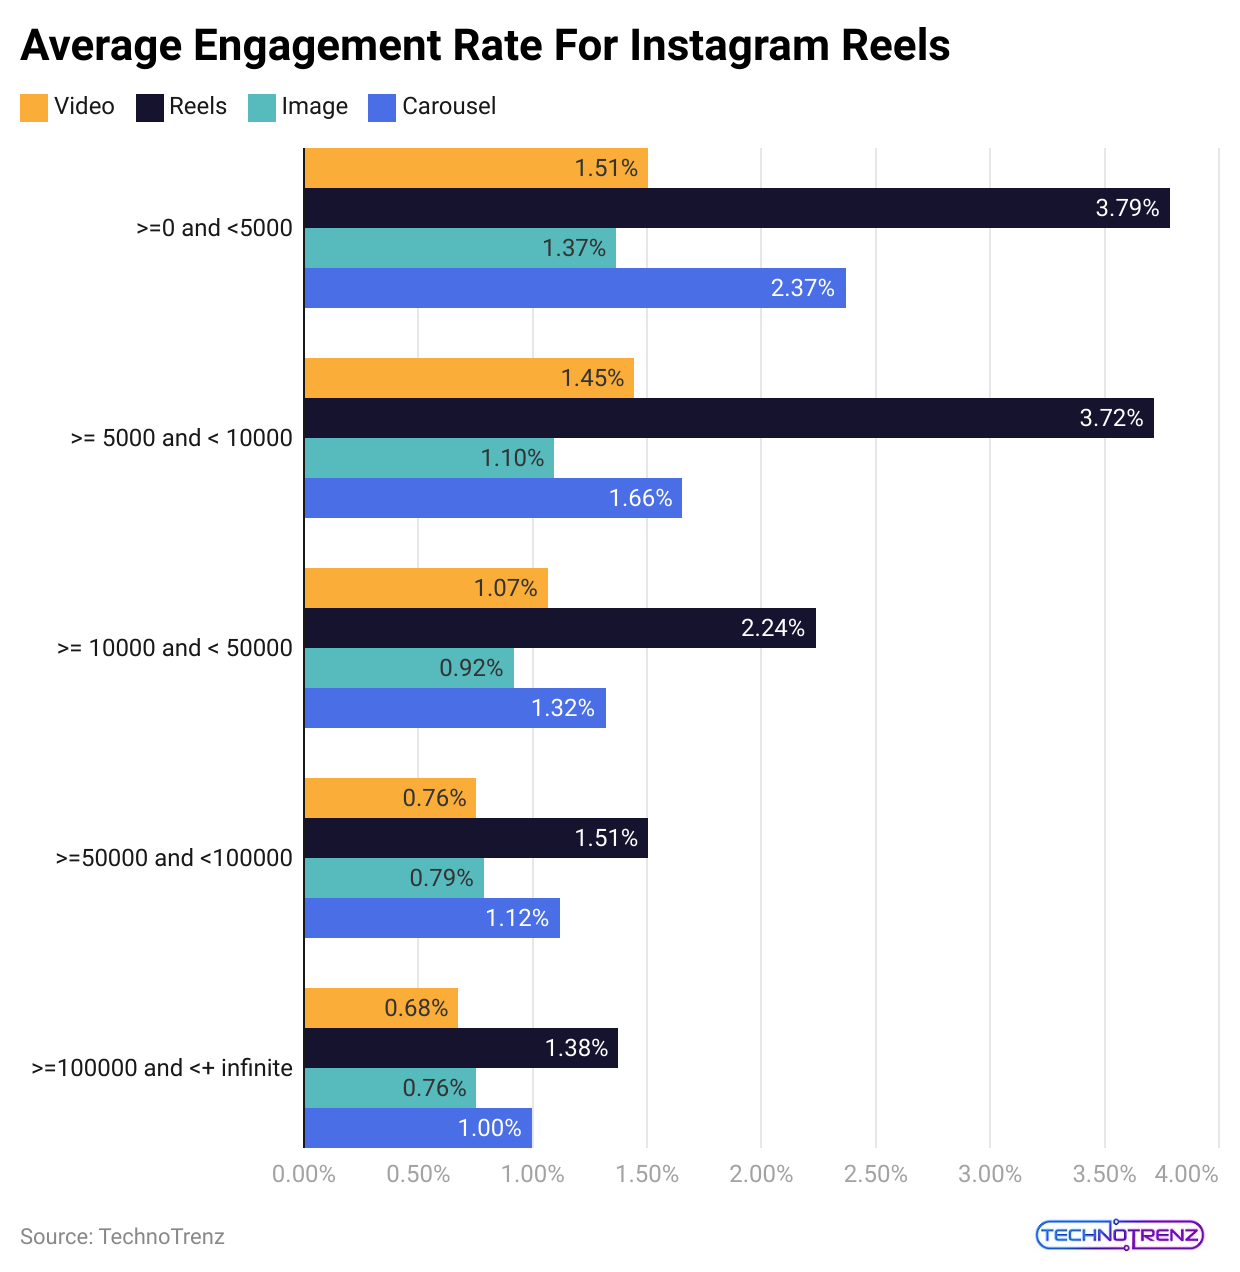
- Instagram Reels get the most engagement, especially from accounts with fewer than 5,000 followers, averaging 3.79%.
- Instagram Demographics Statistics stated that the Reels have 22% more interactions than regular video posts, and users are spending 80% more time watching videos on Instagram as per Instagram Demographics Statistics.
- Top posts usually use around 5.44 hashtags. The best times to post on Instagram are between 7 a.m. and 9 a.m. on weekdays.
- Photos that show faces perform almost 38% better than those without. Instagram videos receive 21.2% more engagement than images.
- Each month, 2.35 billion people interact with Instagram Reels, and 57.2% of all tagged posts come from the USA.
Instagram Audience Demographics Statistics
- Instagram has more than 1 billion active users each month, making it the 6th largest social media network in the world.
- About 23.92% of all mobile internet users globally access Instagram each month.
- To put that in perspective, there are 4.18 billion mobile internet users.
- Nearly 90% of Instagram users follow at least one business, and around 83% have found a new product or service through the app.
- This makes it a great platform for marketers. It’s no surprise that over 71% of companies in the US use Instagram in some way.
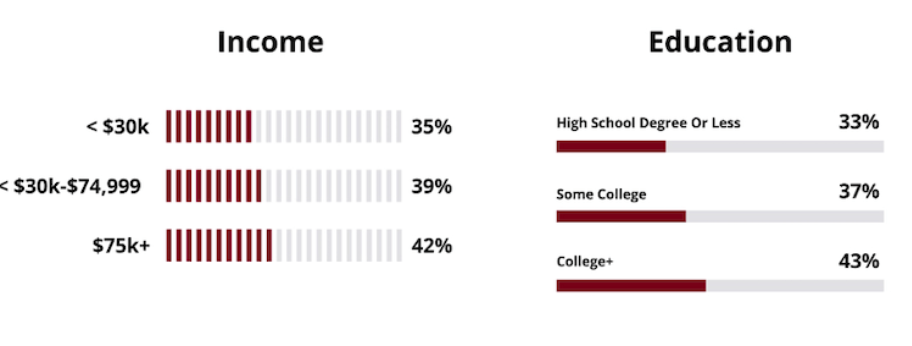
- Over 40% of US adults with a college degree use Instagram. About 43% of US adults with a degree use the platform, while 37% of those with some college education and 33% of high school graduates also use it.
- In the US, roughly 42% of people with a household income over $75,000 use Instagram.
- About 40% of those earning between $30,000 and $74,999 use the platform, and the number drops to 35% for those making less than $30,000.
- Instagram has a 45% reach among urban users in the US, while only 25% of rural residents use it.
- 41% are users in suburban areas. By comparison, Facebook reaches 70% in urban and suburban areas and 67% in rural areas.
- About 52% of Hispanic people in the US use Instagram. The percentage is lower for white users at 35%, while 49% of Black users are on Instagram.
- Other social media platforms show different usage patterns among these groups.
- 45% of Instagram users are interested in travel. Music follows closely at 44%, and food and drinks are popular at 43%.
- 42% of users are interested in fashion, and 41% are into movies. Other interests include health and fitness (35%), technology (32%), skincare/cosmetics (30%), sports (30%), and news (28%).
- There are about 95 million fake accounts on Instagram, which means that roughly 1 in 10 accounts are bots.
- This raises questions about the effectiveness of marketing on the platform. Other networks have similar issues; for instance, about 8.8-14.6% of Twitter accounts are fake.
Conclusion
Instagram is a big name in social media, with over 2 billion active users and millions of interactions every day. This makes it a key platform for businesses and individuals. Because it focuses on visuals and has high engagement, Instagram is perfect for promoting brands and working with influencers.
As its user base keeps growing, Instagram continues to influence digital culture and offers many chances for connection, creativity, and success. We have shed more light on the Instagram Demographics Statistics through this article.
Sources
FAQ.
About 70% of Instagram users are under 34 years old. Here’s how the age groups break down:
- 7% are aged 13-17
- 30% are between 18-24
- 33% are in the 25-34 range
- 16% are aged 35-44
- 8% are between 45-54
- 4% are in the 55-64 age group
- 2% are 65 and older
The largest group on Instagram is the 25-34 age range, which makes up 31.7% of all users.
Recent research indicates that nearly one-third (31.3%) of Instagram users are aged 18 to 24, making this the largest age group on the platform. The next biggest group is those aged 25 to 34, who make up 31% of users.
Recent data shows that around 47.6% of Instagram users are female. This means that males make up a bit more, at 52.4% of all users worldwide.
India and the United States have the highest number of Instagram users. India has about 229.5 million users, while the United States has around 149.35 million users.

Saisuman is a professional content writer specializing in health, law, and space-related articles. Her experience includes designing featured articles for websites and newsletters, as well as conducting detailed research for medical professionals and researchers. Passionate about languages since childhood, Saisuman can read, write, and speak in five different languages. Her love for languages and reading inspired her to pursue a career in writing. Saisuman holds a Master's in Business Administration with a focus on Human Resources and has worked in a Human Resources firm for a year. She was previously associated with a French international company. In addition to writing, Saisuman enjoys traveling and singing classical songs in her leisure time.