Male Vs Female Spending Statistics By Demographics And Spending Habits
Updated · Aug 14, 2024

WHAT WE HAVE ON THIS PAGE
- Introduction
- Editor’s Choice
- General Male vs Female Spending Statistics
- Women’s Spending Based On Demographics
- Single Females Vs Single Men Expenditure Statistics
- Men Vs Female High Expenditure Statistics
- Male Vs Female Spending Statistics
- Male Vs Female Product Preferences Sections
- What Does Each Gender Spend The Most On?
- Women And Global Spending Statistics
- Men vs. Women Spending Habits
- Difference In Employment And Income That May Inform Spending Habits
- Conclusion
Introduction
Male Vs Female Spending Statistics: Regardless of gender stereotypes, how females and males spend money can give an overview of the patterns and trends that have a wide economic impact on everyone. Despite common beliefs, men and women shop in similar ways.
They often choose the same stores, want fast delivery for their online orders, and look for products with many good reviews. This article will shed more light on the Male vs. Female Spending Statistics.
Editor’s Choice
- 67% of women check food labels to see if a product is healthy, while only 48% of men do the same.
- Millennial women are budget-conscious and driven by values:-88% say customer ratings influence their buying decisions, -57% say a brand’s values impact their purchases.
- Women handle 85% of all consumer purchases, as stated by Male vs Female Spending Statistics.
- Men spend about $10 more per online transaction than women.
- Women are more likely to use coupons, with 74% using them regularly compared to 62% of men.
- Men are 20% more likely to make purchases on their mobile devices.
- Women influence 70-80% of all buying decisions.
- Men spend 69% more on audio gear than women.
- 58% of women check products and prices on Amazon.com before shopping elsewhere, compared to 64% of men.
- Women are in charge of 85% of household buying decisions.
- Men spend 30% more on transportation compared to women.
- Women are 50% more likely to use social media to help with their buying decisions.
- Men spend 26% more on alcohol than women.
- Women are more likely to do the grocery shopping, with 70% being the primary grocery shoppers.
- Male vs Female Spending Statistics stated that men spend 18% more on entertainment than women.
- Women are 22% more likely to stay loyal to specific brands.
- Men spend 38% more on buying vehicles than women.
- Women control $31.8 trillion in global spending, as stated by Male vs Female Spending Statistics.
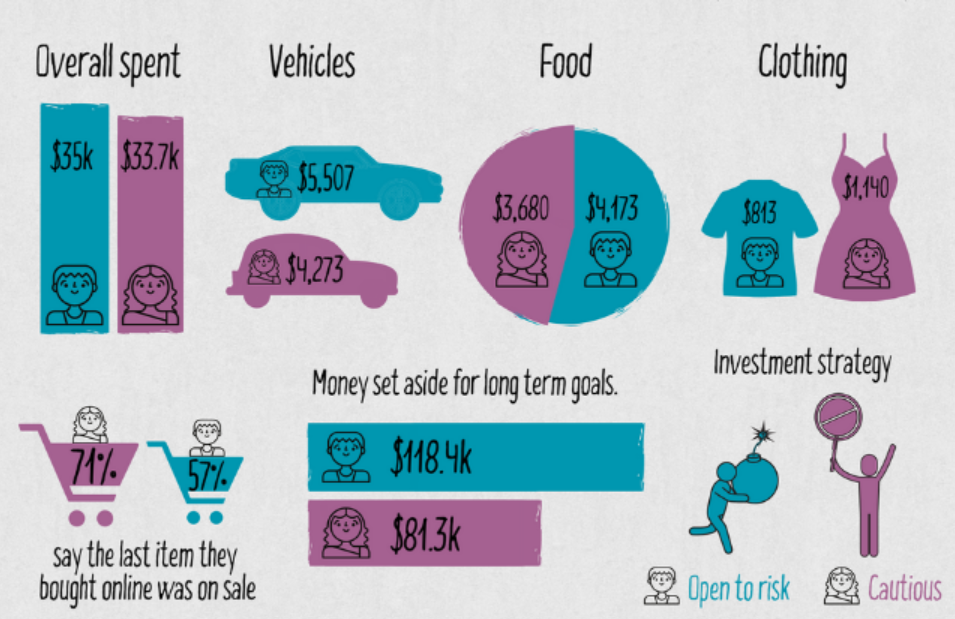
- 74% of women care about finding items on sale when shopping, while only 57% of men feel the same way.
- Nearly 58% of adult men reported drinking in the last 30 days, compared to 49% of adult women.
- The Male vs Female Spending Statistics reports that men are more likely to meet physical activity guidelines than women.
- Gen X women spend more time on social media (7 hours or more per week) than Millennial women (6 hours or more per week).
- Men also spend more on gasoline, averaging $1,227 a year, or 2.98% of their total spending. This is 1.42 times higher than the $813, or 2.09% of the total spending that women spend on gas.
General Male vs Female Spending Statistics
- 47% of females spend more time on online shopping than 39% of males.
- Nearly, 50% of the males buy a smartphone device, compared to around 45% of the females.
- As per Male vs Female Spending Statistics, males are two times as likely as females to spend almost $2,000 or more on gadgets.
- Around men spend a median of $85 per month on personal care items, whereas females spend $135.
- As stated in Male vs. Female Spending Statistics, females spend almost more on groceries, around $316, than men, almost $304, every month.
 (Source: louisianafcu.org)
- Males spend a median of $1,271 on alcohol yearly as compared to females at $724.
- Male vs Female Spending Statistics stated that Males spend nearly 15% more on footwear than females.
- Males account for 62% of all online shopping in the United States of America.
- Nearly 58% of females are savers, compared to just 36% of males, which leads to higher total expenditures by males.
- Mobile gamers are males and spend almost 33% more on smartphone games than females.
- Males spend almost two times as much on entertainment and dining to socialize as females.
- Male vs. Female Spending Statistics stated that females account for almost 53% of United credit card spending, with men making almost 47% of the remaining.
- As per Male vs Female Spending Statistics, males spend around 110% more on electronics than females.
- Females spend a median of $62 on fashion clothing each month, compared to men, who spend almost $53.
- On median, females spend around 379 minutes each week shopping, whereas males spend almost 263 minutes.
- According to Male vs. Female Spending Statistics, males are more prone to make impulse purchases, almost 54% more than females, at 45%.
- As per Male vs Female Spending Statistics females drive almost 75%-85% of the customer’s spending, whereas males control the remaining of 25% to 30%.
Women’s Spending Based On Demographics
Gen Z:
- Gen Z is the most diverse generation so far.
- Nearly 80% (78%) of Gen Z women have stopped supporting a brand due to reasons like high prices, racial issues, poor labor practices, lack of sustainability, or declining product quality.
Top Goals for 2024:
- Financial independence (31%)
- Traveling (27%)
- Success in school (26%)
- Prioritizing mental and physical health (24%)
- Finding a satisfying career (20%)
- Gen Z women are focused on their careers but also want work-life balance. After seeing their parents experience burnout, over half (58%) prefer freelance work or running their own business for more flexibility.
- Male vs. Female Spending Statistics stated that Gen Z women are less interested in marriage and having children than previous generations. 58% say starting their career is more important than starting a family.
- 75% of Gen Z women get most of their news from social media, and 54% actively think about managing their brand on social media.
Important Social Platforms:
- YouTube (62%)
- Instagram (48%)
- Snapchat (46%)
- TikTok (40%)
- Facebook (30%)
- Instagram Live (17%)
Millennial Women
- 60% of U.S. women aged 18-29 are single.
- There was a 31% increase in the number of single U.S. women aged 30-34 from 2007 to 2012.
- 26% of U.S. adults aged 18-32 are married.
- 96% of women list “being independent” as their most important life goal.
- 87% see success as being able to shape their future.
- 68% consider becoming a mom a priority.
- 50% view getting married as a priority. Millennial women have a spending power of $170 billion.
 (Reference: smartasset.com)
- Brand storytelling is effective; 47% of Millennial women are interested in a brand’s “origin story.”
- Millennial women are budget-conscious and driven by values: 88% say customer ratings influence their buying decisions, and 57% say a brand’s values impact their purchases.
- Male vs Female Spending Statistics stated that nearly 90% of Millennials talk to their parents weekly, and 50% communicate with them every day.
- Despite being online often, Millennials rely on in-person recommendations for purchases. Almost 70% seek advice from people they know.
- When buying technology (like computers, cellphones, or tablets), Millennials trust their friends’ advice the most (66%) over their spouse’s or partner’s advice (59%) or their parents’ advice (37%).
- 68% of Millennials are not swayed by celebrity endorsements when choosing brands or products.
Gen-X Women
- Women and minorities made up 64% of Generation X college graduates.
- Gen X women are earning bachelor’s degrees faster than Gen X men. By age 27, 32% of Gen X women had a bachelor’s degree, compared to 24% of Gen X men.
- Gen X women spend more time on social media (7 hours or more per week) than Millennial women (6 hours or more per week).
- 52% of mothers with children under five are employed. This number rises to 77% when their youngest child is between 10 and 14 years old, although most of these jobs are part-time.
- Male vs Female Spending Statistics stated that around 50% of Gen X women believe they are in a worse financial situation than they had expected.
Empty Nesters
- Over 80% of today’s Empty-Nesters shop online and spend more time looking for products online than in physical stores.
- 65% of Empty-Nesters use their smartphones to find product information.
- 80% of Empty Nesters are more likely to buy a product with a high rating in online reviews.
- 75% of Empty Nesters prefer to buy products that have positive reviews from other users, according to Male vs. Female Spending Statistics.
- 45% of Empty-Nesters are more likely to purchase a product if it is recommended by a blogger they follow.
Boomers Women
- Male vs Female Spending Statistics stated that one in five adults in the U.S. is a woman over 50.
- Women aged 50 and older are the healthiest, wealthiest, and most active generation of women ever.
- Women over 50 control a total net worth of $19 trillion.
- In the next decade, women will manage two-thirds of consumer wealth in the U.S., benefiting from the largest wealth transfer in U.S. history, estimated between $12 trillion and $40 trillion.
- Many Baby Boomer women will receive inheritances from both their parents and spouses.
- After paying college expenses, women over 50 spend 2.5 times more than the average person and are major buyers of computers, cars, banking, and financial services.
- Wealthy Baby Boomer women are key players in U.S. culture and business. They are well-educated, earn high incomes, and make 95% of their household’s purchase decisions.
- Over 30 million women aged 50 and older are the fastest-growing group online.
- Women aged 50 and older spend, on average, 250% more than the general population.
- Baby Boomer women spend more than $20 billion annually on clothing
Single Females Vs Single Men Expenditure Statistics
- There are significant differences in spending on clothes and services. Single women spend 1.79 times more on clothing, shoes, and accessories than single men on similar items.
- On average, women spend $671 a year, which is 1.73% of their total spending, on apparel and services.
- In contrast, men spend $398 a year, or 0.97% of their total spending, which creates a 1.79-times difference.
- The gap is even wider when you compare what men spend on clothes and services for the women in their lives.
- Men spend just $32 annually, or 0.08%, compared to women’s $671, or 1.73%.
- This results in a massive 22.25 times difference, the largest one in our analysis.
 (Reference: capitaloneshopping.com)
|
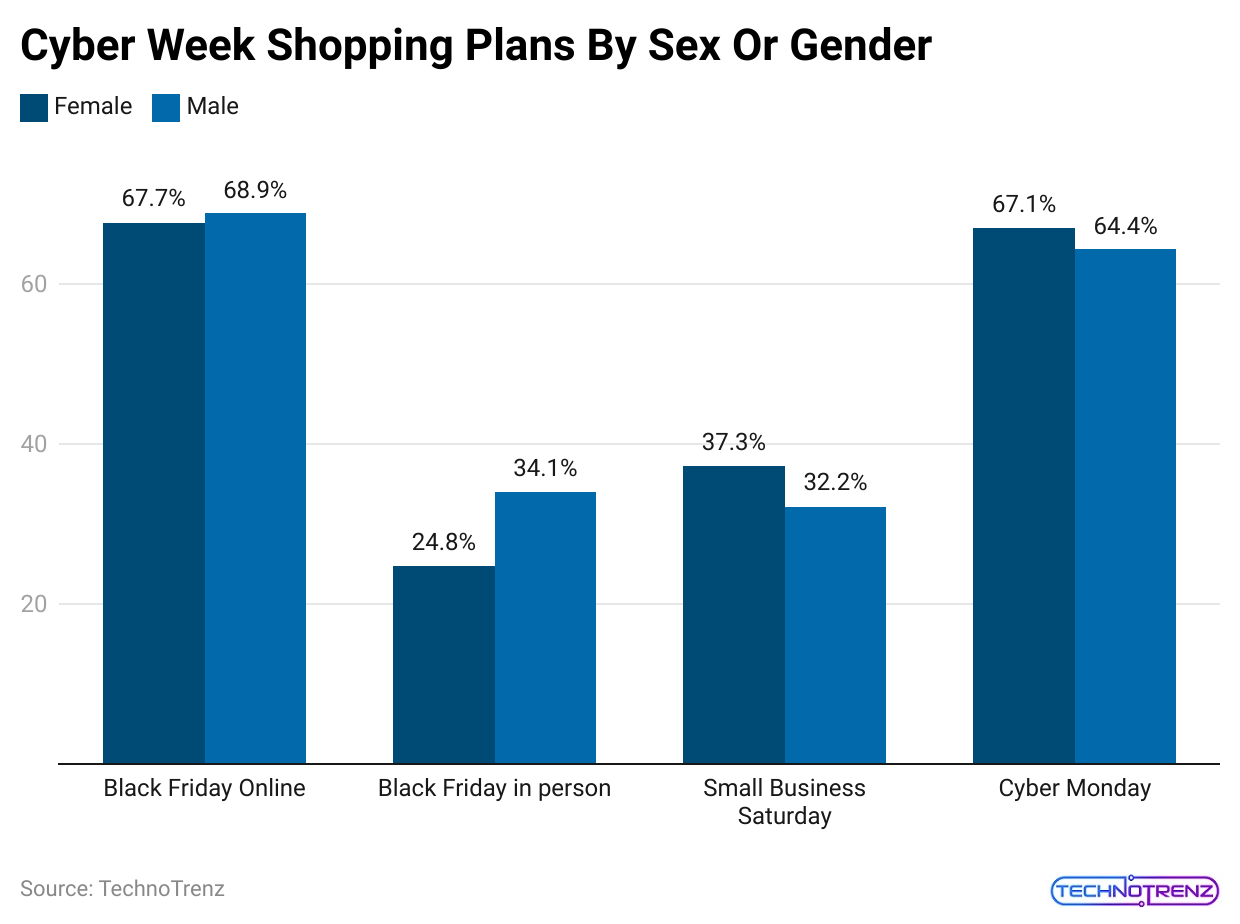
Category |
Female | Male |
| Black Friday Online | 67.7% |
68.9% |
|
Black Friday in person |
24.8% | 34.1% |
| Small Business Saturday | 37.3% |
32.2% |
|
Cyber Monday |
67.1% |
64.4% |
Here are some examples of what’s included in apparel and services:
- Men’s and boys’ clothing: Coats, sweaters, shorts, and uniforms
- Women’s and girls’ clothing: Coats, blouses, dresses, and nightwear
- Baby clothing: Coats, diapers, dresses, and shoes
- Footwear: Shoes, slippers, and boots
- Other: Fabric for making clothes, dry-cleaning, jewelry, and watches.
(Reference: capitaloneshopping.com)
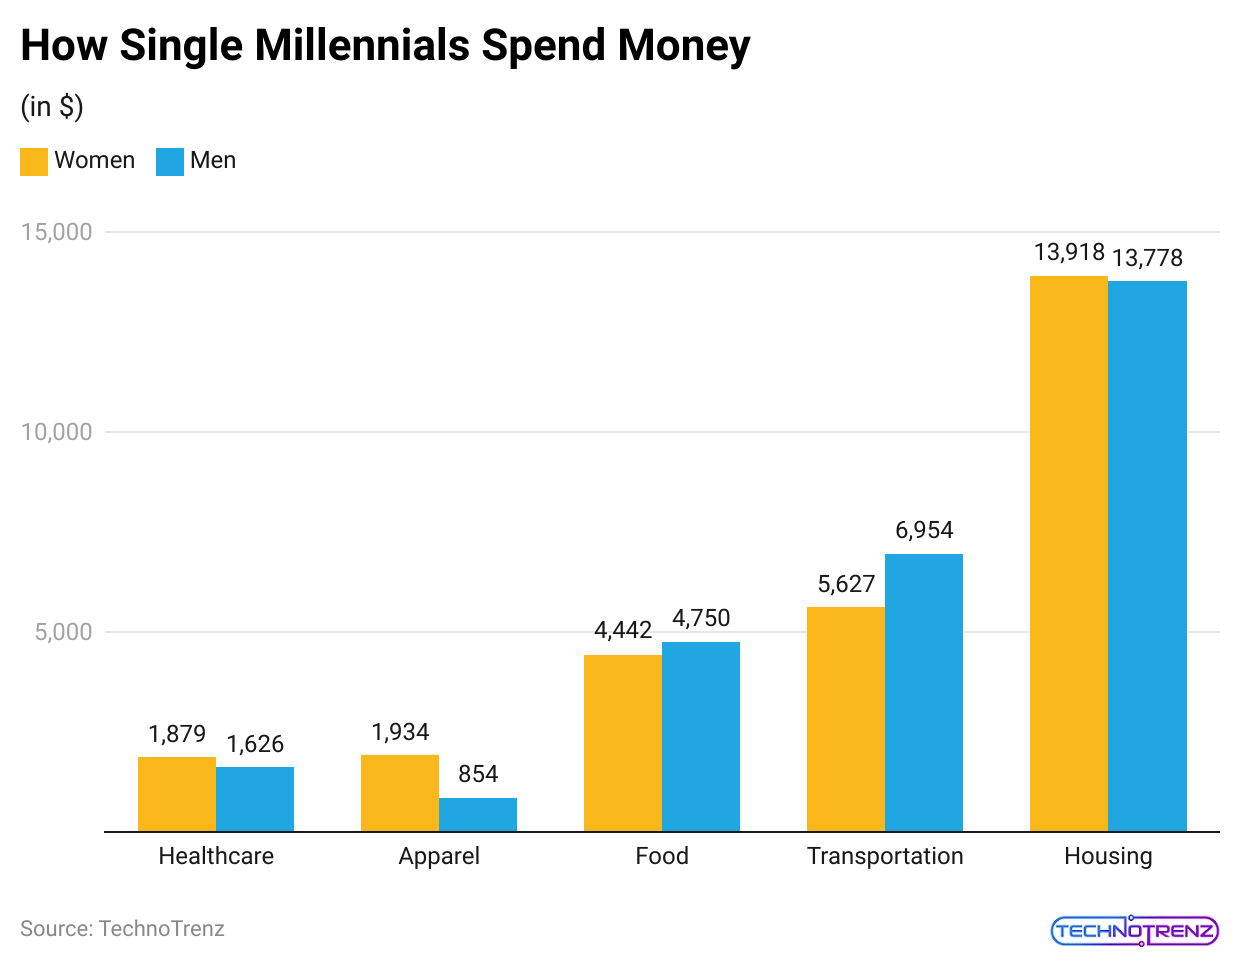
- Following are the spending among single females and males as per the percentage of total income after tax:
|
Item |
Single males | Single females |
| Reading | 0.18% |
0.30% |
|
Personal care |
0.67% | 1.88% |
| Tobacco | 0.83% |
0.51% |
|
Alcoholic Beverages |
1.56% | 0.99% |
| Miscellaneous | 1.68% |
1.99% |
|
Education |
1.55% | 1.78% |
| Apparel and services | 1.90% |
3.05% |
|
Dining out |
5.04% | 4.46% |
| Entertainment | 4.36% |
5.16% |
|
Healthcare |
6.91% | 11.2% |
| Food at home | 7.03% |
8.86% |
|
Transportation |
16.1% | 14.1% |
| Housing (incl. utilities) | 37.1% |
46.5% |
- Male vs Female Spending Statistics stated that women also spend more than men on personal care products and services.
- Women spend an average of $596 per year on hair and dental care products and personal care appliances, while men spend $255.
- This results in a 2.48 times difference, with women spending 1.53% of their total budget compared to 0.62% for men.
|
Category |
Women yearly spend | %of women’s expenditure | Men yearly spend | % of men’s expenditure | Difference in % of expenditure |
| Women’s expenditure higher |
|
||||
|
Apparel and services, women 16 and older |
$671 | 1.73% | $32 | 0.08% | 22.25 |
| Apparel and services, women and girls | $686 | 1.77% | $41 | 0.10% |
17.75 |
|
Personal care products and services |
$596 | 1.53% | $255 | 0.62% | 2.48 |
| Men’s expenditure higher |
|
||||
|
Apparel and services, men 16 and older |
$25 | 0.06% | $398 | 0.97% | 15.01 |
| Apparel and services, men and boys | $46 | 0.12% | $407 | 0.99% |
8.34 |
Men Vs Female High Expenditure Statistics
- In some areas, men spend more than women based on their total expenditures.
- For example, in the “other” entertainment supplies and services category—which includes things like indoor exercise equipment, athletic shoes, and fireworks—men spend an average of $675 each year, or 1.64% of their total spending.
- Male vs Female Spending Statistics stated that women spend much less, about $141, or 0.36% of their total spending. This results in a big difference of 4.51 times. This could be linked to physical activity.
 (Reference: statista.com)
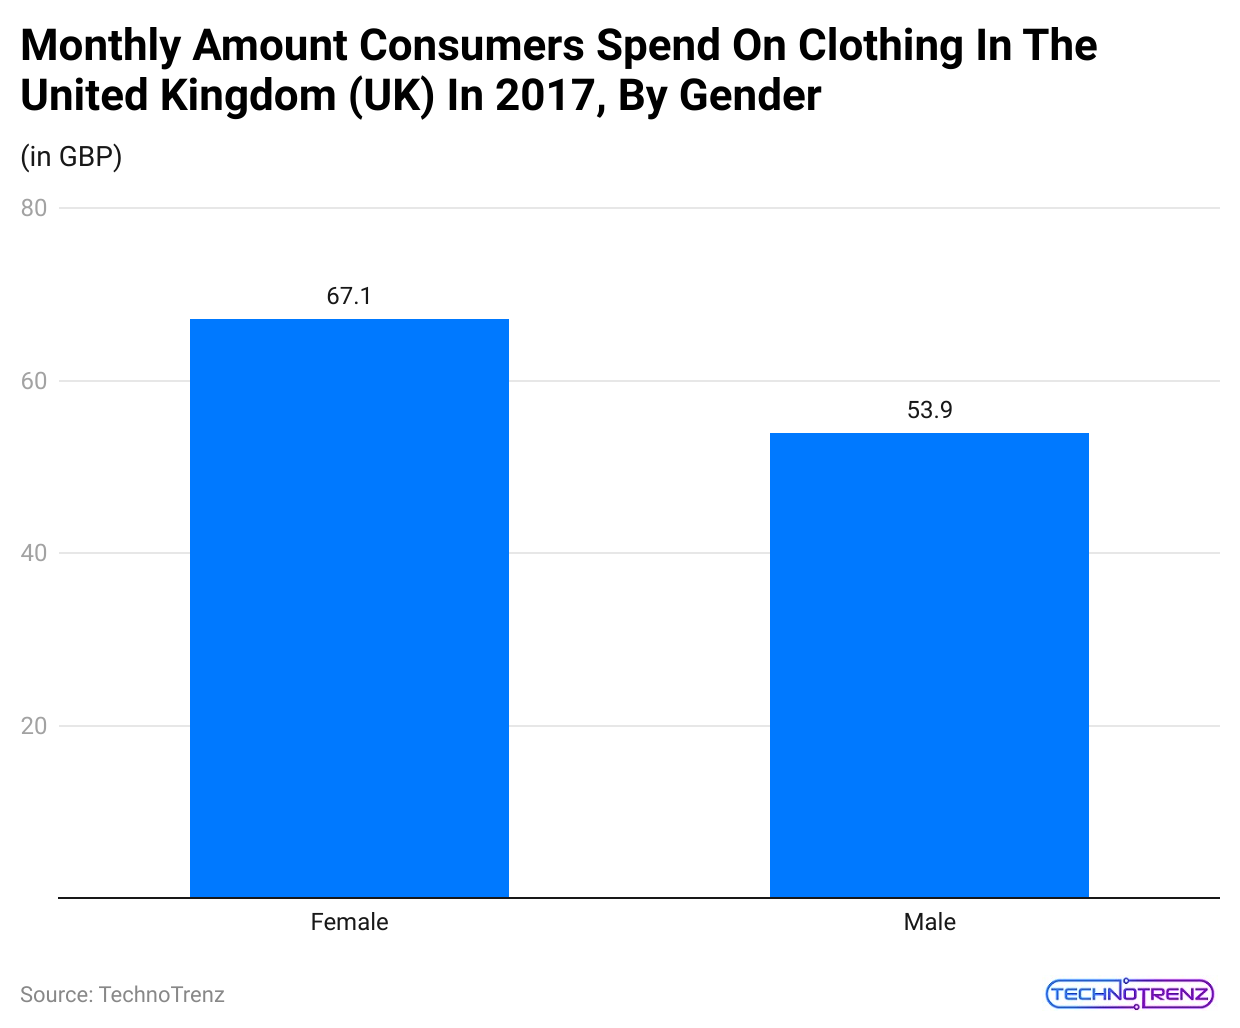
- This statistic shows the monthly average spending on clothes in the United Kingdom, broken down by gender.
- On average, men spent £67.10 a month on clothing, while women spent £53.90 a month.
- The Male vs Female Spending Statistics reports that men are more likely to meet physical activity guidelines than women.
- In 2023, 28.3% of men met both aerobic and muscle-strengthening guidelines, while only 20.4% of women did. This might lead men to spend more on things like exercise equipment and athletic shoes.
- Male vs Female Spending Statistics stated that men also spend more on alcoholic beverages compared to women.
- Men spend an average of $542 a year on alcohol, which is 1.32% of their total spending, while women spend $257, or 0.66% of their total spending. This creates a 1.99 times difference.
- Additionally, men spend more on tobacco products and smoking supplies.
- Men spend $349 a year, or 0.85% of their total spending, while women spend $166, or 0.43% of their total spending. This results in a 1.98 times difference.
|
Category |
Women’s annual spend | % of women’s expenditures | Men’s annual spend | % of men’s expenditures | Difference in % of expenditures |
| Gasoline, other fuels, and motor oil | $813 | 2.09% | $1,227 | 2.98% |
1.42 |
|
New cars and trucks |
$684 | 1.76% | $1,219 | 2.96% | 1.68 |
| Tobacco products and smoking supplies | $166 | 0.43% | $349 | 0.85% |
1.98 |
|
Alcoholic beverages |
$257 | 0.66% | $542 | 1.32% | 1.99 |
| Other entertainment supplies, equipment, and services | $141 | 0.36% | $675 | 1.64% |
4.51 |
- Health habits might explain why men and women spend differently. According to CDC data, men generally drink more alcohol than women.
- Nearly 58% of adult men reported drinking in the last 30 days, compared to 49% of adult women.
- Additionally, about 21% of men said they binge drink, while only 13% of women do.
- Male vs Female Spending Statistics stated that there are also differences in smoking habits. CDC data shows that 14.1% of men and 11.0% of women currently smoke.
- However, women are more likely to try to quit smoking.
 (Reference: lexingtonlaw.com)
- Male vs Female Spending Statistics found that 56.5% of women who smoked in 2020 tried to quit in the past year, while 53.3% of men did the same.
- Men also spend more on their vehicles. They spend more on new cars and trucks, with men averaging $1,219 a year, or 2.96% of their total spending, while women spend $684 a year, or 1.76% of their total spending, on new vehicles. This results in a 1.68 times difference.
- Male vs Female Spending Statistics stated that men also spend more on gasoline, averaging $1,227 a year, or 2.98% of their total spending. This is 1.42 times higher than the $813, or 2.09% of the total spending that women spend on gas.
Male Vs Female Spending Statistics
- Women are responsible for 70% to 80% of all shopping decisions, either directly or indirectly.
- 65% of women prefer shopping in physical stores, while 22% like to use a brand’s app or website.
- Among women who shop online, 36.4% prefer using a brand’s mobile app or website.
- For men, 60% prefer shopping in-store, and 24% prefer shopping online.
- Male vs Female Spending Statistics stated that almost 20.8% of men who shop online prefer using a brand’s mobile app or website.
- Both men and women use buy now, pay later (BNPL) services, with 57% of men and 45% of women using them.
- Single homebuyers are twice as likely to be women compared to men.
- Male vs Female Spending Statistics stated that women make up 70% of travel customers.
- On average, Millennial men spend 59.9% more on clothes and shoes than Millennial women.
Online Shopping Statistics:
- Just browsing online only sometimes leads to buying.
- 44% of women and 53% of men prefer to browse retail items online.
- 75% of women who shop online like to browse on the brand’s website, with 36.4% of them prefer mobile browsing.
- Male vs Female Spending Statistics stated that about 25% of women who shop online prefer using third-party apps or websites.
- 7% of men who shop online prefer to browse the brand’s website, with 28.9% preferring mobile browsing.
- Male vs Female Spending Statistics stated that around 26.4% of men who shop online prefer using third-party apps or websites.
 (Reference: capitaloneshopping.com)
|
Age |
Female | Male |
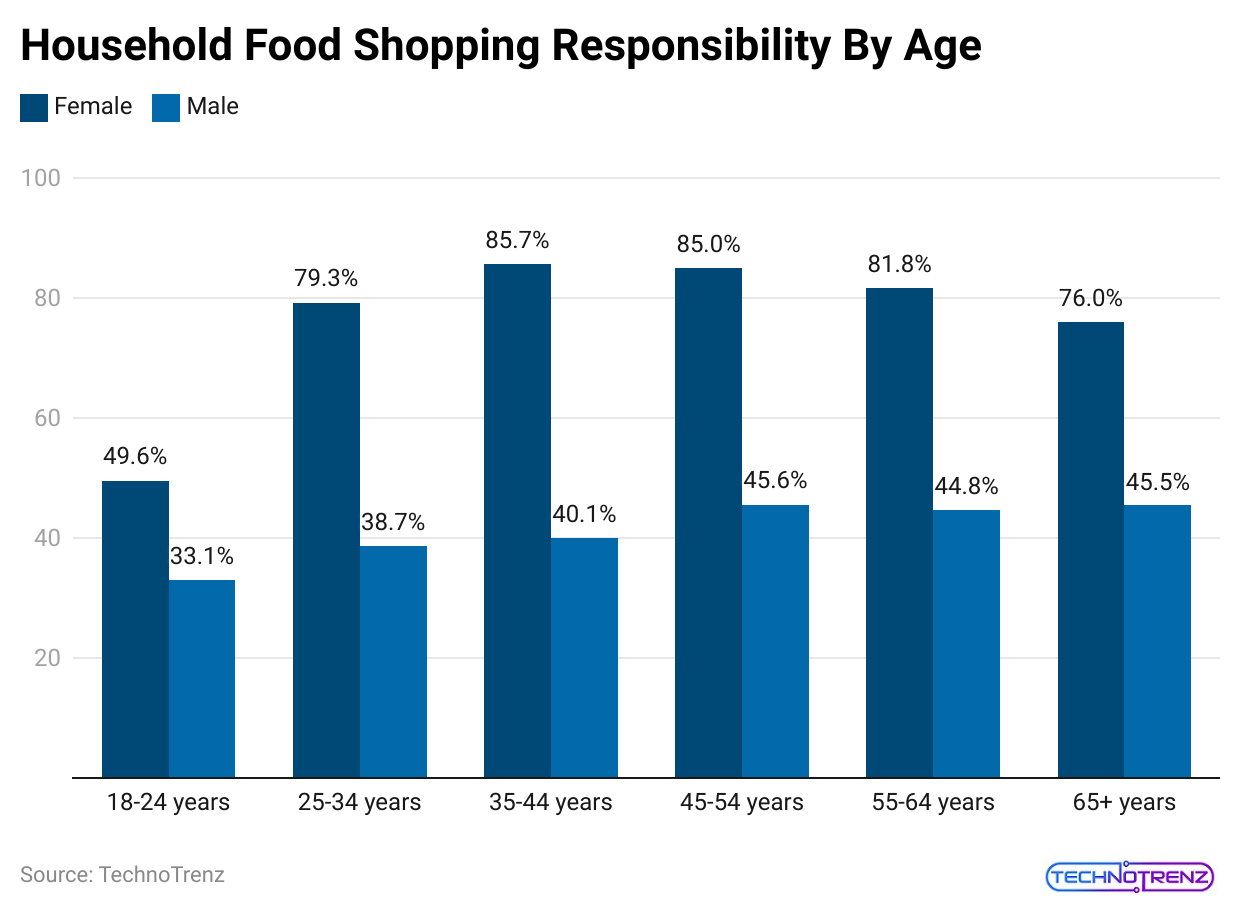
| 18-24 years | 49.6% |
33.1% |
|
25-34 years |
79.3% | 38.7% |
| 35-44 years | 85.7% |
40.1% |
|
45-54 years |
85.0% | 45.6% |
| 55-64 years | 81.8% |
44.8% |
|
65+ years |
76.0% |
45.5% |
Food Shopping Statistics:
- The biggest difference in shopping habits between men and women is in grocery shopping.
- 2% of women say they are the main food shoppers in their households.
- In households with a partner and children, 80% of women do most of the grocery shopping.
- 68% of married or partnered women without children are the primary grocery shoppers in their households.
- 42% of men say they do most of the food shopping for their households.
- In households with a partner and children, 20% of men handle most of the grocery shopping.
- Male vs Female Spending Statistics stated that nearly 23% of married or partnered men without children are the main grocery shoppers.
- In households with a partner and children, 11% of women and 23% of men share grocery shopping equally.
- Among couples without children, 19% of women and 27% of men share grocery shopping equally.
Male Vs Female Product Preferences Sections
- Electronics and Gadgets: Men spend the maximum on gadgets and electronics such as smartphones, laptops, and other tech items. They also make more big purchases, such as cars and electronics.
- Clothing and Personal Care: Females spend maximum on apparel, accessories, and individual care products and are more prone to get deals and discounts while shopping.
- Leisure and Entertainment: Men are prone to spend time dining out, eating fast food, and attending sports events. They also spend more on subscription services like streaming platforms and gaming memberships.
- Outdoor and Recreational Gear: According to Male vs. Female Spending Statistics, men are more prone to spend on outdoor equipment.
- Healthy and Organic Products: Females are prone to invest in organic food products and healthy products, as well as friendly surrounding items. They also tend to buy organic beauty and skincare products.
- Luxury Items and Experiences: Males spend maximum on expensive products like designer clothing and watches and more on expensive goods like fine dining and luxurious vacations.
- Sports and Gaming: Males spend maximum on sports-related items like gym memberships and equipment, as well as gaming consoles and video games.
What Does Each Gender Spend The Most On?
- Women usually make most of the choices in areas like home decorating (94%), vacations (92%), buying homes (91%), cars (60%), and consumer electronics (51%).
- Men spend more on food each year ($4,816) compared to women ($4,446).
- Men also spend much more on alcohol ($542) than women ($257), at a ratio of 2 to 1.
- Most women (89%) are in charge of daily household shopping, while only 41% of men handle this.
- Men spend more on things like sports shoes and workout equipment ($675) compared to women ($141).
- Men also spend more on audio and visual equipment ($835) than on pet care ($206).
- Women spend more on clothes each year ($1,140) than men ($813).
- Men spend slightly more on meat, poultry, fish, and eggs ($625) than women ($592).
- Men also spend slightly more on non-alcoholic beverages ($309) compared to women ($292).
- Women spend much more on personal care products and services, with an average of $714 per year, while men spend $297.
- Women spend more on healthcare services at every stage of life compared to men.
- Male vs Female Spending Statistics stated that women are more likely to shop online (43%) than men (32%).
- Men spend more on personal transportation each year ($5,507) compared to women ($4,273).
- In 2019, more gamers who spent between $101 and $250 annually were men (60.7%).
- When shopping in-store, most people spend around PHP 1500, with only 10% spending between PHP 5000 and PHP 10,000.
Women And Global Spending Statistics
- Women make up more than half of the U.S. population and control or influence 85% of consumer spending.
- Women’s buying power in the U.S. is between $5 trillion and $15 trillion each year.
- Women hold more than 60% of all personal wealth in the U.S.
- Women purchase over 50% of items usually marketed to men, such as cars, home improvement products, and electronics.
- Around 40% of working women in the U.S. earn more than their husbands.
- Male vs Female Spending Statistics stated that around 80% of women are the main grocery shoppers.
- 71% of women do both the shopping and the meal preparation.
- 61% of women are more likely to buy a product if they already use the brand, 57% if they have a coupon, and 56% if they have seen the item in an ad or store flyer.
- 92% of women pass on information about deals or online recommendations to others.
- Women either start or are involved in 61% of electronics purchases.
Women and Travel Spending:
- Women make 70% of all travel choices.
- 73% of travel agents say that more women travel alone compared to men.
- 68% of travel agents say most women who travel in small groups are over 45 years old.
- The average adventure traveler is a 47-year-old woman who wears a size 12 dress, not a 28-year-old man.
- One in four women has gone on a “girlfriend getaway,” and 39% plan to do so at least once in the next three years.
Women and Food Spending:
- Women spend more per shopping trip, averaging $44.43 compared to $34.81 for men.
- Male vs Female Spending Statistics stated that almost 60% of moms think organic foods are better for their health.
- 84% of women are the primary meal makers in their households. Of these, 61% prepare meals at least five times a week.
- Most of these meals are made with fresh ingredients, as 64% of women say they use fresh items instead of prepackaged foods.
- Millennials are the most likely to interact with retailers through social media or other digital tools.
- Facebook, Pinterest, and web searches are common ways consumers engage with food culture online. About half of all shoppers use social media to connect with food trends, especially younger generations
- 59% of women feel that food marketers don’t understand them well, as stated in Male vs Female Spending Statistics.
- Women make 90% of the healthcare decisions for their households.
- Women account for 93% of over-the-counter (OTC) pharmaceutical purchases.
- The Internet is the main source of health information, more so than family doctors, and women are more likely than men to seek health info online.
- Over 75% of people aged 65 and older use the Internet for health information.
- 9 out of 10 women who go online look for health information.
- 66% of women feel that the healthcare market does not understand them well.
Women and Technology
- Women’s most popular purchases are smartphones, tablets, laptops, HDTVs, digital cameras, and headphones.
- Women over 55 spend more time online gaming than men aged 15 to 24.
- 4% of women think social media is a great way to stay updated with the latest content.
- Other reasons women use social media include sharing content with family and friends (40.9%), sharing personal opinions or comments (26.7%), and seeing what other fans or followers are saying (25.4%).
- Male vs Female Spending Statistics stated that almost 50% of women follow brands on social media to keep up with the latest products.
Social Media Users:
- 56% of women in the U.S. use social networking sites:
- 58% of Facebook users are women.
- 64% of Twitter users are women.
- 82% of Pinterest users are women.
Women and Sports:
Women’s makeup:
- 47.2% of Major League Soccer fans
- 46.5% of MLB fans
- 43.2% of NFL fans
- 40.8% of NHL fans
- 37% of NBA fans
- Women also make 46% of official NFL merchandise purchases.
- More women (50.4 million) watched the Super Bowl than the Oscars (24.5 million), the Grammys (23.8 million), and the Emmys (8 million) combined.
- 44% of women say they like the Super Bowl ads more than any other part of the game.
- Of the NFL’s 185 million fans, 45% are women.
- Male vs Female Spending Statistics stated that the sales of women’s NFL clothing have tripled in the last four years.
Women and Automobiles:
- Male vs Female Spending Statistics stated that women decide on 65% of new car purchases.
- Women spend over $200 billion each year on new cars and vehicle maintenance.
- Women buy 45% of all light trucks and SUVs.
- Women own 12.3% of all motorcycles in the U.S., a 28% increase over the past five years.
- 77% of women bring a man along to a car dealership to avoid being taken advantage of.
- Women are responsible for up to 52% of all new vehicle purchases, including trucks, and they influence 80% of these purchases.
- 74% of women feel that automotive marketers don’t understand them.
Women and Electronics:
- In 61% of consumer electronics purchases, a woman either started the purchase or was involved in the process.
- S. women spend an average of $822 per year on electronics and contribute to more than half of their household’s total spending on consumer gadgets.
- Male vs Female Spending Statistics stated that almost 45% of all video game players are women.
- Women aged 55 and older spend more time playing video games than men aged 15 to 24.
Men vs. Women Spending Habits
- Men and women often think differently about shopping, which affects their spending habits. While everyone is unique, some common patterns can help us understand how they manage their finances and make choices.
- Women are usually more careful with their purchases and take time to find products that match their needs. They focus on the quality of items and enjoy the shopping experience itself.
- On the other hand, men tend to shop more quickly and directly, aiming to get in and out of the store as fast as possible.
- Women generally want a shopping experience that is both risk-free and convenient. They look for purchases that will improve their lives and often spend more time ensuring that their choices meet all their requirements before they spend any money.
- 43% of women and 52% of men prefer buying technology products online.
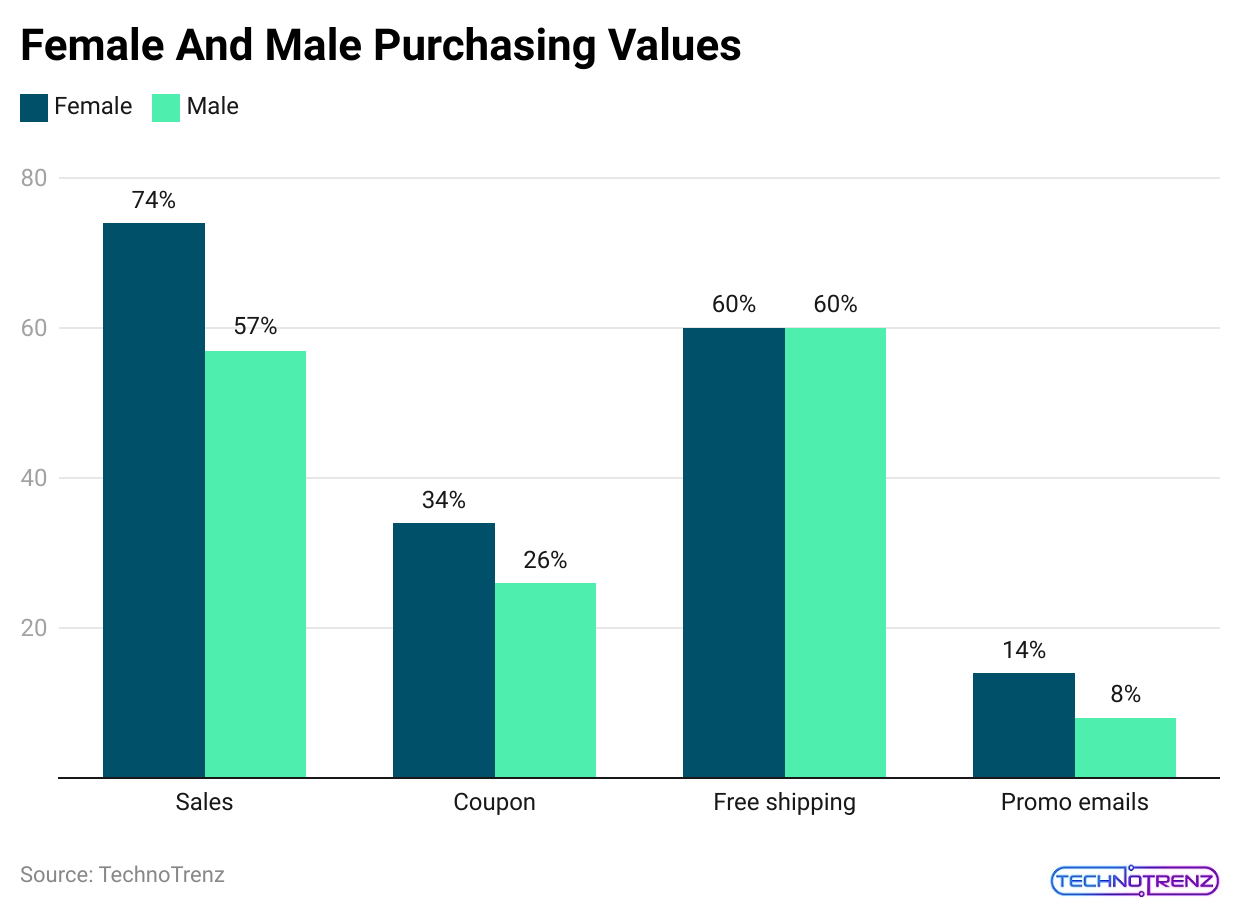
- 74% of women care about finding items on sale when shopping, while only 57% of men feel the same way.
- 34% of women like using coupons and promotions for their purchases, compared to 26% of men.
- As stated in Male vs. Female Spending Statistics, 14% of women are likely to read promotional emails carefully, while only 8% of men do.
 (Source: researchgate.net)
- 58% of women check products and prices on Amazon.com before shopping elsewhere, compared to 64% of men.
- 42% of women are more likely to buy online if free shipping is offered, compared to 35% of men.
- 91% of women buy food and groceries in-store, while 86% of men do the same.
- Male vs Female Spending Statistics stated that women are 48% more likely to use reusable shopping bags than men.
- 30% of women are encouraged to shop online if they get text or email updates about product availability, compared to 27% of men.
- 42% of women are more likely to buy online if there is a money-back guarantee, versus 31% of men.
- 67% of women check food labels to see if a product is healthy, while only 48% of men do the same.
- Women are 13% more likely than men to view a product as premium based on its high-quality ingredients.
- Slightly more women than men prefer shopping online, with 72% of women and 68% of men favoring it.
Difference In Employment And Income That May Inform Spending Habits
- In the U.S., men generally work more and earn higher incomes compared to women, which affects how each group spends money.
- About 66% of men say they have jobs, either full-time or part-time, while just under 49% of women reported having paid jobs in 2021.
- Around 7% of women identified as homemakers, but no men said they were homemakers.
(Reference: junglescout.com)
- Unemployment and COVID-19 Effects**: 6% of men said they were unemployed, while 10% of women reported the same. More women than men were jobless or on leave due to COVID-19, with 5% of women and 3% of men affected.
- Living Wage: In the top five most populous U.S. states (California, Texas, Florida, New York, and Pennsylvania), American men are more likely to earn enough to cover basic living expenses like food, housing, and clothing. Men earn over $33,072 per year—necessary to meet the minimum living standard—26% more often than women.
- Family Living Wage: For a family of four with two working parents, the average annual living wage is $46,159. Here, 68% of men earn $50,000 or more per year, compared to just 51% of women, creating a 33% gap.
- High Incomes: As incomes rise, men earn more than women at higher rates. While women earn more than men in the $50,000 to $99,000 range, men are over twice as likely as women to earn between $125,000 and $149,000. For incomes of $150,000 or more, men outnumber women by 172%.
|
Annual Household Income |
Men | Women | Percent difference |
| $150,000 or more | 17% | 6% |
172% |
|
$125,000 to $149,999 |
12% | 5% | 119% |
| $100,000 to $124,999 | 16% | 9% |
78% |
|
$75,000 to $99,999 |
10% | 12% | -20% |
| $50,000 to $74,999 | 13% | 18% |
-28% |
|
$35,000 to $49,999 |
10% | 11% | -7% |
| $25,000 to $34,999 | 10% | 14% |
-28% |
|
Less than $25,000 |
12% | 24% |
-50% |
- Men’s and women’s incomes have fluctuated differently during the pandemic. Since the end of 2020, men are much more likely to report an increase in their income, while women are more likely to say they have lost income.
(Reference: junglescout.com)
- Men’s higher earnings, whether they’ve been steady or recently increased, might explain why they spend more than women, especially on nonessential items like clothes, alcohol, toys, and games.
Conclusion
In summary, men and women have different spending habits based on their income and what they prioritize. Men usually earn more and spend more on things like alcohol, clothing, and gadgets. On the other hand, women often focus on finding good deals and managing household needs. They are more likely to look for sales, use coupons, and read reviews before buying.
Women also spend more on healthcare and are more active in online shopping. These differences show how income and personal priorities influence how men and women spend their money. We have shed enough light on the Male vs Female Spending Statistics through this article.
Sources
FAQ.
According to Capital One Shopping Research, women spend nearly $35 trillion on consumer goods worldwide, which is 50% of all global consumer spending.
Women contribute 37% to the global GDP, make or influence over 80% of purchases, and are responsible for 91% of new home purchases.
They discovered that single men spend more than single women. On average, men spend $41,203 a year, while women spend $38,838. However, according to the Census Current Population Survey, women earn about 17% less than men on average.

Saisuman is a professional content writer specializing in health, law, and space-related articles. Her experience includes designing featured articles for websites and newsletters, as well as conducting detailed research for medical professionals and researchers. Passionate about languages since childhood, Saisuman can read, write, and speak in five different languages. Her love for languages and reading inspired her to pursue a career in writing. Saisuman holds a Master's in Business Administration with a focus on Human Resources and has worked in a Human Resources firm for a year. She was previously associated with a French international company. In addition to writing, Saisuman enjoys traveling and singing classical songs in her leisure time.