Small Business Statistics By Job Creation, Industry, Challenges, Demographics, Marketing And Artificial Intelligence
Updated · Sep 24, 2024

WHAT WE HAVE ON THIS PAGE
- Introduction
- Editor’s Choice
- What is A Small Business?
- General Small Business Statistics
- Small Business Job Creation Statistics
- Small Business Statistics By Industry
- Small Business Challenges Statistics
- Number Of Small Business Statistics
- Small Business Demographics Statistics
- Use Of Technology By Small Businesses Statistics
- Small Business Marketing Strategies
- Women In Business Statistics
- Artificial Intelligence In Small Business Statistics
- Small Business Owners Statistics
- Conclusion
Introduction
Small Business Statistics: Small businesses are often seen as the backbone of the economy, and rightly so. They bring fresh ideas to the market and create jobs for people who may not have opportunities in larger companies. From one-person businesses to significant job creators, small businesses are crucial to the economy.
However, with 82% failing because of cash flow problems and only 50% making it to the five-year mark, it’s clear that achieving success is not easy. Here are some Small Business Statistics that can help entrepreneurs understand the market better and position their products or services for success.
Editor’s Choice
- There are 33.27 million small businesses in the US with fewer than 500 employees.
- About 81.6% of these businesses are run by a single owner, totaling 27.15 million owner-only businesses.
- Small Business Statistics stated that only 16.44% have between 1 and 19 employees.
- Overall, small businesses employ 61.6 million people, which is 45.9% of the US workforce.
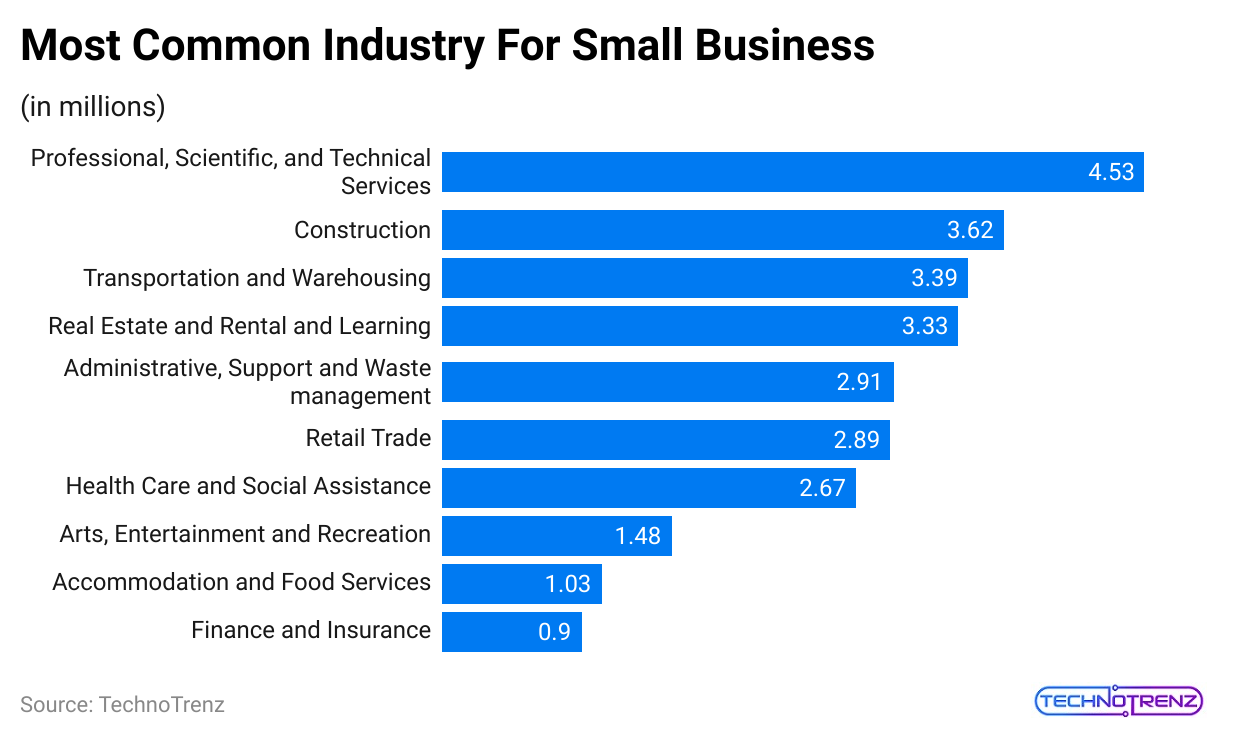
- There are 4.53 million small businesses in the professional, scientific, and technical fields, making up 13.62% of all small firms. This is the only sector with over 4 million small businesses.
- In 2021, small businesses generated $16.2 trillion in revenue.
- Women-owned small businesses bring in $388.1 billion in revenue. They provide jobs for 10.1 million workers.
- These businesses exported goods worth $546.1 billion, accounting for 34.9% of total US exports that year.
- From 1995 to 2021, small businesses created 17.3 million new jobs, which is 62.7% of all new jobs during this period.
- Most American entrepreneurs are White or Caucasian (84.7%), while only 4% are Black or African-American, Hispanic, Latino, or of Spanish origin, and another 4% are Asian or Asian-American.
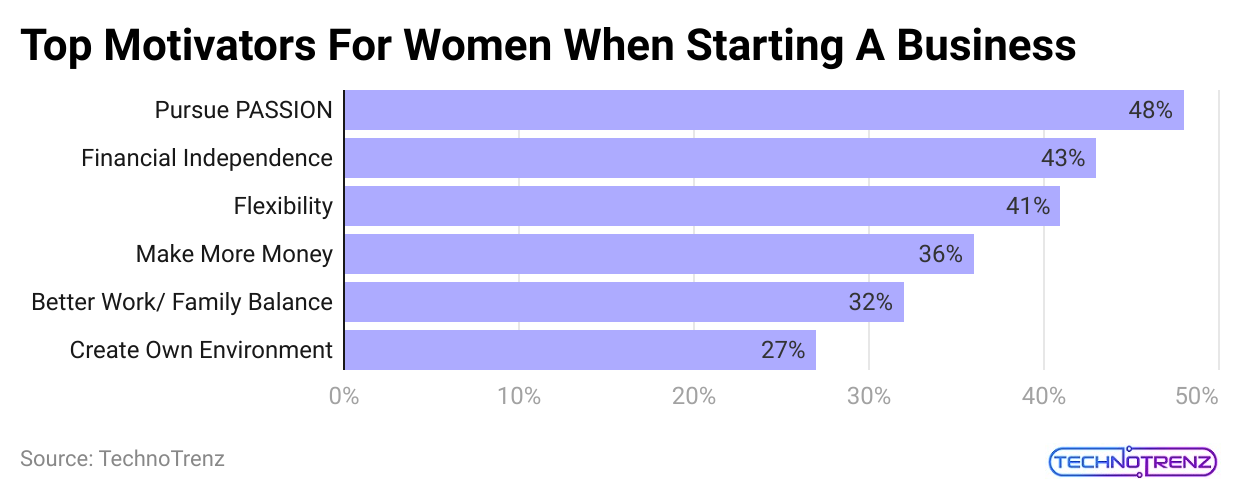
- The main reasons small business owners start their companies include wanting to be their boss (28%), dissatisfaction with corporate jobs (23%), and the desire to follow their passion (14%).
- Small businesses are responsible for 43.5% of the US gross domestic product.
- In a 2024 survey, small business owners listed their biggest concerns as inflation and economic conditions (47%), the need to raise prices (32%), and increased competition (24%).
- Additionally, 57% of small business owners expect to create new jobs in 2024.
- Lastly, 65% of small businesses reported that they are in good overall health.
- 56% of these businesses use AI for marketing and promotions, while 42% use it to talk with customers and potential clients.
- Around 67% of people in the US think that self-driving cars are safer than traditional cars, and 26 nations are presently developing autonomous vehicles.
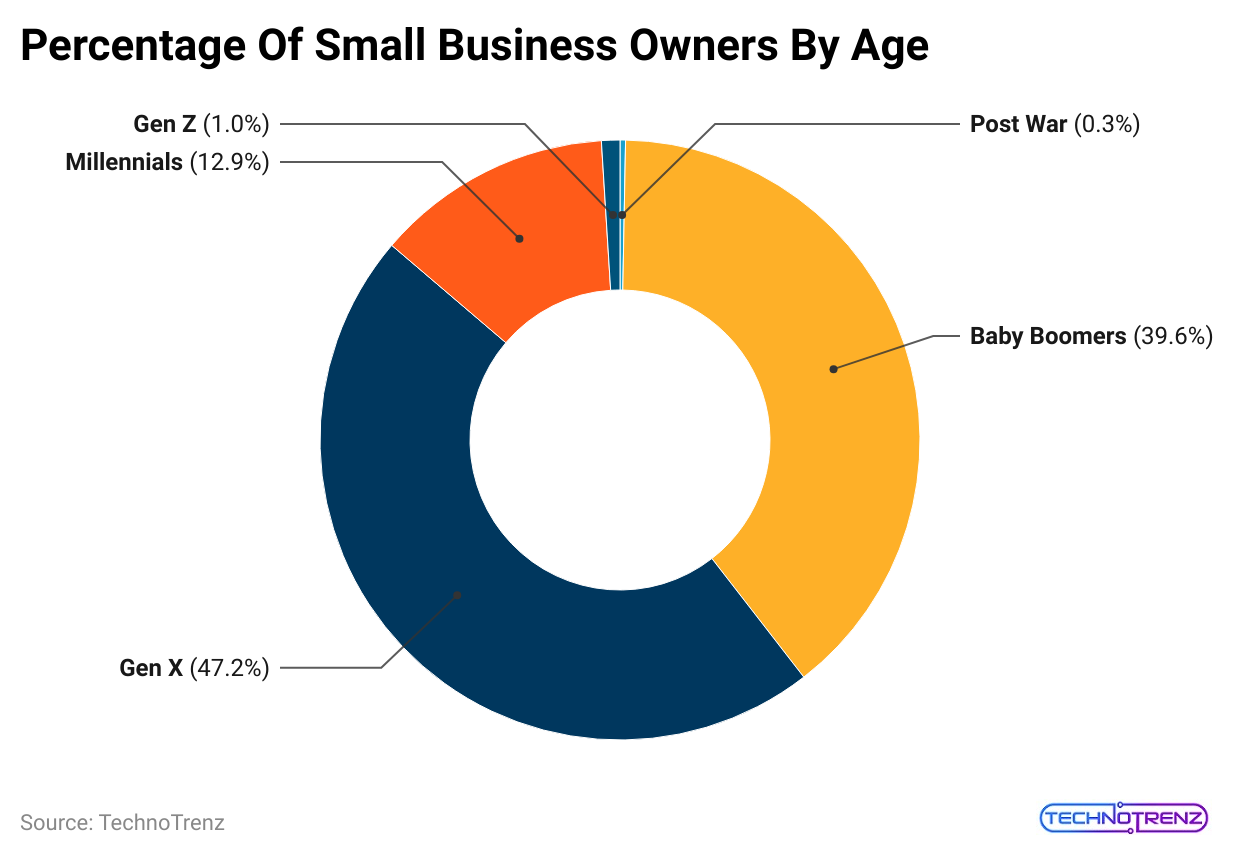
- Most small companies are owned by Gen Xers (47.2%), followed by Baby Boomers (39.6%), Millennials (12.9%), and older generations (0.3%).
What is A Small Business?
A small business is a personally owned organization, sole or proprietorship, with fewer workers and less annual revenue than larger businesses. The definition of “small” can vary by country and industry, especially when it comes to qualifying for government aid and tax benefits. In the US, the Small Business Administration has specific standards for what counts as a small business based on different industries.
| Industry | Not to exceed |
|
Agriculture |
$0.75 million average annual revenue |
| Special trade contractors |
$12 million average annual revenue |
|
General and heavy construction |
$28.5 million average annual revenue |
| Retail and service |
$6 million average annual revenue |
|
Wholesale trade |
100 employees |
| Manufacturing and mining |
500 employees |
While small businesses can use the same quality management systems as larger companies, they face different challenges. For example, they usually have fewer employees and less money to invest upfront in quality programs. On the positive side, smaller businesses often have stronger commitment and easier access to upper management, and communication tends to be more straightforward.
The values recognized by small business employees often influence their behavior and can play a key role in long-term success. Upper management can significantly shape the company culture by clearly sharing values and guiding principles. These ideas are known as organizational values and are expressed through concepts like values, mission, vision, policies, and objectives. Usually, leadership creates these concepts, and employees adopt them.
General Small Business Statistics
- Small businesses account for 99.9% of all companies in the US, totaling about 33.3 million. From 1995 to 2021, they created nearly two-thirds of the new jobs in the country.
- These businesses make up 99.7% of firms with employees and 97.3% of exporters. They contribute 43.5% to the US gross domestic product (GDP).
- There are over 400 million small and medium-sized businesses around the world.
- About 36,000 small businesses in the US earn between $1 million and $2.5 million each year.
- Self-employed owners earn an average of $51,816 annually, while unincorporated businesses average $26,084.
 (Reference: truelist.co)
- A small business with one employee usually makes around $44,000 per year.
- Texas has the most small businesses, with 10% of the total in the US, followed by California, Florida, and Georgia, each with 9%, and Georgia with 6%.
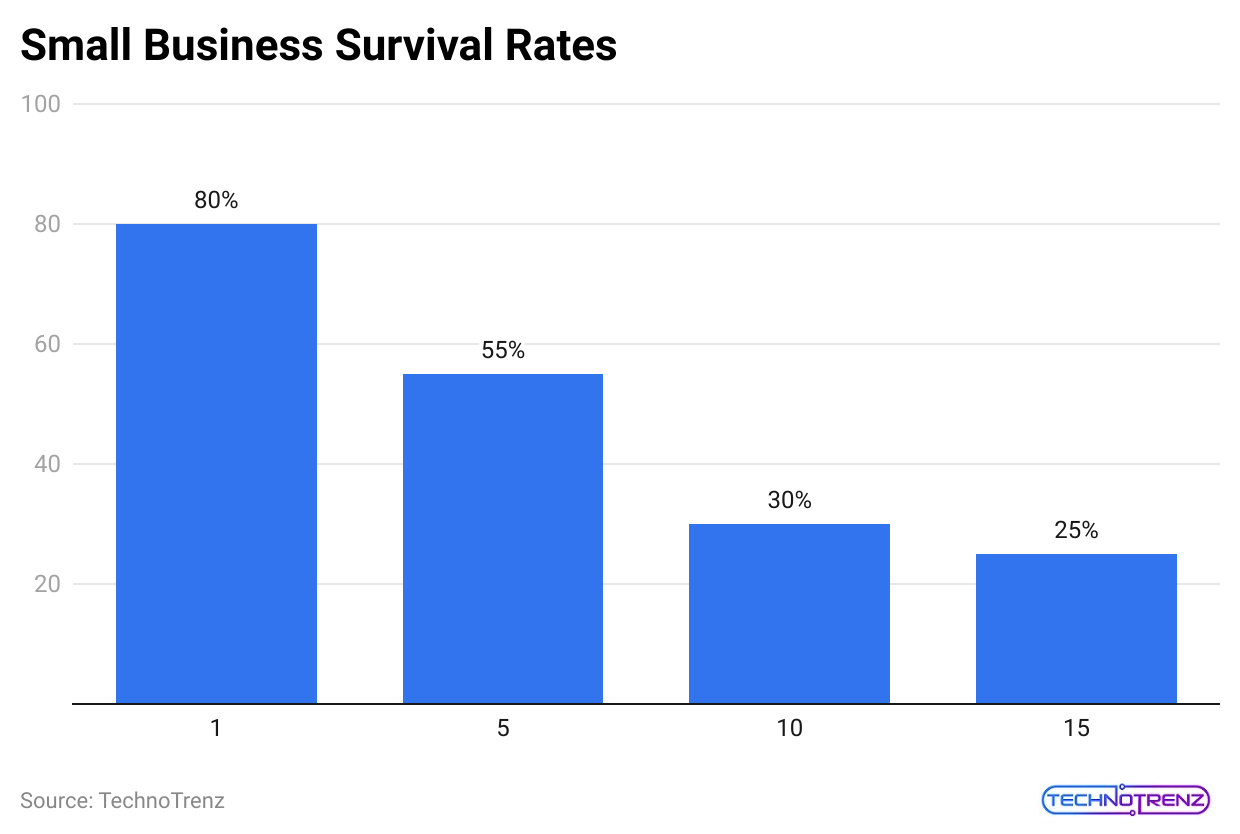
- Around 18% of small businesses fail within their first year, half close after five years, and about 65% shut down within ten years.
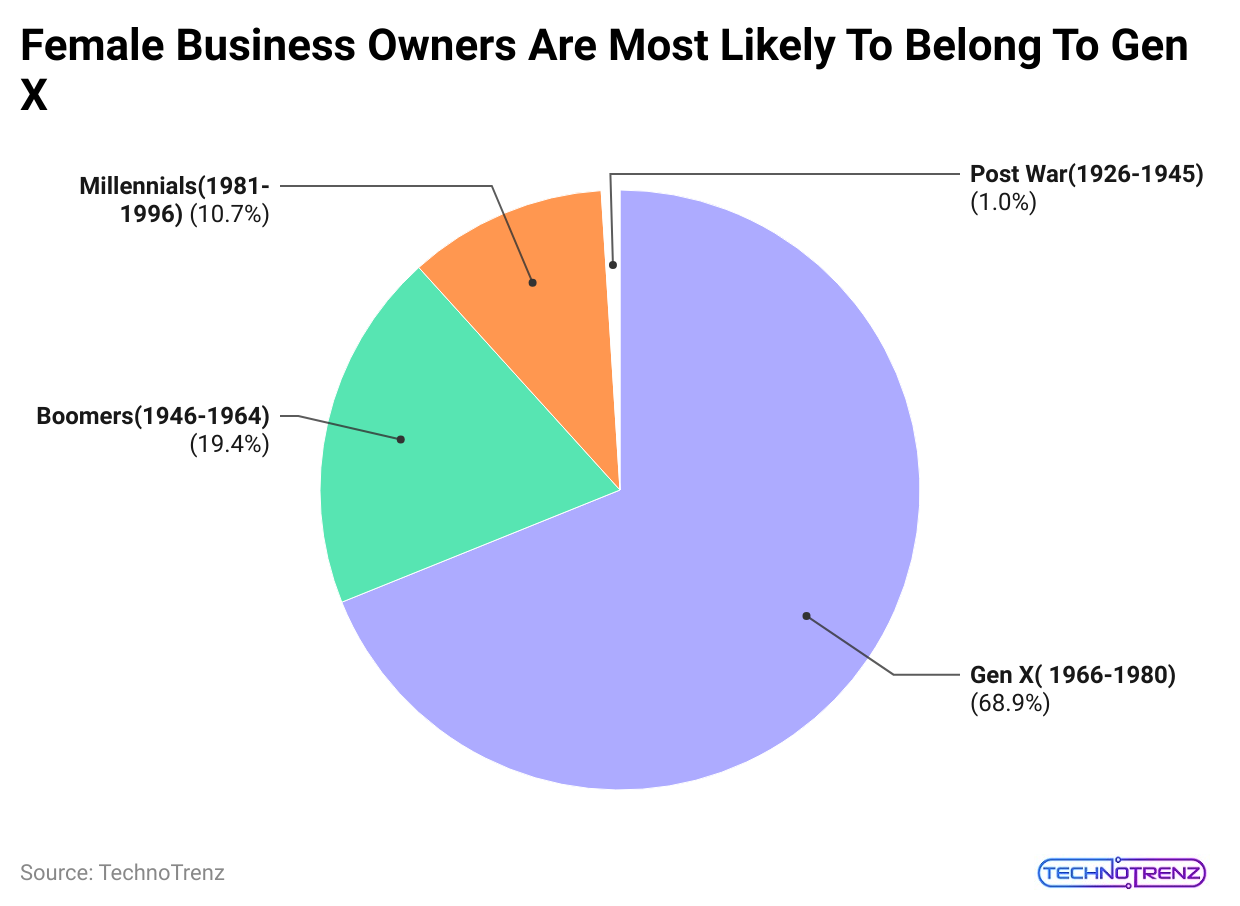
- Women own about 26% of small businesses in the US. Nearly half are owned by Generation X, and Black, Hispanic, or Asian individuals own 14%.
- Almost 80% of small business owners used their savings to start their businesses, while 16% got bank loans. Loans from family and friends made up 2% to 6% of funding.
- As of August 2023, nearly half of all online micro-businesses in the US have turned their extra income into their main source of income.
- Approximately 81.6% of small businesses in the US, or about 27.15 million businesses, do not have employees.
- Only 16.44% of small businesses in the US have between 1 and 19 employees.
- Small businesses provide jobs for 61.6 million people, representing 45.9% of the total US workforce.
- The professional, scientific, and technical services industry includes 4.53 million small businesses, making up 13.62% of all small businesses. This is the only industry with over 4 million small businesses.
- In 2023, small businesses in the US earned $16.2 trillion in revenue.
Small Business Job Creation Statistics
- Small businesses have added over 12.9 million jobs in the last 25 years. Even though just one person runs many small businesses, they have been a major source of new jobs in the US.
- These businesses have created about two-thirds of all new jobs during this time. This shows how important small businesses are for employment, and their role in job creation will continue to be vital for economic growth.
- The leisure and hospitality industry has seen the highest average job growth over the past year.
- After the pandemic, this sector has added an average of 52,000 jobs each month, recovering from the severe job losses it faced.
- Overall, the job market has gained 5.8 million jobs since last year, surpassing pre-pandemic levels.
- The professional and business services industry now has the most job openings. This shows a strong demand for skilled workers in areas like management and consulting.
- Job seekers in this field may find good opportunities, but businesses will need to work hard to attract and keep qualified employees.
 (Reference: hostinger.in)
- The home health and personal care sector is expected to see the most job growth, with an estimated 22% increase over the next decade, adding over 804,000 jobs.
- This demand is driven by an aging population that needs more in-home healthcare services.
- The leisure and hospitality industry is still bouncing back from COVID-19, having lost 633,000 jobs since February 2020.
- In 2023, the sector has been adding about 41,000 jobs per month, indicating progress, but it remains 223,000 jobs short of its pre-pandemic level.
- Nevada has the highest unemployment rate in the US at 5.4%, followed by Washington, DC, at 5%. In contrast, Maryland has the lowest unemployment rate at just 1.7%, likely due to its diverse economy and proximity to federal jobs.
- New Jersey has seen the biggest increase in unemployment over the past year, rising by 1.3%. Meanwhile, Maryland had the largest decrease, down by 1.5%, reflecting its stable job market.
 (Reference: zippia.com)
- The US job market is expected to grow by 87,000 jobs in 2024. This is a small increase compared to the 9.6 million jobs lost during the pandemic. While the job market is recovering, the pace is slow.
- By 2032, the US is projected to gain 4.7 million jobs, bringing total employment to about 169.1 million. However, the growth rate is slow at just 0.03% per year, indicating a long recovery from the pandemic’s impact.
- The healthcare and social assistance industries are growing the fastest. This is due to an aging population and increased focus on mental health.
- The table below shows the count of job openings across various industries:
| Industry | Number Of Job Openings |
| Agriculture and Related |
2,291 |
|
Mining, Quarrying, and Oil and Gas Extraction |
603 |
| Public Administration |
7,410 |
|
Other Services |
7,186 |
| Information |
2,721 |
|
Construction |
11,271 |
| Financial Activities |
10,725 |
|
Transportation and Utilities |
9,377 |
| Wholesale and Retail Trade |
18,989 |
|
Manufacturing |
14,718 |
| Leisure and Hospitality |
12,635 |
|
Education and Health Services |
34,725 |
| Professional and Business Services |
19,295 |
- Only 14% of jobs lost during the COVID-19 pandemic are expected to be recovered in 2023, and 87% are projected to be recovered by 2030.
- In 2023, there will be 159.6 million employed Americans.
- Below is a table showing the number of employed Americans from 2016 to 2023.
| Year | Number Of Employed Americans |
| 2023 |
159.6 million |
|
2022 |
158.3 million |
| 2021 |
152.6 million |
|
2020 |
147.8 million |
| 2019 |
157.5 million |
|
2018 |
155.8 million |
| 2017 |
153.3 million |
|
2016 |
151.4 million |
- Advances in medical technology and healthcare delivery, including telehealth, are also contributing to this growth.
- The individual and family services industry is expected to add over 1 million jobs between 2019 and 2029, driven by greater awareness of mental health and social needs.
- The computer systems and design industry is also projected to grow, adding over 574,000 jobs as technology becomes increasingly important in various sectors.
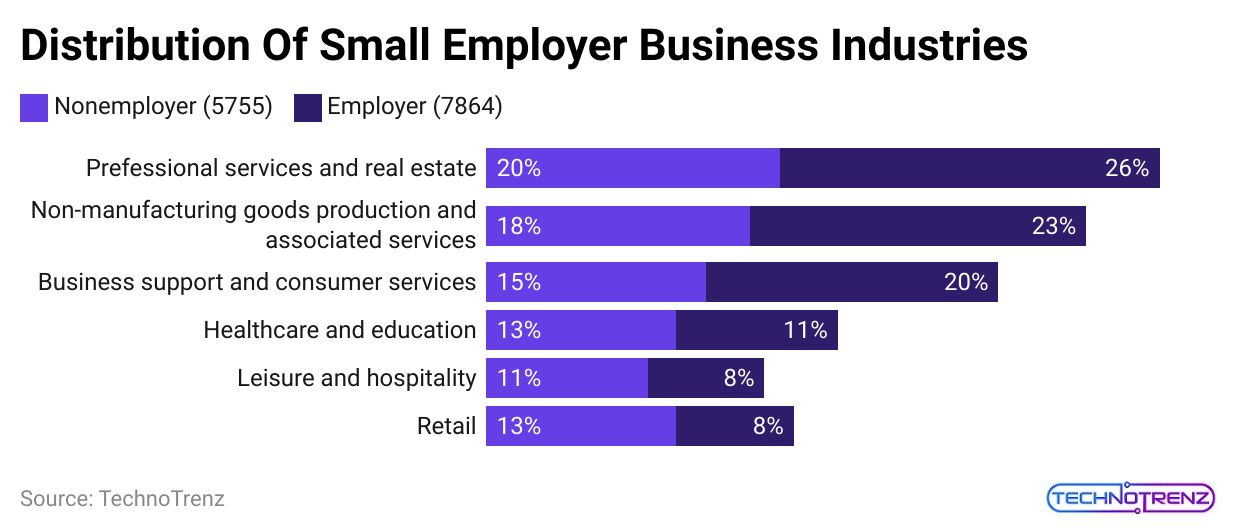
Small Business Statistics By Industry
 (Reference: oberlo.com)
|
Professional, Scientific, and Technical Services |
4.53 million |
| Construction |
3.62 million |
|
Transportation and Warehousing |
3.39 million |
| Real Estate and Rental and Learning |
3.33 million |
|
Administrative, Support, and Waste management |
2.91 million |
| Retail Trade |
2.89 million |
|
Health Care and Social Assistance |
2.67 million |
| Arts, Entertainment and Recreation |
1.48 million |
|
Accommodation and Food Services |
1.03 million |
| Finance and Insurance |
997,471 |
Food & Restaurant Sector
- Only 13% of small businesses in the United States are in the restaurant and beverages sector, making it one of the largest industries.
- Consumer spending in this sector has been increasing by an average of 2.6% each year since 2022.
- The accommodation and food service industry will be worth $14.8 billion by 2025.
- However, the COVID-19 pandemic caused sales to drop by 19.2% from 2019 to 2023. The good news is that the industry has bounced back as people have returned to dining out.
Retail Sector
- The retail sector also experienced slower growth during the COVID-19 pandemic, with sales down by 6% compared to 2023.
- Currently, 11% of all small businesses operate in retail.
- The retail sector’s value is estimated at $4.56 billion and is projected to grow to $5.52 billion by 2026, which is a 21% increase.
Business Services Sector
- The business services industry faced the biggest impact from the COVID-19 pandemic, seeing a 16% drop in sales in 2023.
- In 2022, the growth rate was only 0.15%, which means a loss when adjusted for inflation.
- This sector makes up 13% of the US GDP, showing its importance.
Health, Beauty & Fitness Services Sector
- The health, beauty, and fitness sector is one of the most resilient, with 9% of US small businesses in this field.
- Although COVID-19 affected the industry, it didn’t suffer as much as expected.
- Health services are forecasted to reach $4.32 trillion by 2026, while beauty services are expected to be worth $14.8 billion.
- Health services are projected to grow by 16.6% as they recover from the pandemic.
Residential & Commercial Services Sector
- This sector makes up 7% of small businesses in the US.
- In 2022, there were 67,226 commercial and residential service franchises registered.
- Despite the disruptions from COVID-19, this industry managed to grow, with registered franchises increasing to 68,008 in 2023.
- This sector’s average growth rate was +1.09% from 2015 to 2019 and increased to 1.14% from 2020 to 2023.
Small Business Challenges Statistics
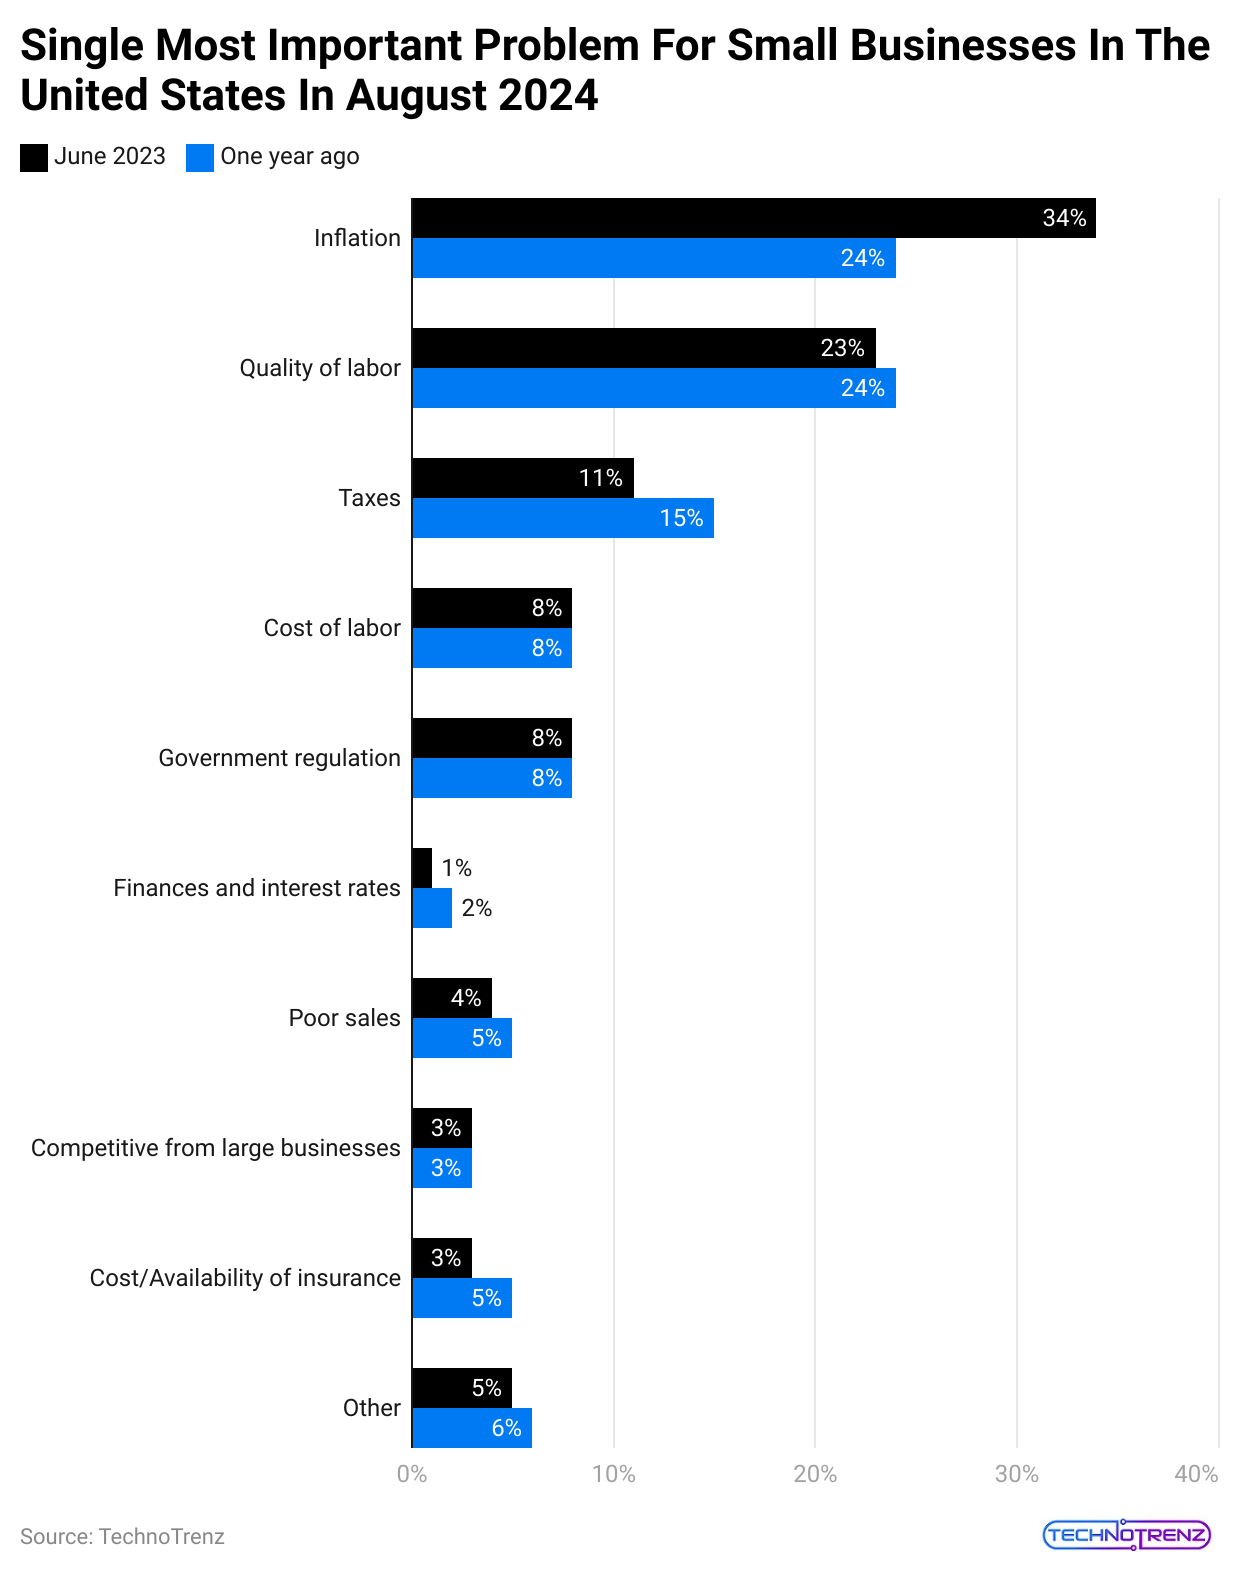
- Inflation and the quality of the workers are important issues for small businesses in the US.
- Female-led SMBs stated a high ratio of business closures, at 23%, compared to 17% of male-led SMBs.
- Despite the higher closure rates, female-led SMBs showed better sales performance than male-led SMBs.
- Almost 33% of the female-led SMBs stated a downfall in sales in the last 30 days, as related to 39% of the male-led SMBs.
- In the United States, almost 20% of SMBs stated that they were closing their businesses in October 2023.
- Nearly 31% of the United States Black-led SMBs stated being closed as per Small Business Statistics.
- The United States minority-led SMBs were around 8% more prone to state closure than other SMBs.
 (Reference: hostinger.in)
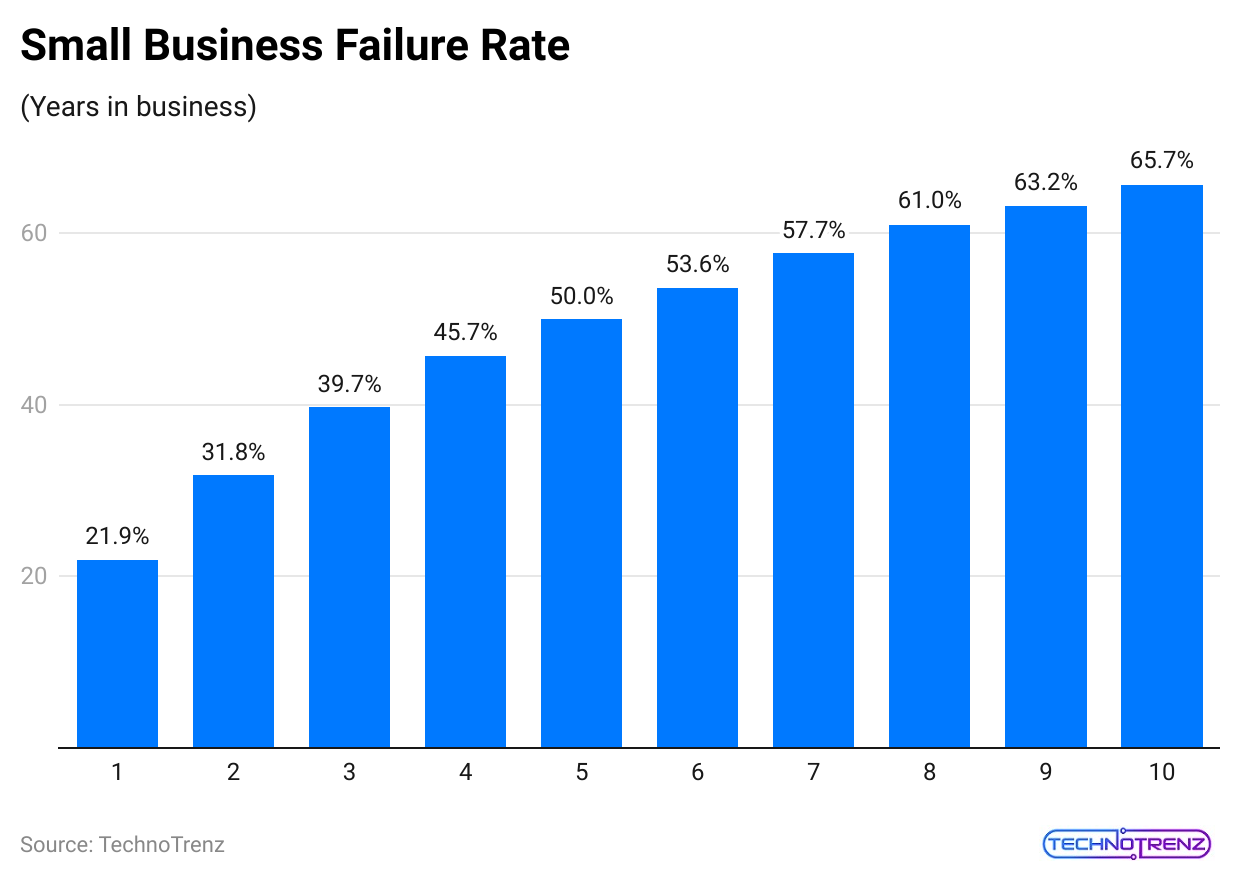
| Year in Business | % |
|
1 |
21.9% |
| 2 |
31.8% |
|
3 |
39.7% |
| 4 |
45.7% |
|
5 |
50% |
| 6 |
53.6% |
|
7 |
57.7% |
| 8 |
61% |
|
9 |
63.2% |
| 10 |
65.7% |
- Almost 9 out of 10 people (89%) state that they are concerned about the United States economy, and more than 4 out of 5 states that they are concerned about small businesses in the United States and the global economy.
- Almost 4 in 5 respondents (78%) state that their business has witnessed increased costs in 2023, which has increased other personal and financial challenges. With the growth in costs, almost 50% reported a downfall in sales, and more than 27% withdrew from cash research.
- More than 50% of the people state that their business has witnessed operational problems that source material due to supply chain disruptions in the previous years.
- Interest in resources for small businesses is actually high among people in construction, the beverage, and food markets and lowest among those in recreation and entertainment.
 (Reference: blog.hubspot.com)
| June 2023 | One year ago | |
|
Inflation |
34% | 24% |
| Quality of labor | 23% |
24% |
|
Taxes |
11% | 15% |
| Cost of labor | 8% |
8% |
|
Government regulation |
8% | 8% |
| Finances and interest rates | 1% |
2% |
|
Poor sales |
4% | 5% |
| Competitive from large businesses | 3% |
3% |
|
Cost/Availability of insurance |
3% | 5% |
| Other | 5% |
6% |
- Almost three out of five people stated that they have an online network of SMB leaders that is helpful as they continue to develop their organization for the remaining year.
- People are broadly interested in programs that support small businesses, mainly free self-paced courses in social media marketing and finances.
Number Of Small Business Statistics
- According to the U.S. Small Business Administration, there were more than 33 million small businesses in the United States as of 2023.
- Worldwide, there are 400 million small businesses as of 2024.
- The US has 33.2 million small businesses at the start of 2024.
- California has the largest number of small businesses in the US, totaling 4.2 million.
Small Business Demographics Statistics
- Gen X and Baby Boomers are the largest groups of small business owners, while Gen Z contributes only 1% of small businesses.
- 9% of small business owners in the United States are millennials.
 (Reference: truelist.co)
- Just 1% of small business owners are from Gen Z in the United States.
- Small Business Statistics stated that almost 31% of small business owners have a degree.
- The following table shows the small business people by age group:
| Age Group | Share in small business. |
|
Post War |
0.3% |
|
Baby Boomers |
39.6% |
| Gen X |
47.2% |
|
Millennials |
12.9% |
| Gen Z |
1% |
- The following table shows the educational level of the SMB owners:
| Education Level | Share of small business owners |
|
Doctorate |
31% |
| Bachelor’s Degree |
30% |
|
Masters Degree |
18% |
| High School/GED |
17% |
|
Associate Degree |
4% |
- 4% of small business owners are women.
- There are 1.2 million businesses owned by women that employ over 11 million people.
- Almost 20% of small business owners are from minority groups.
- 7% of small business owners are immigrants.
- Asians own 4.8% of small businesses in the US.
- Below is a table showing the percentage of business owners by ethnicity.
| Ethnicity | Percentage Of Small Business Owners |
|
African-American |
5.2% |
| Other Minorities |
0.5% |
|
Asian |
4.8% |
| Hispanic |
4.7% |
|
White |
76.2% |
- Small Business Statistics stated that almost 37% of small business owners are very happy with their businesses.
- Below is a table showing how satisfied small business owners are with their businesses.
| How Happy They Are | Share Of Respondents |
|
Very Happy |
37% |
| Neutral |
13% |
|
Somewhat Happy |
35% |
| Very Unhappy |
4% |
|
Somewhat Unhappy |
11% |
- 42% of small business owners back the Republican Party.
- The following table shows the small business owners by Political Party:
| Political Party | Share Of Respondents |
| Libertarian |
7% |
|
Unaffiliated |
32% |
| Republicans |
42% |
|
Democrat |
19% |
Use Of Technology By Small Businesses Statistics
- 95% of small businesses use at least one technology platform.
- The most popular technologies among small businesses in the US are social media and digital payment systems.
- 87% of small businesses use social media, while 41% use point-of-sale tools.
- In 2023, 61% of small businesses will use technology for marketing and promotions, and 57% of marketers will use technology to handle sales.
- Below is a table showing technology usage by small businesses in various areas for 2023 and 2022.
| Fields with Technology Usage | Percentage of small businesses in 2023 | Percentage of small businesses in 2022 |
| Finding lower-cost suppliers to manage inflation | 24% |
20% |
|
Processing returns |
29% | 21% |
| Preventing fraud / knowing my business partner | 27% |
23% |
|
Managing supply chain challenges |
26% | 19% |
| Managing inventory | 37% |
35% |
|
Developing customer insights |
33% | 27% |
| Identifying/recruiting talent | 30% |
24% |
|
Managing customer relationships |
52% | 43% |
| Identifying potential customers | 41% |
36% |
|
Accessing and managing credit and cash flow |
38% | 34% |
| Communicating with customers/prospects | 56% |
49% |
|
Payroll management |
54% | 45% |
| Accounting | 53% |
51% |
|
Marketing/promotions |
61% | 53% |
| Processing Sales | 57% |
51% |
|
Other |
2% |
3% |
- 1 in 4 small businesses have adopted more than 6 technology platforms for their operations.
- Meanwhile, 31% of small businesses reported using a 0 to 1 platform.
- Around 14% of small businesses indicated they had adopted between 4 and 5 technology platforms by 2023.
- Here is a table showing the number of technology platforms small businesses adopted in 2023 and 2022.
| Number of Technology platforms adopted | Share of small businesses in 2023 | Share of small businesses in 2022 |
| Over six platform | 25% |
14% |
|
4 to 5 platform |
14% | 26% |
| 2 to 3 platform | 31% |
36% |
|
0 to 1 platform |
31% |
25% |
- Small Business Statistics stated that around 23% of small businesses in the United States use AI platforms.
- 56% of these businesses use AI for marketing and promotions, while 42% use it to talk with customers and potential clients.
- Only 13% of small businesses use AI to find lower-cost suppliers to help deal with inflation.
- The table below shows how small businesses are using AI in different areas.
| Field/ Operations | Percentage of Small Businesses |
| Accessing and managing credit and cash flow |
19% |
|
Managing supply chain challenges |
18% |
| Finding lower-cost suppliers to manage inflation |
13% |
|
Accounting |
21% |
| Payroll management |
20% |
|
Identifying / Recruiting Talent |
19% |
| Processing sales |
28% |
|
Preventing fraud and knowing who I’m doing business with |
26% |
|
Processing returns |
21% |
| Managing inventory |
33% |
| Developing customer insights |
32% |
|
Managing customer relationships |
28% |
| Marketing/Promotions |
56% |
|
Communicating with my customers and prospective customers |
42% |
| Identifying potential customers |
36% |
Small Business Marketing Strategies
- Small businesses spend about 8 hours a week on social media marketing.
- 70% of small businesses use social media for marketing purposes.
- Businesses with blogs generate 126% more leads.
- 30% of small businesses hire outside help for their marketing efforts.
- Small Business Statistics stated that around 35% use email marketing to connect with customers.
- On average, they spend $400 each month on marketing.
- They typically invest around 20 hours each week in marketing activities.
- Small businesses with a blog get 67% more leads than those without.
- 54% use social media ads.33% include content marketing in their strategies.
- Those using video marketing grow revenue 49% faster than those who don’t.
- On average, small businesses spend $500 per month on digital marketing.
- Small Business Statistics stated that around 31% have seen an increase in sales due to email marketing.
- They usually spend $150 each month on social media marketing, and 37% have yet to write a written content plan.
 (Source: smallbusinessweb.co)
- Engaging with customers on Instagram helps businesses grow faster.
- 25% of businesses outsource their social media marketing.
- Companies with a blog receive 97% more backlinks to their websites.
- They spend about 45% of their time on marketing tasks.
- Those who engage with customers on Instagram see better conversion rates.
- Small businesses with clear plans are 16% more likely to succeed.
- 61% invest in social media marketing to increase brand awareness.
- 25% of those who interact with customers on Facebook notice a rise in sales.
- 68% plan to spend more on digital marketing this year.
- Businesses that respond to online reviews are seen as 1.7 times more trustworthy.
- 44% plan to boost their content marketing spending.
- 52% of owners say their biggest challenge is finding time or resources for effective marketing.
- Small businesses that use customer analytics are 1.5 times more likely to be profitable.
- Small Business Statistics stated that around 60% of those using email marketing consider it their most effective strategy.
- They spend about $100 monthly on email marketing.
- 36% have yet to set a specific target audience for their marketing.
- Businesses that blog regularly generate 97% more leads than those that don’t.
- 72% of owners believe social media marketing is effective for their business.
- Companies that use video in their strategy see revenue grow 49% faster.
Women In Business Statistics
- More women are starting businesses today. Although they have made progress toward equality, they still face challenges, which have kept women leaders from succeeding.
- Women-owned small businesses bring in $388.1 billion in revenue. They provide jobs for 10.1 million workers.
- The states with the highest female-owned companies are Virginia, Hawaii, and Colorado.
- Female-owned businesses grew by 0.6% in the last year and 21% over the past five years.
 (Reference: pay.com)
- More than 1,800 new female-owned companies are launched each day in the United States
- For many female businesswomen, getting more funding and financial support is a key priority, especially since about 53% rely on personal savings.
- Women are also less involved in trade and exporting compared to men. In 2022, only about 11% of women-led businesses exported goods, while 19% of male-led businesses did.
- This gap continues even though women-led firms are usually smaller and focus more on services.
- 31% have school-aged children at home.
- About 61% say that school closures have impacted their businesses, and 30% have had to cut back because of childcare needs.
 (Reference: pay.com)
- Before the pandemic, just 6% offered childcare benefits, but this rose to 14%, planning to do so afterward.
- Entrepreneurship is becoming more open to people from different backgrounds.
- Women from various cultures are stepping into the business world, and while there’s still progress to be made, we have come a long way.
- Currently, women of color own about half of all female-owned businesses.
- Women keep bringing new ideas and energy to the business world, creating jobs for millions.
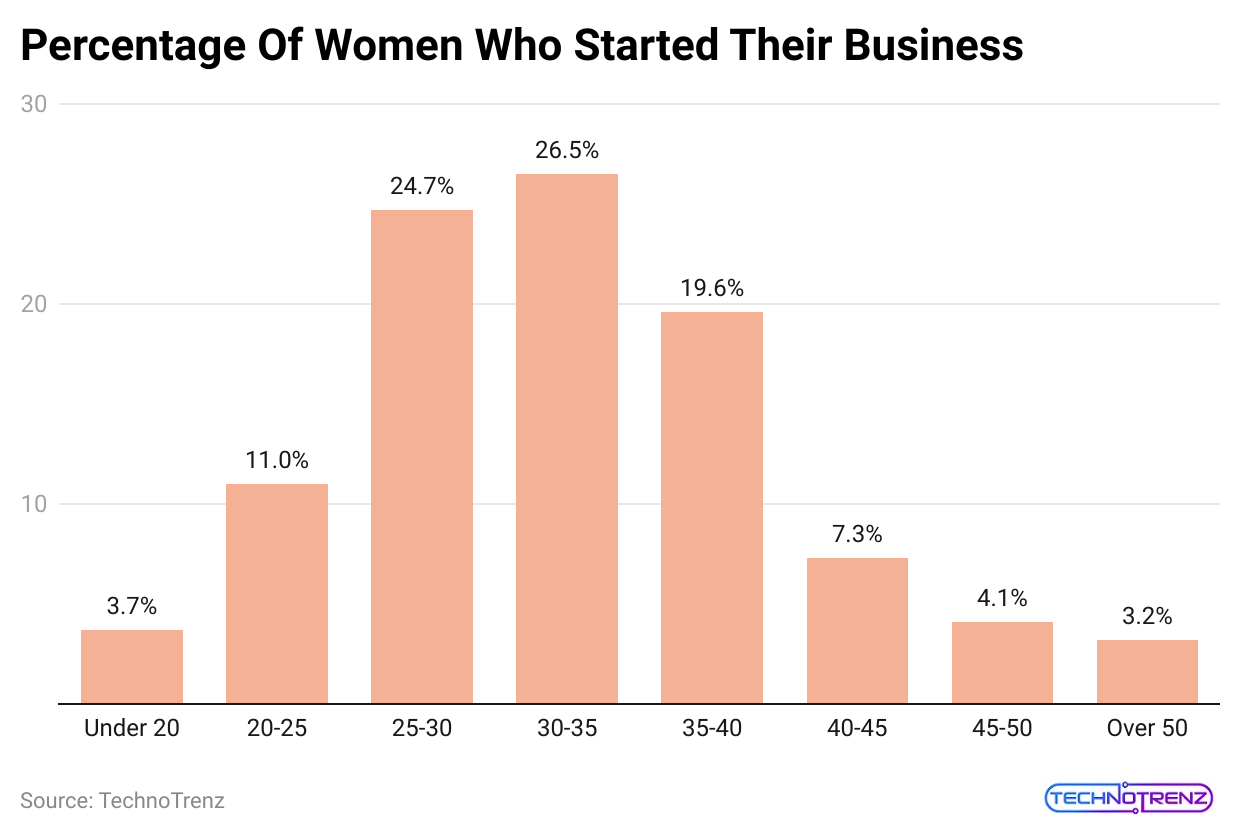 (Reference: researchgate.net)
| Age Group | % |
|
Under 20 |
3.70% |
| 20-25 |
11.00% |
|
25-30 |
24.70% |
| 30-35 |
26.50% |
|
35-40 |
19.60% |
| 40-45 |
7.30% |
|
45-50 |
4.10% |
| Over 50 |
3.20% |
- Women of color make up 39% of all women in the US, yet they are responsible for 89% of the new women-owned businesses started each day.
- Females of color own 6.4 million businesses in the country, which provide jobs for about 2.4 million people.
Artificial Intelligence In Small Business Statistics
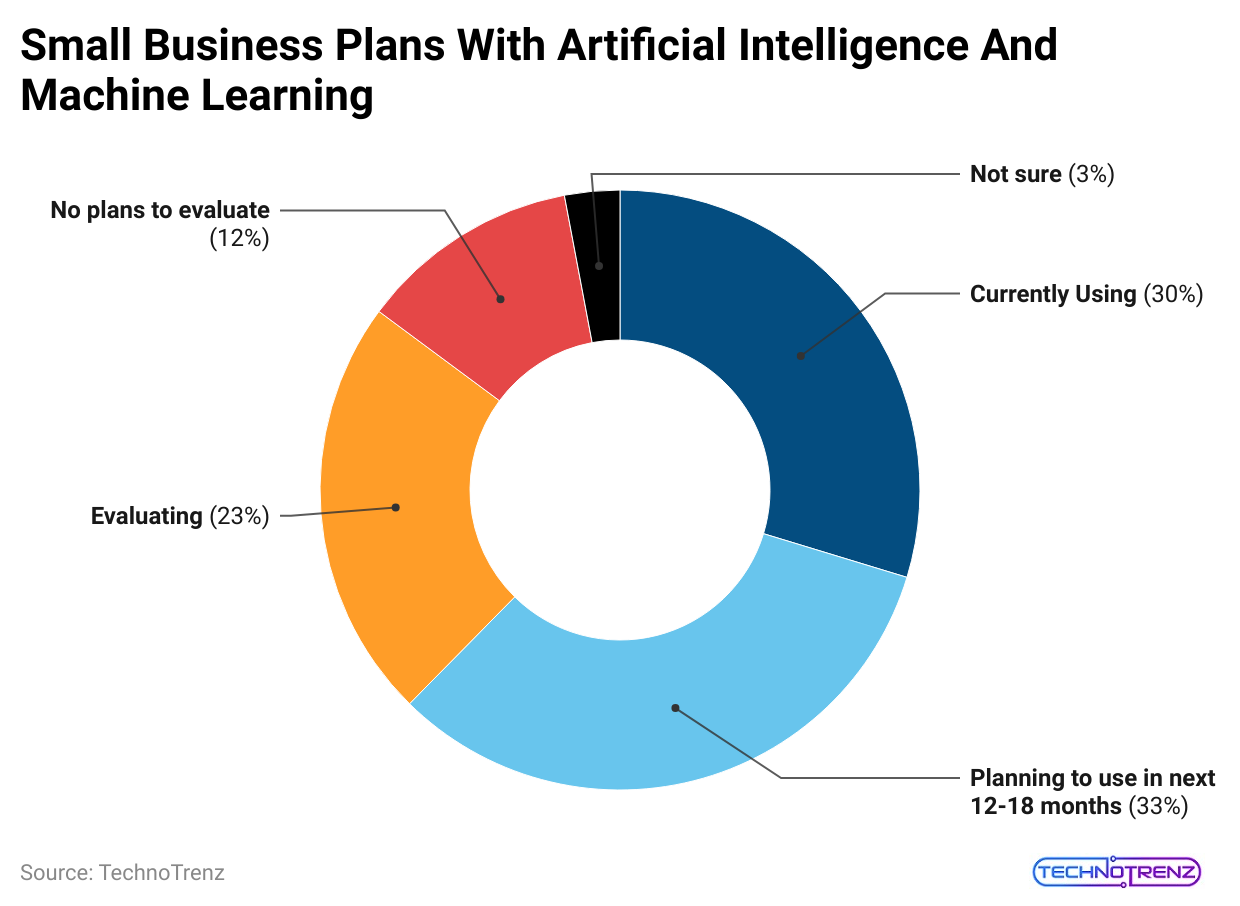
- However, 37% of these businesses say the main challenge with adopting AI is the need for more expertise.
- Still, 42% of small businesses are working on plans to use AI in the future.
- Nearly 30% of small businesses have started using AI technology.
 (Reference: colorwhistle.com)
- Additionally, 29.5% of these owners think that Artificial Intelligence I will have the biggest impact on their business in the coming year.
- The common use of AI for these smaller companies is making content for advertising ads and emails, with 48% of owners stating they use this technology for that purpose.
 (Reference: colorwhistle.com)
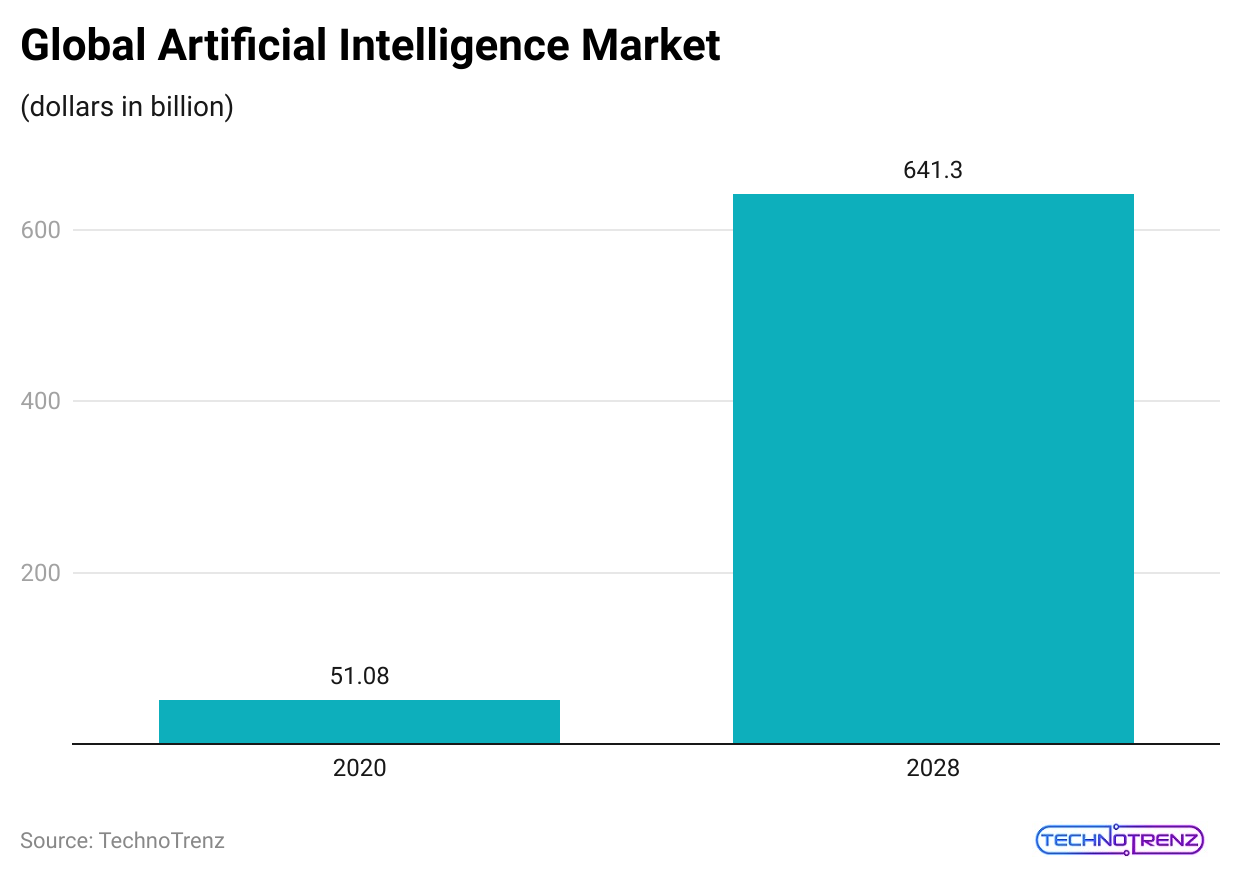
- The size of the Artificial Intelligence (AI) market was stated at $52.08 billion in 2021 and is expected to grow to $642.30 billion by 2029, with a growth rate of 37.1% from 2022 to 2029.
- By 2027, the worldwide Artificial Intelligence market value is projected to reach $268 billion.
- AI is anticipated to add $16.7 trillion to the worldwide economy by 2031. Currently, 37% of companies and organizations are using AI.
- The rise of artificial intelligence is expected to leave 86 million jobs and introduce 98 million new ones by 2025.
 (Reference: colorwhistle.com)
- In the above table, we can see the revenue from the global AI software market.
| Year | Million of US dollars |
|
2018 |
$10.1 |
| 2019 |
$14.69 |
|
2020 |
$22.59 |
| 2021 |
$34.87 |
|
2022 |
$51.27 |
| 2023 |
$70.94 |
|
2024 |
$94.41 |
| 2025 |
$126 |
- Around 67% of people in the US think that self-driving cars are safer than traditional cars, and 26 nations are presently developing autonomous vehicles.
- The self-driving car market could be worth over $600 billion in the next five years.
 (Reference: colorwhistle.com)
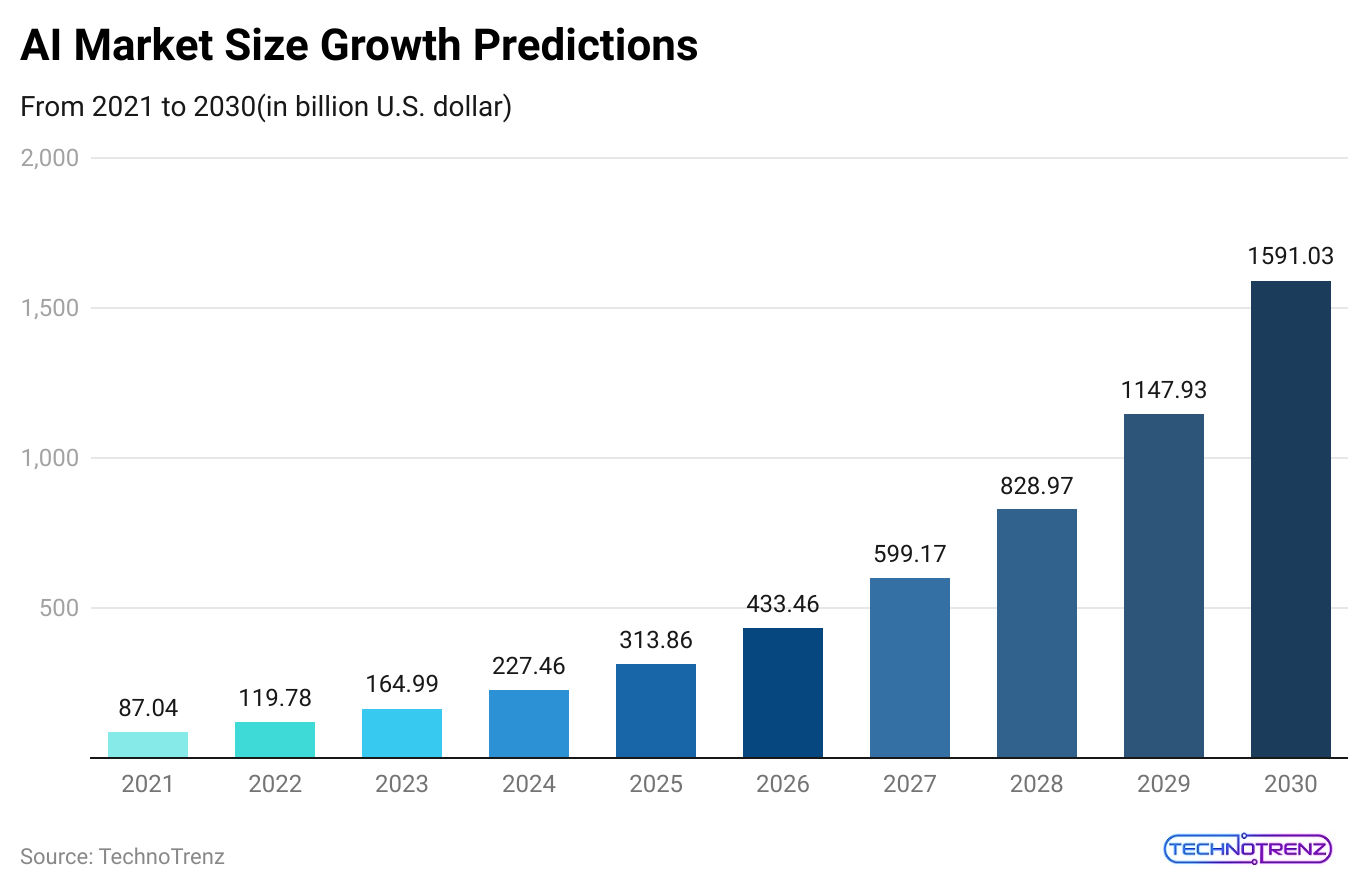
| Year | Million of US Dollars |
|
2021 |
$87.04 |
| 2022 |
$119.78 |
|
2023 |
$164.99 |
| 2024 |
$227.46 |
|
2025 |
$313.86 |
| 2026 |
$433.46 |
|
2027 |
$599.17 |
| 2028 |
$828.97 |
|
2029 |
$1,147.93 |
| 2030 |
$1,591.03 |
- According to a Deloitte study, over 50% of organizations plan to adopt AI and automation technologies in 2023.
- Tractica estimates that the AI software market will grow to $118.6 billion annually by 2025.
AI in Customer Service
- In 2020, 81% of people used chatbots in their customer service strategies.
- 40% of companies say improving consumer experience is their main reason for using AI.
- Chatbots handled 85% of consumer service interactions.
AI in Voice Search
- 97% of smartphone users use AI-powered voice assistants.
- Over 4 billion gadgets have AI voice assistants.
- 41% of people use the voice search feature at least once a day.
AI in Machine Learning
- 63% of organizations stated plans to either increase or keep their spending on AI and machine learning in 2024.
AI in Marketing
- 48% of marketing managers believe AI greatly affects how consumers communicate with their brands.
- Small Business Statistics stated that almost 51% of e-commerce businesses use Artificial Intelligence to provide a smooth shopping experience.
- 63% of B2B managers think AI is important for their marketing strategies.
AI in the Retail Industry
- Spending on AI in retail is predicted to value $21.05 billion by 2026, with a growth rate of 40%.
- 80% of retail leaders predict their organizations will use AI-powered automation by 2027.
Small Business Owners Statistics
- The average yearly salary for small business owners in the US is $62,083.
- According to small business statistics, 75% of American entrepreneurs are either somewhat happy (36%) or very happy (39%) with their work.
- The largest age groups among small business founders are Baby Boomers (45.45%) and Gen Z (46.46%).
- Minorities own 18.3% of small businesses in America.
- Most American entrepreneurs are White or Caucasian (84.7%), while only 4% are Black or African-American, Hispanic, Latino, or of Spanish origin, and another 4% are Asian or Asian-American.
- In the US, 23.4% of business owners are women, compared to 77.5% who are men.
- Women run 1.1 million small businesses in the US, 36.8% of which are owned by American Indian and Alaska Native women, compared to 19.8% owned by White women.
- Owners say the three most important skills for entrepreneurs are creativity (57%), critical thinking (33%), and good communication (32%).
- 25% of small business owners are women, while 75% are men.
- Most small companies are owned by Gen Xers (47.2%), followed by Baby Boomers (39.6%), Millennials (12.9%), and older generations (0.3%).
- 2% of owners are White or Caucasian, 5.2% are Black or African-American, 4.8% are Asian or Asian-American, and 4.7% are Hispanic, Latino, or of Spanish origin
- 42% of small business owners identify as Republican, compared to 19% who are Democrats and 7% who are Libertarians. The remaining 32% do not affiliate with any party.
- The main reasons owners start small businesses are the desire to be their boss (28%), dissatisfaction with corporate work (23%), and wanting to pursue their passion (13%).
- 72% of owners report being somewhat or very happy, while only 4% feel very unhappy.
- The average yearly salary for a small business owner in the US is $108,240.
Conclusion
Small Business Statistics show that owners often experience many ups and downs. Since COVID-19 started in 2020, they have had little break. Government lockdowns and measures over the past two years have made it hard for them to survive. Now, small business owners are facing another challenge: rising gas prices. To cope with this, many are taking different actions. Some are cutting back on services, while others are updating contracts. Many decide to pass the extra costs on to their customers.
Sources
FAQ.
In the US, 99.9% of businesses are small, and only 0.1% are not considered small. Of these small businesses, 98% have fewer than 100 employees, and 89% have fewer than 20 workers.
On average, a business with one owner or employee makes about $44,000 each year. However, two-thirds of these small businesses earn less than $25,000 annually.

Saisuman is a professional content writer specializing in health, law, and space-related articles. Her experience includes designing featured articles for websites and newsletters, as well as conducting detailed research for medical professionals and researchers. Passionate about languages since childhood, Saisuman can read, write, and speak in five different languages. Her love for languages and reading inspired her to pursue a career in writing. Saisuman holds a Master's in Business Administration with a focus on Human Resources and has worked in a Human Resources firm for a year. She was previously associated with a French international company. In addition to writing, Saisuman enjoys traveling and singing classical songs in her leisure time.