Social Commerce Statistics By Payment, Market Size, Demographics, Regions, Strategies, Advantages, Revenue And Sales
Updated · Sep 30, 2024
WHAT WE HAVE ON THIS PAGE
- Introduction
- Editor’s Choice
- What Are Social Commerce Statistics?
- Differences Between Social Commerce And E-Commerce
- General Social Commerce Statistics
- Social Commerce Payment Statistics
- The Best Social Commerce Platforms
- Social Commerce Market Size Statistics
- Social Commerce Demographics Statistics
- Mobile Social Commerce Statistics
- Social Commerce Regional Statistics
- Social Commerce Revenue And Sales Statistics
- Social Commerce Strategies For 2024
- E-Commerce Statistics
- Advantages Of Social Commerce Statistics
- Conclusion
Introduction
Social Commerce Statistics: Online shopping is becoming more social. Picture this: you’re scrolling through Instagram, see something you love, and can buy it right there in the app—no need to visit a separate website. This is what social commerce does. It makes shopping easier by cutting out extra steps, which means shoppers are more likely to complete their purchases. Because of this, social commerce could be a big factor in how successful your brand is on social media.
Consumers use social media for many reasons, like getting news, entertainment, connecting with friends, researching, and shopping. The worldwide social commerce market is expected to be worth $2.4 trillion in 2023, and it could grow to $8.5 trillion by 2030. In this post, Social Commerce Statistics, we’ll explore what social commerce is and how your brand can take advantage of it.
Editor’s Choice
- About 81% of consumers say their buying choices are affected by friends’ social media posts, while 78% are influenced by brand posts.
- Stated that 53% of global consumers plan to shop more on social media in the future.
- People who have bought something through social commerce are twice as likely to try a brand they’ve never heard of compared to those who haven’t shopped this way.
- 13% of social media users think a “buy” button is a key factor in their purchasing decisions.
- 44% of Generation Z have made a purchase based on a recommendation from a social media influencer, while 26% of the general population has done the same.
- 54% of Gen Z shoppers and 58% of Millennials believe social media is better than online searches for finding new products.
- About half of U.S. Gen Z and millennial users buy products on social media, while 38% of all US adults do. Boomers are the least likely to shop this way.
- TikTok is viewed as the most trusted platform for social shopping among Gen Z, although it is the least trusted overall across all age groups.
- 41% of Gen Z and Millennials make impulse purchases online every 2-3 weeks.
- Social Commerce Statistics stated that 73% of Boomers reported making a purchase on Facebook in the last three months.
- Consumers say Facebook provides the best in-app shopping experience and is the most recently used platform for in-app purchases.
- More than 70% of online shoppers use social media to recommend the brands they buy from.
- Recommendations from social media influencers help 49% of consumers decide what to buy, and around 80% have purchased something after seeing it endorsed by an influencer.
- During the holidays, 34% of consumers used social media to make purchases, and 70% of US consumers looked to social networks for inspiration.
- More people find the right product through targeted ads (49%) than through organic posts from brands (40%).
What Are Social Commerce Statistics?
Social commerce uses social media sites to promote and sell products and services. It creates a complete shopping experience on platforms like Facebook, Instagram, and X (formerly Twitter). Customers can discover, browse, and buy products directly on these sites.
The success of a social commerce campaign is measured by how much people engage with the marketing through likes, shares, and comments. More interaction means more visibility and reach for the brand.
User-generated content, like reviews and feedback, is also important because it helps build trust and encourages people to make purchases. As social commerce grows, brands are finding new ways to connect with customers, using influencer partnerships, interactive posts, and personalized shopping experiences to increase sales and build community.
Differences Between Social Commerce And E-Commerce
The main difference between social commerce and e-commerce is that social commerce lets you shop directly within social media platforms. In contrast, e-commerce requires you to visit separate online stores or websites. Here’s a closer look at the differences:
| Aspect | Social Commerce | E-Commerce |
| Relationship Building Focus | Focuses on immediate purchases through social platforms |
Emphasizes engaging customers to build long-term relationships |
| Customer Retention Risk | Lower chance of cart abandonment due to a simpler buying process | Higher rates of cart abandonment because of complicated checkout processes |
| User Engagement Impact | Social interactions heavily influence buying choices. | Marketing strategies, online ads, and websites guide purchases. |
| Purchase Convenience | Enables direct purchases within social media profiles | Customers have to go to different online stores or websites to shop |
|
Origin and Growth |
Came from e-commerce, mixing social media with online shopping | Started in the 1990s and grew rapidly in 2020 because of the pandemic |
General Social Commerce Statistics
- Social commerce is expected to reach a 25% penetration rate by 2024, meaning that one in four potential customers will use social media for shopping.
- Social commerce generated $571 billion in 2023. With a projected annual growth rate of 13.7%, it is expected to exceed $1 trillion by 2028.
- This fast growth shows a strong market where businesses can connect with new customers and increase sales, according to Social Commerce Statistics.
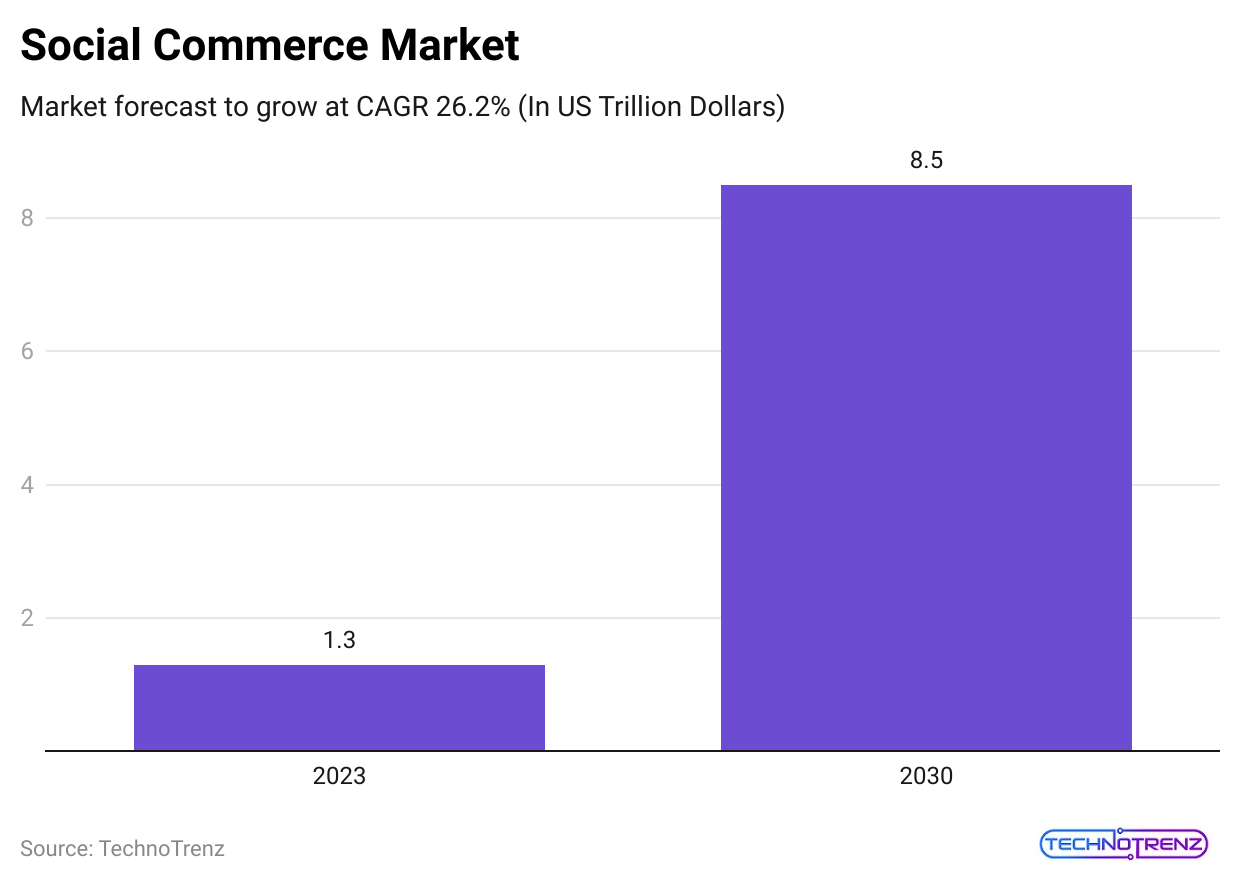
- The global social commerce market is predicted to hit $8.5 trillion by 2030, highlighting significant growth opportunities for businesses in this area.
 (Reference: hostinger.in)
- Social commerce is projected to grow rapidly, with global sales estimated to reach $8.5 trillion by 2030.
- According to Social Commerce Statistics, this enormous market size presents a great chance for businesses to expand their reach and connect with customers worldwide.
- The market was valued at $1.3 trillion in 2023, showing significant growth. This fast increase is driven by a compound annual growth rate (CAGR) of 26.2% from 2023 to 2030, indicating the rising popularity of shopping online through social media.
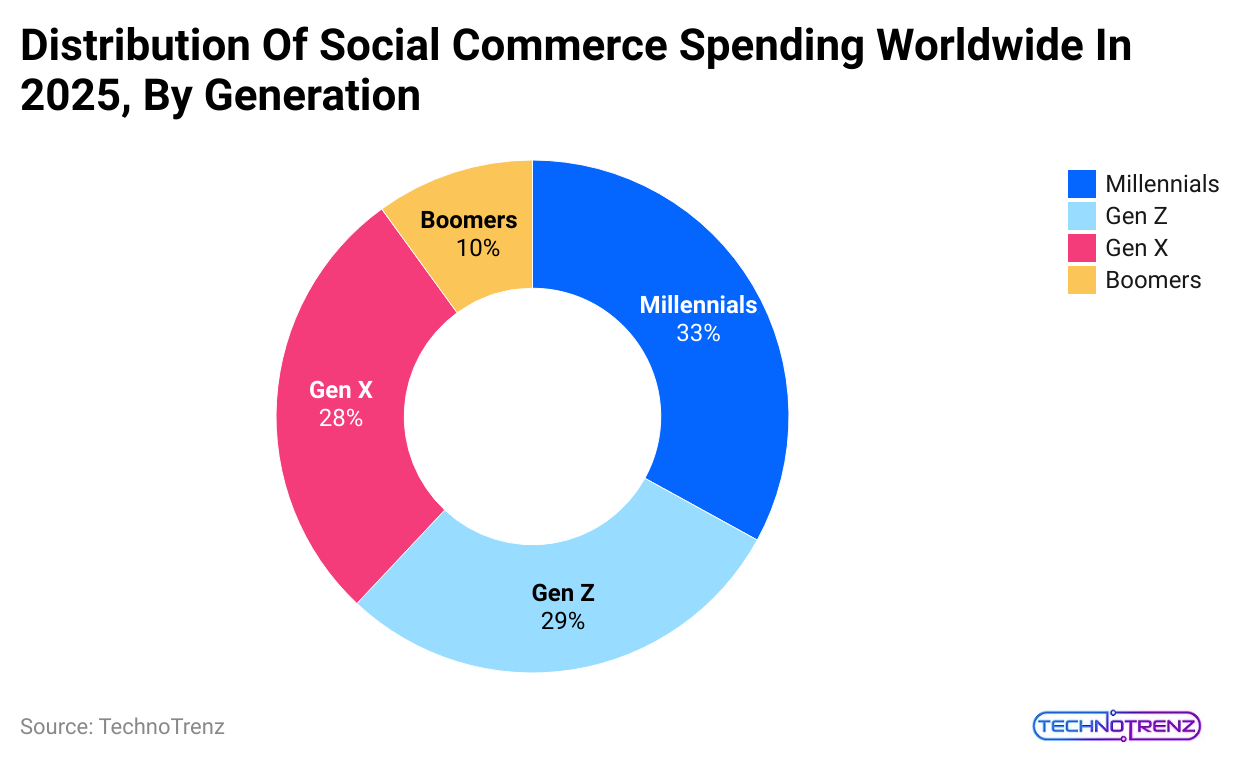
- By 2025, millennials are expected to account for 33% of global social commerce spending, making them the largest group in this market.
- Gen Z shoppers are just a little behind, projected to represent 29% of spending. This trend highlights that younger generations, who are comfortable making in-app purchases, are key drivers of social commerce growth.
- As social media continues to influence shopping habits, US social commerce sales are expected to reach nearly $150 billion by 2028.
- In 2023, US social commerce sales were about $64.8 billion, and they are predicted to surpass $90 billion in 2025.
 (Reference: blog.hubspot.com)
- The US market leads in adopting social commerce, offering businesses a great opportunity to implement social selling strategies and engage an active audience.
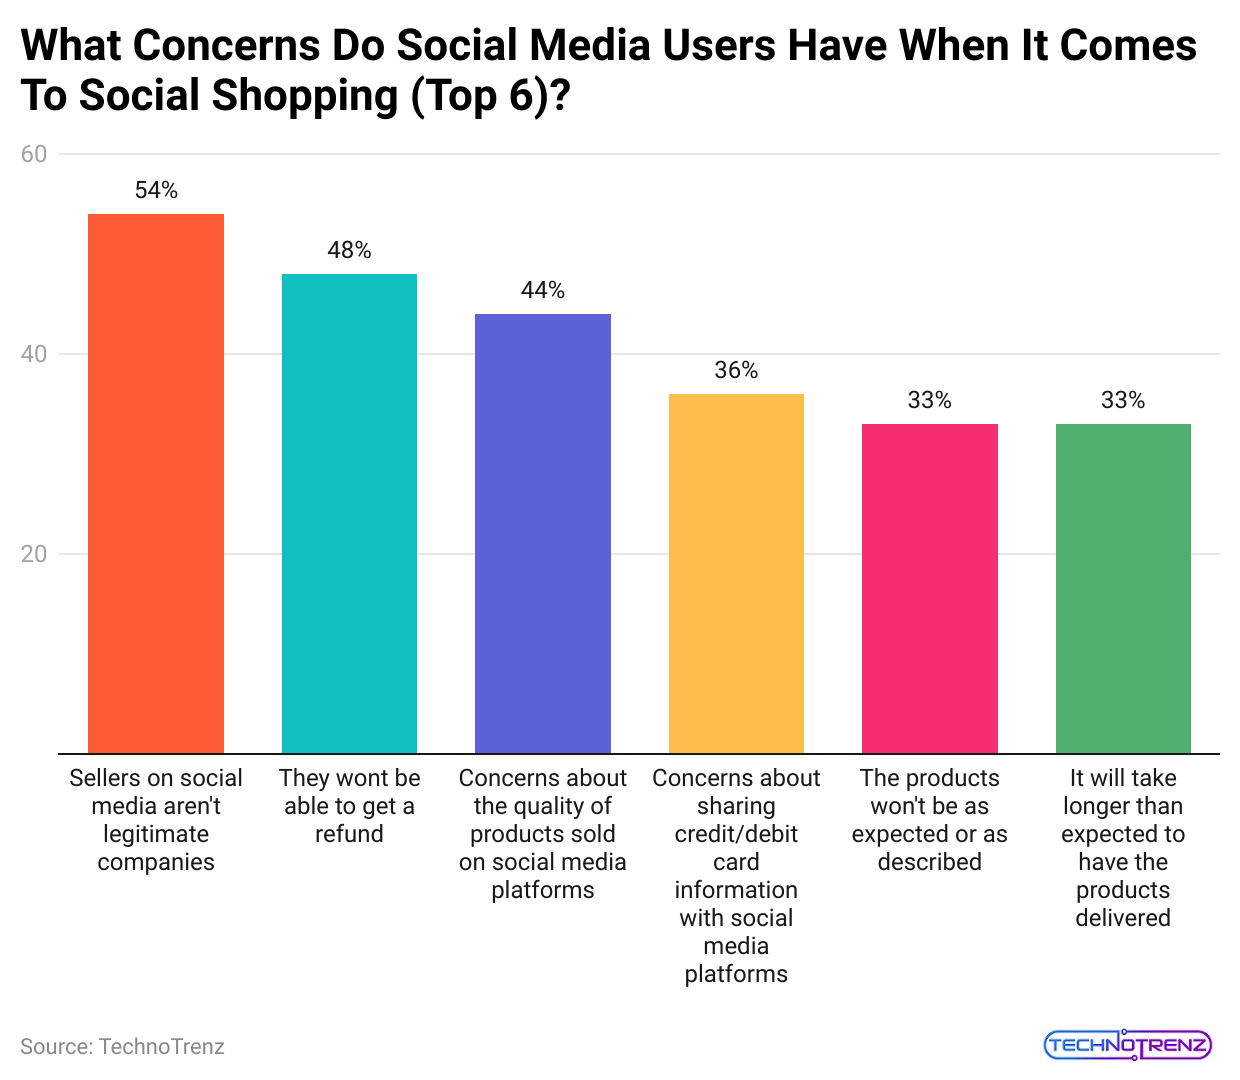
- Around 58% of shoppers in the US said they bought a product after seeing it on social media.
- In comparison, 44% of shoppers in the UK and 40% in Germany reported purchasing spotting something on social networks.
- This illustrates the significant potential for businesses to use social media for product promotion and sales.
Social Commerce Payment Statistics
In the online shopping world, the way people pay for their purchases is very important. Keeping up with the latest trends and payment statistics is essential for any business that wants to make buying easy and secure for customers.
Here are some key Points About Payment Methods and Trends:
- Digital wallets like PayPal, Venmo, and Apple Pay are expected to make up 52.5% of online transaction values by 2025.
- 45% of mobile transactions occur through a mobile app.
- The global “buy now, pay later” (BNPL) market was worth $24.5 billion in 2022 and is expected to grow to $160.7 billion by 2032.
- In 2022, 5% of online purchases in the US were made using buy now, pay later options.
- BNPL is more widely used in Europe, and it is expected to reach 13.6% of eCommerce spending by 2024.
- Social Commerce Statistics stated that one out of five eCommerce businesses offer a BNPL payment option.
- North America has the highest value of fraudulent transactions, accounting for over 42% of eCommerce fraud worldwide.
- 52% of eCommerce companies say that adapting payment methods to local markets is their biggest challenge right now.
The Best Social Commerce Platforms
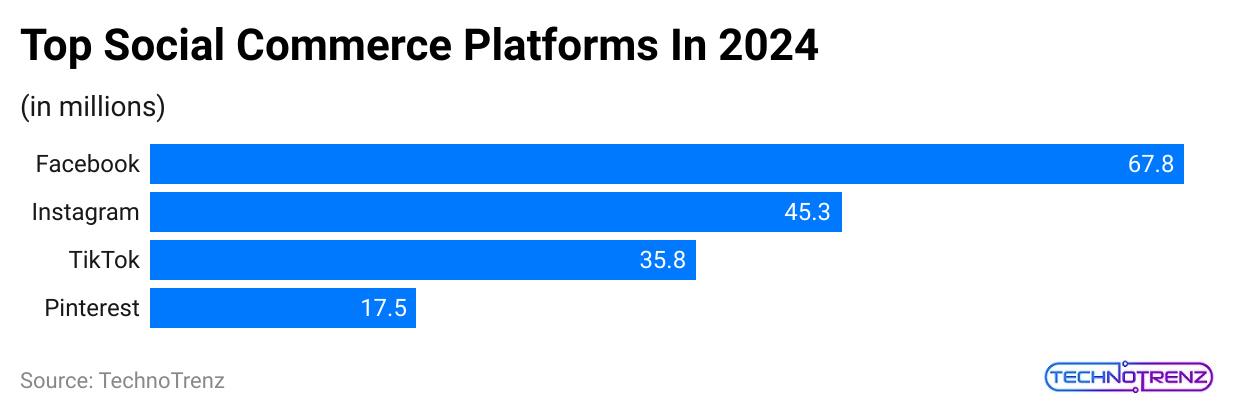
Here are four major social media platforms that provide built-in tools for social commerce. As social commerce becomes more popular, other platforms may introduce their shopping features.
 (Reference: oberlo.com)
TikTok
(Reference: emarketer.com)
- TikTok is a newer player in social commerce, but it’s growing quickly. It’s expected to reach 48.8 million users in the US by 2025, surpassing Instagram’s 48.2 million, even though Instagram has been around longer.
- Many TikTok users aren’t just there for fun; about 43% of Gen Z start their product searches on TikTok, which beats traditional sites like Google or Amazon.
- By 2026, around 39.5 million people in the US are projected to shop on TikTok.
- TikTok entered the social commerce space by partnering with Shopify in 2023, according to Social Commerce Statistics.
- This allows businesses with a TikTok for Business account to add shopping tabs to their profiles, making it easy for users to browse products without leaving the app.
- Tai Adaya, founder of HABIT, says, “Advertising on TikTok has skyrocketed our growth. We can’t keep items in stock! TikTok has put us in front of a huge audience.”
 (Source: emarketer.cpm)
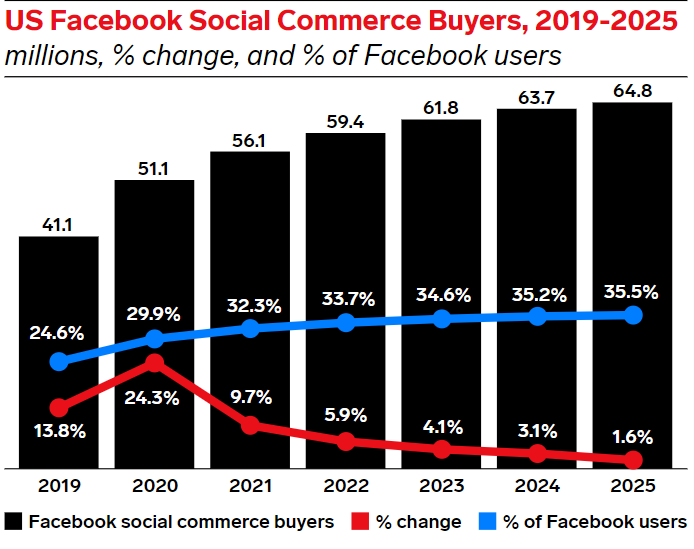
| Year | Facebook social commerce buyers | % change | % of Facebook users |
|
2019 |
41.1 | 13.8% | 24.6% |
| 2020 | 51.1 | 24.3% |
29.9% |
|
2021 |
56.1 | 9.7% | 32.3% |
| 2022 | 59.4 | 5.9% |
33.7% |
|
2023 |
61.8 | 4.1% | 34.6% |
| 2024 | 63.7 | 3.1% |
35.2% |
|
2025 |
64.8 | 1.6% |
35.5% |
- Facebook is the top social commerce platform for 89% of marketers looking to increase retail sales.
- Consumers also prefer Facebook; Statista reports that one-third of social commerce buyers choose it for their purchases.
- An Insider Intelligence survey found that 62% of US social buyers made their last purchase on Facebook, thanks to features like Marketplace and Shops.
- According to Social Commerce Statistics, creating a Facebook page is a smart choice for brands getting started with Social Commerce.
- Any Facebook Business account can set up a Facebook shop, which is a customizable online store where brands can upload their product catalog or create one from scratch.
- Customers can view products, check sizes and colors, and ask questions through Facebook Messenger.
- They can complete purchases using Facebook Checkout without leaving the app, or brands can direct them to their online store.
- With Shopify integration, brands can automatically sync products to Facebook, making it easy to create shoppable posts and ads.
 (Source: emarketer.com)
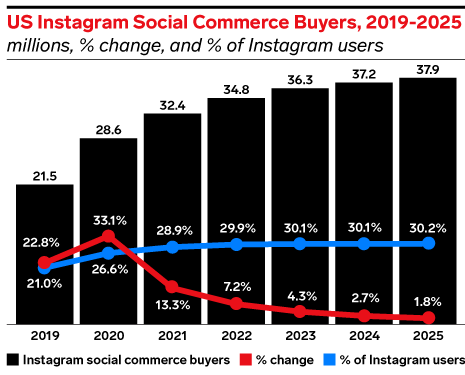
| Year | Instagram social commerce buyers | % change | % of Instagram users |
|
2019 |
21.5 | 22.85 | 21.0% |
| 2020 | 28.6 | 33.1% |
26.6% |
|
2021 |
32.4 | 28.9% | 28.9% |
| 2022 | 34.8 | 29.9% |
29.9% |
|
2023 |
36.3 | 30.1% | 30.1% |
| 2024 | 37.2 | 30.1% |
30.1% |
|
2025 |
37.9 | 30.2% |
30.2% |
- Instagram, also owned by Meta, is a major social commerce platform.
- Studies show that nearly 26% of people over age 13 worldwide use Instagram.
- According to Instagram, 70% of shoppers use the platform to find new products.
- Instagram Shops allow users to buy items featured in photos and videos. Similar to Facebook, Instagram Business accounts can create customizable storefronts to showcase collections of products.
- Each product has its page with pricing, descriptions, and images.
- Brands can use several features on Instagram Shops, including:
- Shopping Tags: Tag products in posts and Stories.
- Shop Tab: Users can browse and purchase products from brands or tagged influencers.
- Ads: Create ads with Shop tab placements that link to product details.
- Shop through DMs: Customers can make purchases and ask questions via Instagram DMs.
 (Source: emarketer.com)
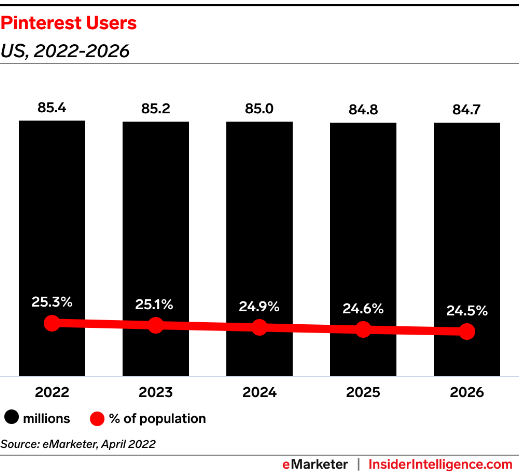
| Year | millions | % of population |
|
2022 |
85.4 | 25.3% |
| 2023 | 85.2 |
25.1% |
|
2024 |
85.0 | 24.9% |
| 2025 | 84.8 |
24.6% |
|
2026 |
84.7 |
24.5% |
- Pinterest acts as both a search engine and a social media platform for images. With over 465 million monthly users, it’s a popular place for finding ideas and researching products.
- A big advantage is that 97% of Pinterest searches are unbranded, and 31% of US users with household incomes over $100,000 are on the platform.
- When businesses upload product listings, they can reach potential customers who may need to learn about their products but do not have the means to buy them, according to Social Commerce Statistics.
- A great example is All birds, which uses shoppable product pins to connect with customers.
- Their listings are optimized for both brand and product type, maximizing their visibility in Pinterest’s Shop tab.
These platforms are leading the way in social commerce, offering businesses unique opportunities to reach and engage with customers.
Social Commerce Market Size Statistics
Social commerce is growing quickly, thanks to the digital world, making shopping easier and more accessible. Here are some important growth projections and statistics:
 (Source: kbvresearch.com)
- Social commerce reached $1.6 trillion in 2024 and is expected to grow at a 31.6% compound annual growth rate (CAGR).
- Grand View Research predicts that the global social commerce market will grow at a 31.6% CAGR until 2030.
- According to the Deloitte India Report, India is on track to become the third-largest consumer market.
- Its online commerce market is expected to reach $325 billion by 2030, up from $70 billion in 2022. This growth is mainly due to the expansion of eCommerce in smaller cities.
- According to Social Commerce Statistics, social commerce is projected to account for 12.4% of global retail sales in 2024.
- eMarketer suggests that social commerce will see a 10.9% increase in 2024 compared to 2023.
- Social commerce is becoming a more user-friendly and engaging shopping platform. These platforms have lots of data that help predict trends and encourage quicker buying decisions.
- India’s social commerce market is expected to reach $20 billion in 2024, up from $7 billion in 2022.
- This growth is driven by the increasing popularity of social media influencers, the growing number of social media users, and smartphone adoption.
- PWC reports that about 55% of internet users in India are in urban areas.
- India’s D2C market is expected to hit $60 billion by FY27.
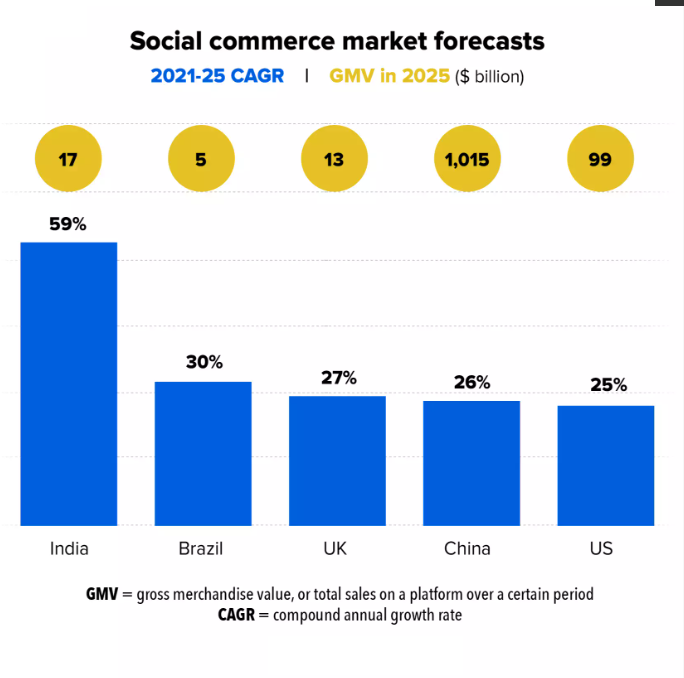 (Source: economictimes.indiatimes.com)
- Shopify indicates that the overall eCommerce market in India is projected to reach $350 billion by 2030, having grown 21.5% in 2022 to $74.8 billion.
- Grand View Research states that the B2C segment held a 55.97% market share as of 2022.
- Various research organizations see India as a rising social commerce destination, as per Social Commerce Statistics.
- InGovern predicts a market size of $20 billion by 2026, RedSeer Consulting forecasts $60 billion by 2025, and Sequoia Capital estimates $70 billion by 2030.
- Deloitte also states that India will become the third-largest social commerce market after China and the USA.
Social Commerce Demographics Statistics
- Younger people are leading the way in social commerce, but Baby Boomers are also spending more time on social media and making purchases, so they shouldn’t be overlooked.
- Millennials are the biggest group buying things through social media, with Gen Z following closely behind; over half of them report making purchases on these platforms.
 (Reference: tidio.com)
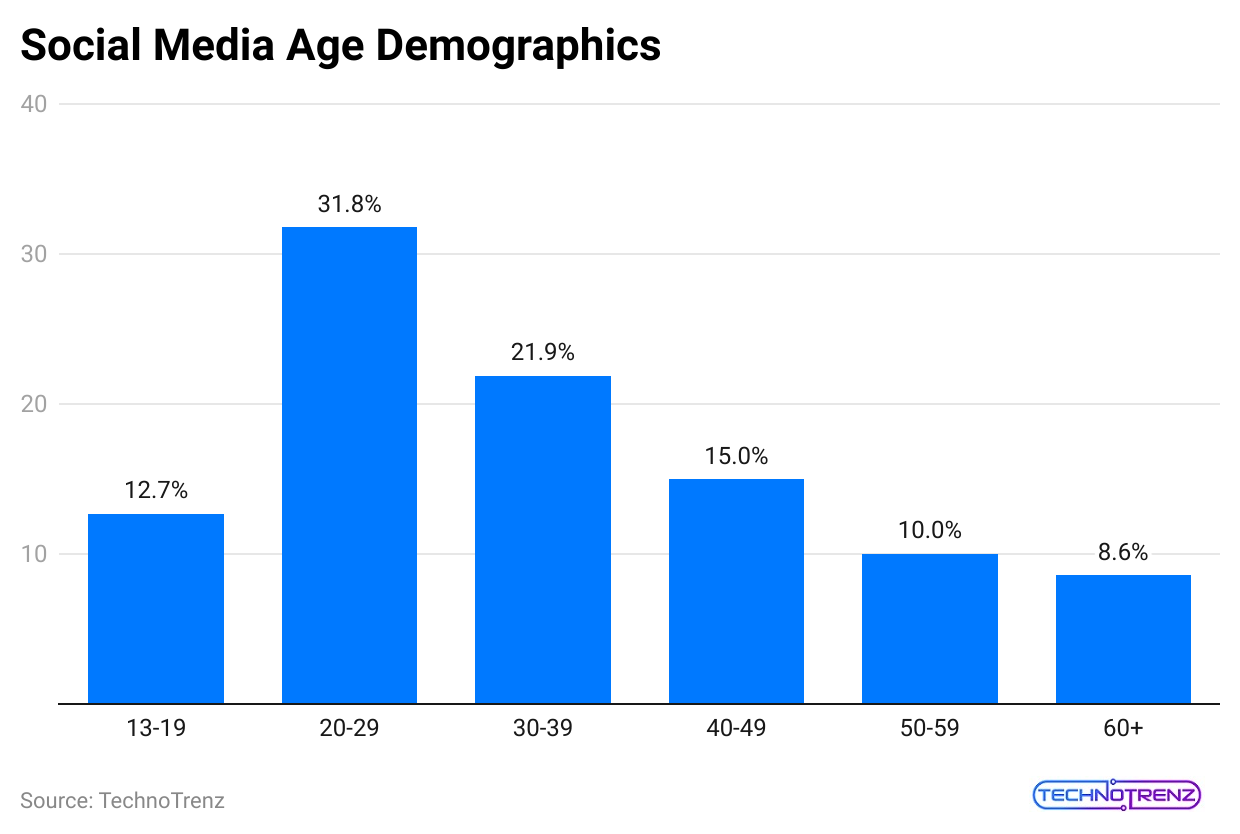
- Among different age groups, 83% of people aged 16 to 24 have bought something via social media, while only 33% of those over 55 have done the same.
- By the second quarter of 2023,70% of online shoppers aged 27 to 42 worldwide had already made purchases directly through social networks.
- Baby Boomers are a valuable market; their time spent on social media has increased by 68% since 2013.
- The number of Boomers using TikTok has grown by 57% since 2021, and they are now more likely to have bought something online in the past week than Gen Z. They have significant spending power, as they have more time to scroll and more money to spend.
- According to the Social Commerce Statistics, 21% of consumers consider themselves content creators or influencers. This number rises to 45% for Gen Z and Millennials.
- A surprising trend is that more people are trusting these creators for product recommendations.
- The same HubSpot report shows that 40% of consumers use social media to learn new things or find ideas.
- More people are turning to TikTok for inspiration, which was less common in previous years.
- Like YouTube, social media is becoming a key place for learning and discovery.
 (Reference: oberlo.com)
- About two-thirds of Millennials follow and buy from brands on social media. In contrast, about 50% of Gen Z have bought products through influencers, while only 11% of Baby Boomers have done this. Interestingly, older generations tend to buy directly from brands rather than influencers.
- 60% of Gen X respondents follow and shop from retailers’ social media accounts, as per Social Commerce Statistics.
- However, this trend may change as older influencers become more popular, challenging stereotypes and attracting younger audiences.
Mobile Social Commerce Statistics
- As smartphones become a bigger part of our daily lives, mobile shopping is changing how people buy things and what they expect.
- Mobile Social Commerce is not just a passing trend; it’s a new way for retailers to connect with customers, offering convenience, speed, and personalized experiences.
Here are some Important Points About Mobile Shopping:
- The mobile eCommerce market is valued at $2.2 trillion and is expected to make up 52% of the total market by 2027.
- The average order value on mobile is lower than on desktop, ranging from $90 to $110, while desktop averages between $140 and $175, depending on the season.
- 68% of shoppers look at products on their mobile devices, and 56% of online sales are completed on mobile websites and apps.
- Social Commerce Statistics stated that almost 29% of Americans buy products on their smartphones at least once a week.
- 71% of adults in the US use their phones to shop online.
- 88% of mobile device time is spent on apps, and 70% of mobile sales happen through shopping apps.
- 95% of young people aged 13-17 own a phone, showing the strong impact of mobile marketing and social media on this age group. Most kids get their first phone around age 11.
- 28% of US shoppers use their phones while in stores to check for discounts, find product information, and compare prices.
- 73% of consumers will leave a poorly designed mobile site for one that makes buying easier.
- Adding clear call-to-action (CTA) buttons, like a Click-To-Call button, can increase clicks by 45%, according to Social Commerce Statistics.
- One in ten people who get a text message will click on it, resulting in a 16.9% increase in orders.
- The rate of cart abandonment is higher on mobile devices, averaging 85.65%.
Social Commerce Regional Statistics
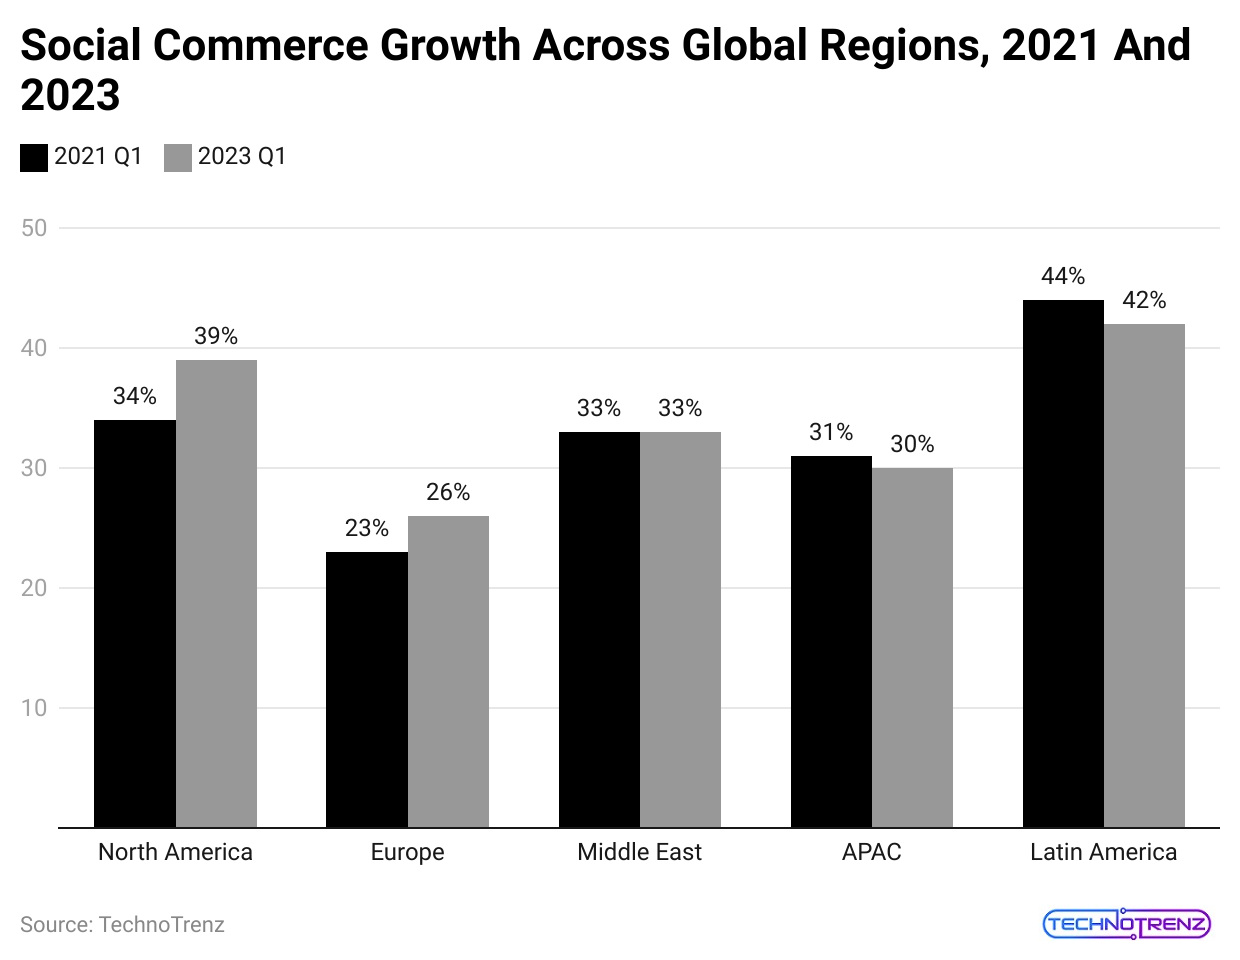
- In 2022, the social commerce industry in Africa and the Middle East grew by 70.3%, reaching $8.9 billion. This increase happened as more people switched from traditional online shopping to social media platforms during the pandemic.
- Among platforms like Facebook, Instagram, and TikTok, Facebook has the highest order volume and transactions.
 (Reference: dataprot.net)
- The region is expected to continue growing steadily from 2022 to 2028, with a compound annual growth rate (CAGR) of 55.2%.
- This will raise the gross merchandise value (GMV) from $8.9 billion in 2022 to $13.3 billion by 2028.
- The social commerce market in Asia Pacific is expected to grow by 14.7% each year. This growth is due to changes in shopping habits during the pandemic, which led more consumers to embrace digital shopping.
- The market is projected to reach $489.3 billion in 2023, with a 10.6% CAGR from 2022 to 2028, increasing to $894.8 billion by 2028.
- In Europe, the social commerce industry is predicted to grow steadily by 19%. The rising interest in social shopping, along with quicker checkouts and exclusive products, is driving this trend.
- The social commerce market in Europe is expected to reach $75.2 billion by 2023, growing by 28.2% annually.
- The GMV is forecasted to increase from $75.2 billion in 2023 to $213.9 billion by 2028, as per Social Commerce Statistics.
- North America is the second largest region in terms of the global social commerce market, with 26% of the market accounted for by North American companies. This growth is largely due to more companies using social media to promote their products.
Here’s The Breakdown of The Global Social Commerce Market By Region:
- Asia Pacific: 49%
- North America: 26%
- Europe: 16%
- Middle East and Africa: 6%
- South America: 3%
- Asia Pacific is leading in social commerce growth due to significant investments in telecommunications, widespread internet access, smartphone usage, and heavy social media engagement.
- In comparison, North America has a more fragmented e-commerce and social commerce environment, leading to different consumer attitudes and behaviors that affect online shopping, payment methods, and privacy concerns.
Social Commerce Revenue And Sales Statistics
- The social commerce market is expected to generate $699.4 billion in sales in 2024, which is a 22.6% increase from last year’s total of $570.7 billion.
- This growth is impressive, especially since social media commerce sales were only $81.9 billion in 2018.
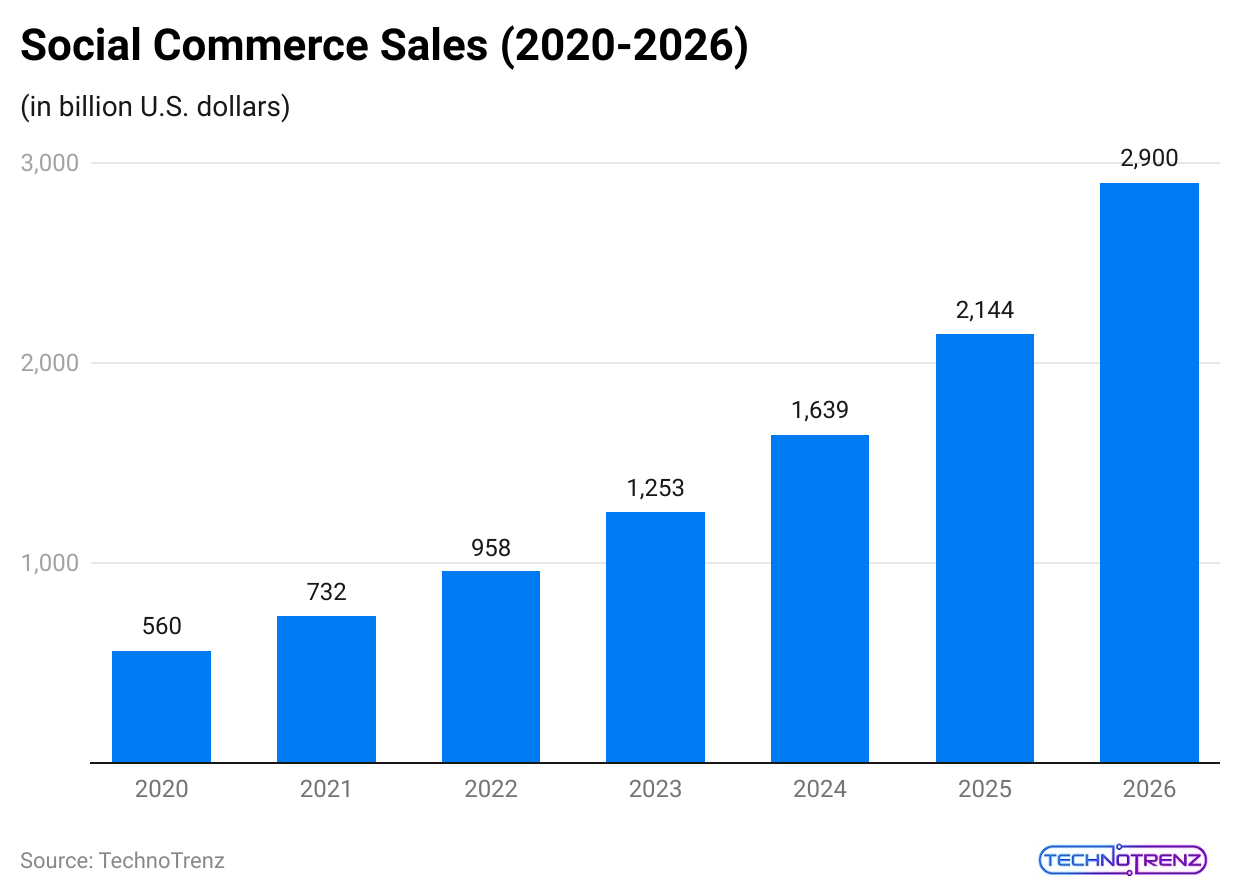 (Reference: tidio.com)
- Experts believe that a major reason for this growth is the consumers in China, which has the largest e-commerce market in the world.
- In 2023, 90% of consumers there made purchases through social media platforms.
- Although social commerce’s growth is expected to continue in the coming years, it will be at a slower rate.
- Sales are forecasted to rise by 17.4% to $821 billion in 2025 and then by 10.7% to $908.5 billion in 2026.
- After that, the growth will slow down to single-digit increases, but it will still push sales over the $1 trillion mark by 2028.
- Predicting the total revenue from social commerce platforms is challenging. Last year, we reported that social commerce generated about $724 billion globally by 2022. It’s expected to surpass $6 trillion by 2030. This fast growth shows a strong and changing market fueled by consumer interaction and new technologies.
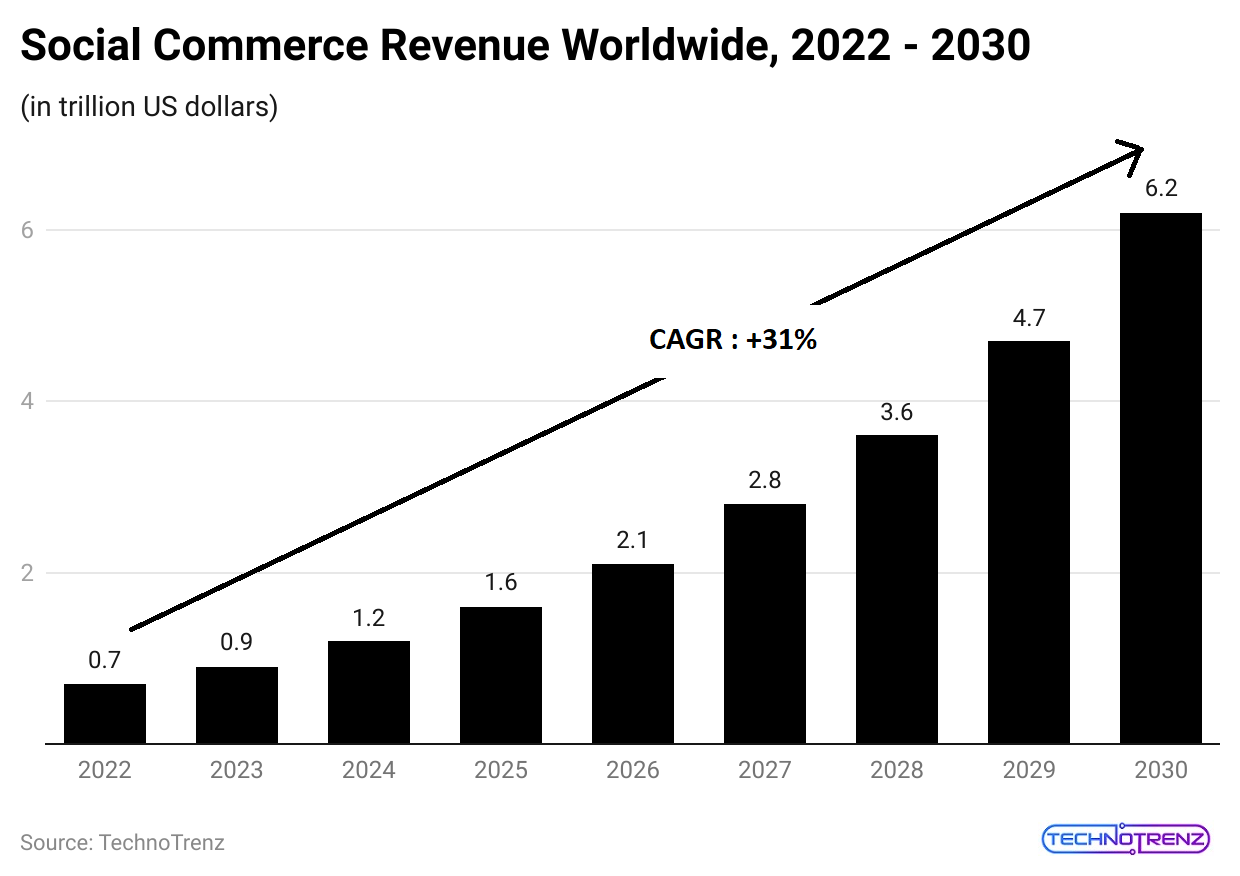 (Reference: ecommercedb.com)
- Other sources predict different numbers for social commerce, suggesting it might reach $1 trillion by 2023 or hit $1.2 trillion by 2025, as per Social Commerce Statistics.
- Even with these varying estimates, social commerce has a lot of potential for the future of eCommerce, especially because more global players are entering the market.
Social Commerce Strategies For 2024
- Use Shoppable Posts
Shoppable posts are essential for social commerce. Use them effectively to showcase your products or services on social media. Please make sure they look good, are well-tagged, and have interesting product descriptions. This will help users easily find, explore, and purchase items.
- Host Live Shopping Events
Live shopping events are a great way to engage with your audience in real-time. Hold live broadcasts to display your products, answer questions, and offer special deals. Interacting directly with viewers creates a sense of urgency and builds community.
- Focus on Personalization
Use data and AI to create personalized shopping experiences. Look at customers’ browsing and purchase history to suggest products that match their interests. Personalization increases user engagement and boosts sales.
- Encourage User-Generated Content (UGC)
User-generated content, like customer reviews and photos, is very powerful in social commerce. Ask customers to share their experiences with your products. Reposting this content helps build trust and authenticity.
- Invest in Influencer Marketing
Collaborate with influencers who fit your brand and target audience. Please encourage them to share honest recommendations and personal experiences with your products.
- Improve Customer Engagement and Service
Good customer service is crucial for success in social commerce. Respond quickly and professionally to customer questions and comments. Provide support after purchases, including easy returns and exchanges.
E-Commerce Statistics
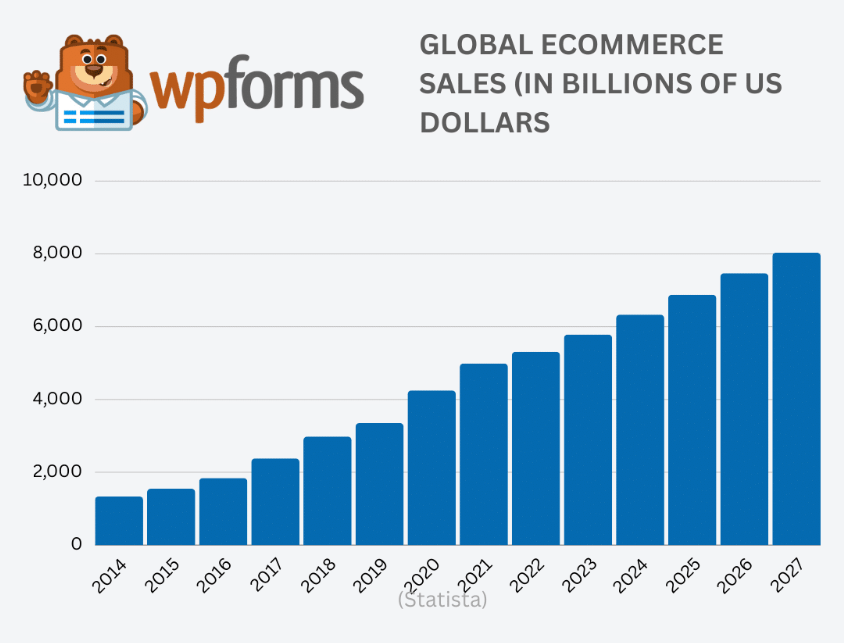 (Source: wpforms.com)
- More than 2.14 billion people are shopping online around the world.
- About 27% of the global population shops online.
- The worldwide eCommerce market is expected to go over $8.1 trillion by 2026.
- Right now, 20% of all retail sales happen online, and this is likely to reach 25% by 2025.
- Amazon is the largest eCommerce website, with over 13% of visits from desktop users—four times more than eBay.
- On Prime Day 2022, Amazon sold over 300 million items globally.
- There are over 12 million online stores around the world.
- Social Commerce Statistics stated that the average conversion rate for eCommerce is 3.65%.
- WooCommerce has more than 42% of the eCommerce platform market share, while Shopify has 11.53%, and Squarespace holds 15.29%.
- The average person spends about $2,310 a year globally.
- Amazon is offering an AI-based tool for real-time product recommendations to sellers using the AWS console.
- Companies that invest in AI see a 10-20% increase in sales returns, as per Social Commerce Statistics.
- By 2040, it’s predicted that 95% of all purchases will be made online, with only 5% happening in physical stores. In 2024, global eCommerce sales are expected to grow by 10.1% each year, while in-store sales will only grow by 2%.
Advantages Of Social Commerce Statistics
In the US, social commerce is projected to reach $79.64 billion by 2025, creating a great opportunity for retail brands to capitalize on this trend. Besides the potential for increased online sales, using social commerce has many other benefits.
- Reach a Larger Target Audience
By 2024, about 5.17 billion people will be using social media, with that number growing to 5.85 billion by 2027. This provides more opportunities to connect with a global audience. Many social media users, especially those aged 18–34, are already shopping on these platforms.
- Create a Smooth Shopping Experience
Features like in-app checkout and “Buy” buttons make shopping on social media easy and convenient. Social commerce reduces extra steps in the buying process, lowering the chances of customers losing interest. For example, instead of directing Facebook users to a website, they can check out directly on the app, making it easier to complete their purchases.
- Collect Data on Your Audience
Social media platforms provide valuable customer data that can help shape future marketing strategies. For instance, Instagram Insights provides information about demographics such as age and location. Facebook Audience Insights offers even more detailed insights into user interests and behaviors. This data helps retailers create targeted ad campaigns that reach the right people, making marketing more effective than traditional e-commerce.
- Utilize Social Proof
About 90% of online shoppers check reviews before buying, as they want to trust a brand first. Social commerce naturally includes social proof through user-generated content like comments and likes. When customers engage with your brand, it builds trust among potential buyers. Brands can encourage this by offering giveaways or discount codes to share their experiences online.
- Get Customer Feedback
Social commerce allows brands to interact directly with their audience, making it easy to gather feedback. This information can help businesses improve their products and services based on customer feedback.
Influencer marketing is effective for building trust and creating social proof. When popular influencers promote your products, it enhances your brand’s credibility. For instance, 87% of YouTube viewers trust the recommendations from creators. Brands can use YouTube Shopping to display products next to their videos, allowing viewers to like, subscribe, and make purchases easily.
- Get Customer Feedback
Social media allows brands to interact directly with customers and gather their opinions. People love sharing their thoughts because it makes them feel appreciated. Brands can use social commerce platforms to run polls, invite comments, and chat through messaging tools.
Conclusion
In conclusion, social commerce in 2023 is strong and full of promise. With more people engaging and significant revenue growth, along with new platforms emerging, it’s clear that social commerce is an important part of the e-commerce industry. As more shoppers turn to social media for ideas and convenience, businesses and marketers need to adjust their strategies and make the most of these platforms to reach their target audiences effectively.
By staying updated on the latest trends and using the insights from this article, companies can set themselves up for success in the fast-changing world of social commerce in the coming years. We have shed enough light on Social Commerce Statistics through this article.
Sources
FAQ.
One major trend is the rise in spending per buyer, which is projected to nearly double from 2023 to 2027, according to a forecast from EMARKETER in October 2023. This increase in spending is expected to be the main driver of sales growth rather than bringing in new buyers.
One of the biggest benefits of social commerce is that it helps you reach a wider audience. By creating a presence on social media and using a social commerce strategy, you can connect with users from all over the world.
Data collected from user activities on social shopping sites can be used to enhance marketing plans and product choices. Businesses can effortlessly reach international markets, connecting with a global customer base.

Saisuman is a professional content writer specializing in health, law, and space-related articles. Her experience includes designing featured articles for websites and newsletters, as well as conducting detailed research for medical professionals and researchers. Passionate about languages since childhood, Saisuman can read, write, and speak in five different languages. Her love for languages and reading inspired her to pursue a career in writing. Saisuman holds a Master's in Business Administration with a focus on Human Resources and has worked in a Human Resources firm for a year. She was previously associated with a French international company. In addition to writing, Saisuman enjoys traveling and singing classical songs in her leisure time.


