Website Load Time Statistics By Screen Region, Website Traffic, Reasons And Impact Of Load Time
Updated · Sep 02, 2024


WHAT WE HAVE ON THIS PAGE
- Introduction
- Editor’s Choice
- What Is The Website Load Time?
- Measuring Page Load Time
- General Website Loading Time Statistics
- Pixel Fixations Statistics By Screen Region
- Website Load Time Affects Customer Loyalty
- Mobile Vs Desktop Average Page Load Times
- Impact Of Web Speed On Business
- Mobile Device Statistics By Website Traffic
- Average Website Load Time Statistics
- Reasons For Slow Website Loading Time Statistics
- The Impact Of Load Time On SEO And User Behavior
- E-commerce Site Speed Statistics
- News Website Statistics Of USA By Social Media Traffic
- How To Improve Website Loading Speed
- Conclusion
Introduction
Website Load Time Statistics: Speed is crucial. A fast-loading website is far better than a slow one. Both users and search engines understand this. Statistics from various studies show that if a webpage takes longer than 3 seconds to load, abandonment rates increase significantly. High bounce rates signal to search engines that visitors don’t find the site useful, which can hurt your ranking.
Moreover, shoppers tend to return to online stores only with performance problems. The idea that “any publicity is good publicity” doesn’t hold up in the digital age. Nearly half of users share their negative experiences with others, spreading the word about slow, unresponsive sites faster than those pages can load. This article will shed more light on Website Load Time Statistics.
Editor’s Choice
- Google says all website pages should load within 3 seconds, and e-commerce pages should load within 2 seconds.
- In reality, average website load times are around 10 seconds on desktop and 27 seconds on mobile (though this can vary by data source).
- The average Time to First Byte (TTFB) is 1.3 seconds on desktop and 2.6 seconds on mobile.
- China has the fastest page loading speeds worldwide, while India and Brazil have some of the slowest.
- 64% of online shoppers who have a bad experience on a site will go to a different store.
- The top factors affecting site speed are total page size, using a Content Delivery Network (CDN), and HTML requests.
- Website Load Time Statistics stated that for the best performance, aim for a page weight of less than 500 KB.
- 70% of customers say that the speed at which a site loads impacts their decision to buy from an online store.
- Speeding up mobile site load time by just 0.1 seconds can increase e-commerce sales by 8.4%.
- Retail websites have the highest average number of pages viewed per session, with 5.01 pages per session on desktop.
- When load times go from 2 to 5 seconds, bounce rates for e-commerce sites jump from 6% to 38%. 73% of marketers think improving site speed is an urgent issue.
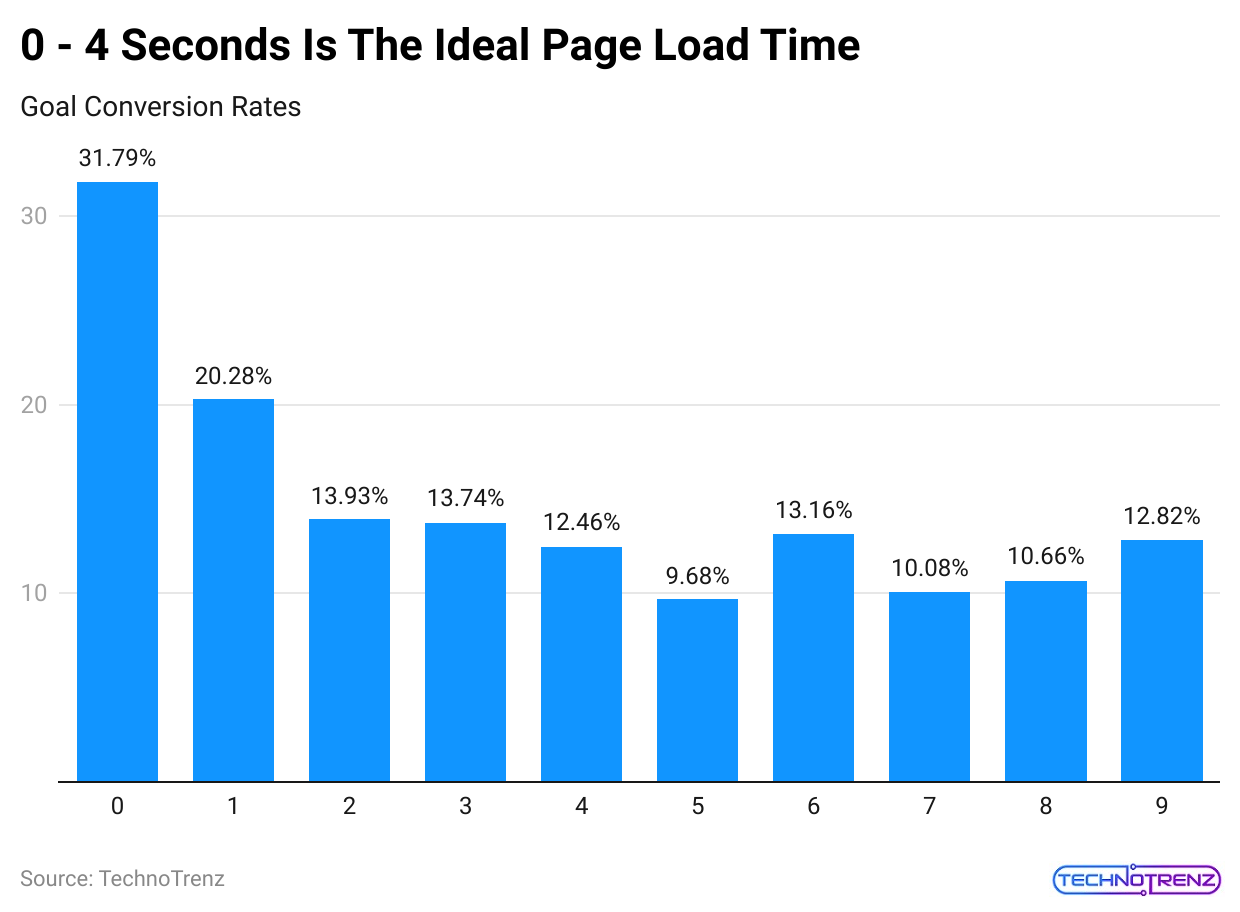
- HubSpot research found that for every second of delay between 0 and 5 seconds, the conversion rate drops by 4.42%.
- The average Time-to-First Byte (TTFB) for desktops is 1.29 seconds, and for mobile devices, it is 2.59 seconds.
What Is The Website Load Time?
Page load time is an important metric for any website. It impacts user experience and customer loyalty and affects how well a site ranks on search engines.
Page load time begins when a visitor makes a request for a webpage and ends when the entire page is fully loaded in their browser. Here’s what happens during this time:
- The visitor’s browser sends a request to your web server.
- The server processes this request and sends a response back to the browser.
- Once the browser receives the page, it processes the code files (such as HTML, CSS, and JavaScript) and displays the page content.
Measuring Page Load Time
There are a few key ways to measure page load time, each considering different aspects of how well a site performs and how users experience it. The most important ones are:
- Round-trip time (RTT): Counted in milliseconds, RTT is the time between when a browser initially sends out a request to when it receives a response. This is crucial because the browser can only start loading the page once it gets a reply from the server. RTT can be affected by how far the visitor is from the server, how busy the server is, and how many other stops the request makes along the way.
(Source: imperva.com)
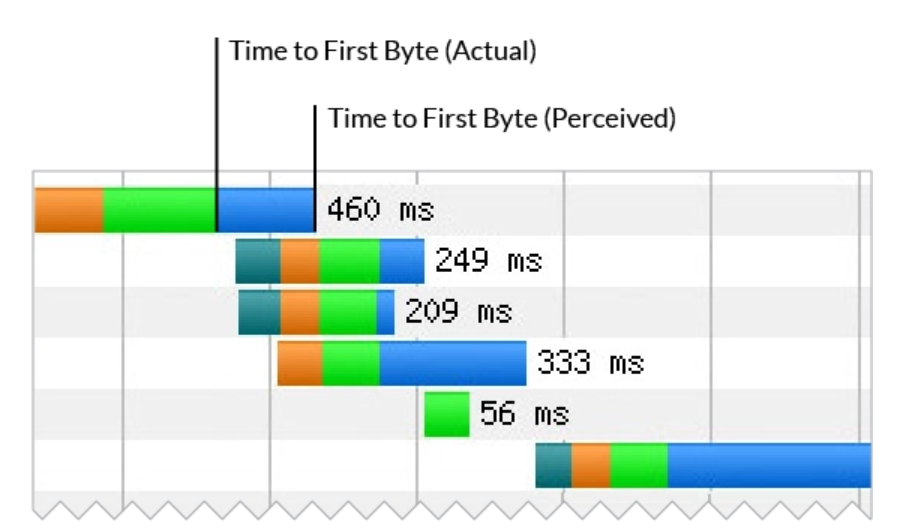
- Time to First Byte (TTFB): TTFB states how long it takes for the browser to get the first byte of data from the server. More precisely, it’s the time until enough of the page’s content loads so the browser can start processing it. Network delays, as well as how long the server takes to respond and how much time it takes to process dynamic content compared to static pages, influence TTFB.
Both page load times and TTFB are important for SEO. Even a small improvement in TTFB can increase the likelihood that visitors will find your site through search engines.
General Website Loading Time Statistics
- The average website takes about 8.6 seconds to load on mobile devices.
- Websites that rank on the first page of Google load in about 1.65 seconds on average.
- Website Load Time Statistics stated that almost 83% of online users expect websites to load in 3 seconds or less.
- 40% of online users will leave a site if it takes more than 3 seconds to load.
- Pages that load in just 1 or 2 seconds have an average bounce rate of 9%, while pages that take 5 seconds have a bounce rate of 38%.
- Nearly 70% of users say that a retailer’s website speed affects their willingness to make a purchase.
- 64% of online shoppers who have a bad experience on a site will go to a different store.
- According to Website Load Time Statistics, half of online users would rather skip animations and videos to get faster load times.
- For each additional second of page load time, conversion rates drop by an average of 2.11%.
- 44% of online shoppers tell others about negative website experiences.
(Source: tooltester.com)
- As page load time increases from 1 second to 3 seconds, the likelihood of users bouncing off the site goes up by 32%.
- The top 10 e-commerce sites in the US load in an average of 1.96 seconds.
- Page load speed is one of the top 20 factors that Google considers for ranking sites.
- 79% of shoppers who experience site performance issues say they won’t return to buy again.
Pixel Fixations Statistics By Screen Region
(Reference: enterpriseappstoday.com)
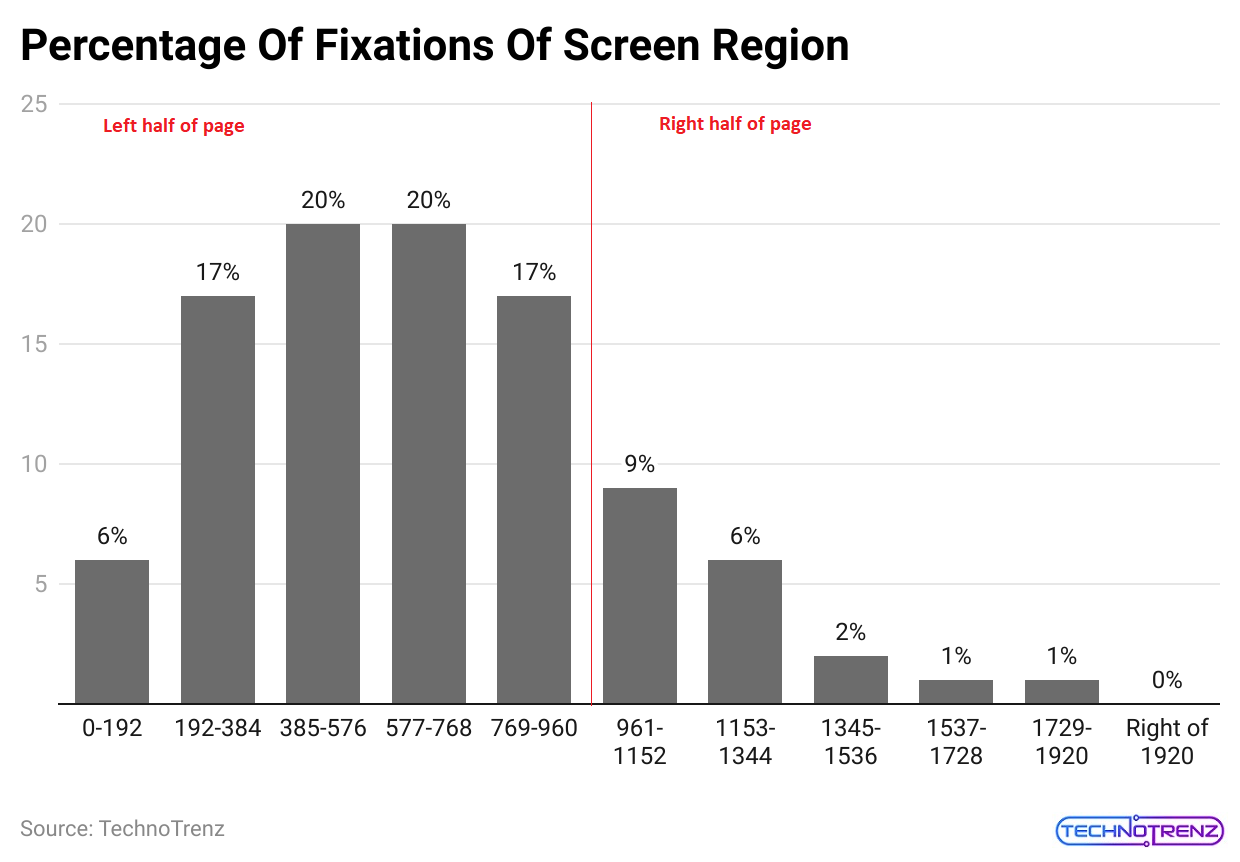
- In 2022, viewers spent 80% of their time looking at the left side of web pages. Here’s how the time was distributed:
On the left side of the page:
- 0-192 pixels covered 6% of the time
- 193-384 pixels covered 17%
- 385-576 pixels covered 20%
- 577-768 pixels covered 20%
- 769-960 pixels covered 17%
On the right side of the page:
- 961-1152 pixels covered 9%
- 1153-1344 pixels covered 6%
- 1345-1536 pixels covered 2%
- 1537-1728 pixels covered 1%
- 1729-1920 pixels covered 1%
Website Load Time Affects Customer Loyalty
- The average loading time for desktop pages is 10.3 seconds. In 2022, desktop pages loaded faster than mobile pages.
- According to Website Load Time Statistics, the average Time-to-First Byte (TTFB) for desktop devices is 1.29 seconds, while on mobile devices, it’s 2.59 seconds.
- For optimal website performance, the number of requests should be less than 50. This is the number of pieces of content a site needs to load.
(Source: databox.com)
- Luxury websites have reduced their loading times by 0.1 seconds. They now load faster, and mobile users are visiting 8% more pages on these sites.
- Google could lose 20% of its traffic for every 100 milliseconds a page takes to load. Faster load times are essential to keep website traffic.
- Website Load Time Statistics show that WordPress sites generally have very fast loading times on mobile devices.
- WordPress focuses on user experience across all devices, so site owners don’t need to do much extra optimization.
- About 25.3% of WordPress websites perform better than average on desktops. WordPress sites are well-optimized for different devices, offering a better-than-average experience on desktops.
- In 2023, the average mobile webpage took 15.3 seconds to load. Google’s survey showed that the typical mobile page took 22 seconds to load.
- Google suggests that compressing images and text on about a quarter of a page can save 250 KB. This could help 10% of websites save up to 1 MB or more, significantly speeding up loading times.
Mobile Vs Desktop Average Page Load Times
An analysis of 5 million desktop and mobile pages showed that:
- On average, it takes 10.3 seconds to fully load a webpage on a desktop.
- Website Load Time Statistics stated that on mobile devices, a page takes 27.3 seconds to load fully.
In comparison, the top 100 websites load much faster:
- On desktop, they average 2.5 seconds.
- On mobile, they average 8.6 seconds.
- This significant difference means that visitors to these top websites experience much faster load times.
- Optimizing your mobile page speed is still crucial, as mobile browsing remains very popular, according to Website Load Time Statistics.
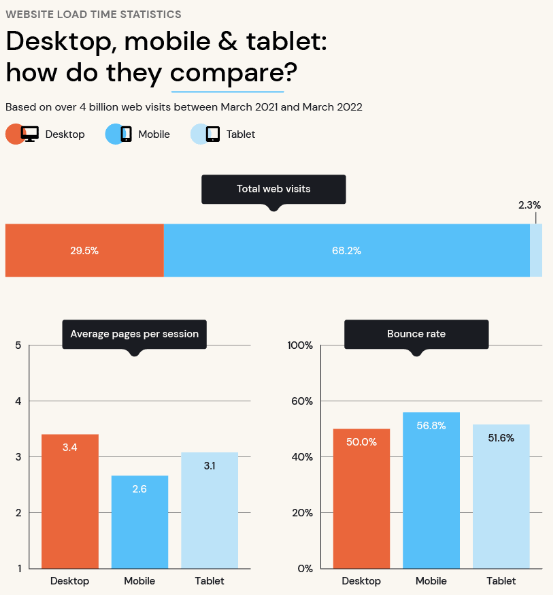
- As of August 2023, mobile devices accounted for 79% of online time in the United States.
(Source: websitebuilderexpert.com)
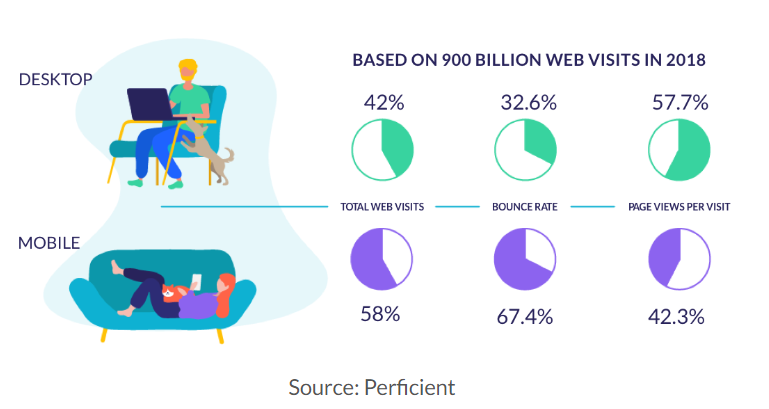
In a 2018 study of web traffic in the US:
- Mobile devices were responsible for 58% of website visits.
- They accounted for 42.3% of the total online time.
- Although more people use smartphones for browsing compared to desktops, desktops still offer a better user experience.
- 46% of people say their biggest frustration with browsing the web on mobile is waiting for pages to load.
- Additionally, according to Website Load Time Statistics, 73% of mobile users have encountered websites that take too long to load.
- Research by Google Consumer Insights found that over half (53%) of mobile visitors will leave a page if it takes more than 3 seconds to load.
Most people think they’re more patient than they are when it comes to waiting for pages to load.
- 85% of mobile users expect pages to load as quickly as or faster than they do on desktops.
- A study of UK consumers found that 14% of shoppers expect pages to load instantly on mobile.
For a more realistic target:
- 64% of smartphone users want pages to load in under 4 seconds, as per Website Load Time Statistics.
- 74% of mobile users in the US will leave a site if it doesn’t load within 5 seconds.
- It’s crucial to keep your website’s load time fast, as each additional second of delay lowers user satisfaction by 16%.
60% of mobile internet users have experienced at least one problem while browsing in the past year. Here’s a breakdown of the issues they’ve faced:
- 73%** encountered a website that was too slow to load.
- 51% faced sites that crashed, froze, or showed errors.
- 48% needed help with sites that were hard to read.
- 45% found websites that didn’t work as expected.
- 38% came across sites that were out of stock.
(Source: databox.com)
- To address these issues, some site owners use Accelerated Mobile Pages (AMP). AMP is a project developed by Google and Twitter that is designed to make mobile pages load much faster by using a simplified version of HTML.
- AMP pages are intended to load so quickly that they seem almost instant. This can help meet user expectations for speed. However, 32% of marketers avoid using AMP because they lack the developer resources needed to implement it.
- 55% of all time spent on retail websites happens on mobile devices. However, some industries use mobile devices more than others:
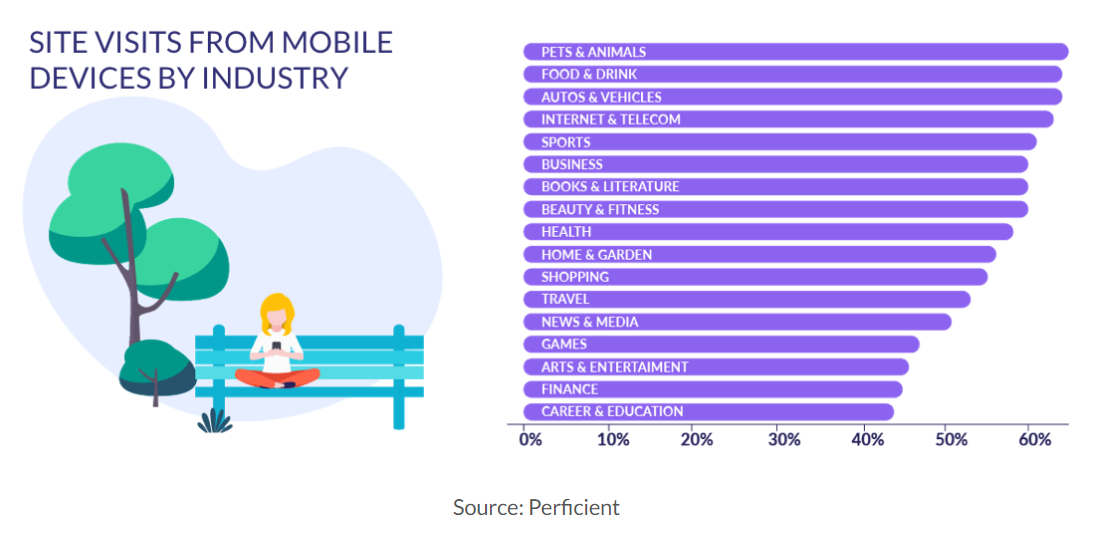
(Source: websitebuilderexpert.com)
- For every 17 industries as above, the bounce rate was already less on desktop than on mobile:
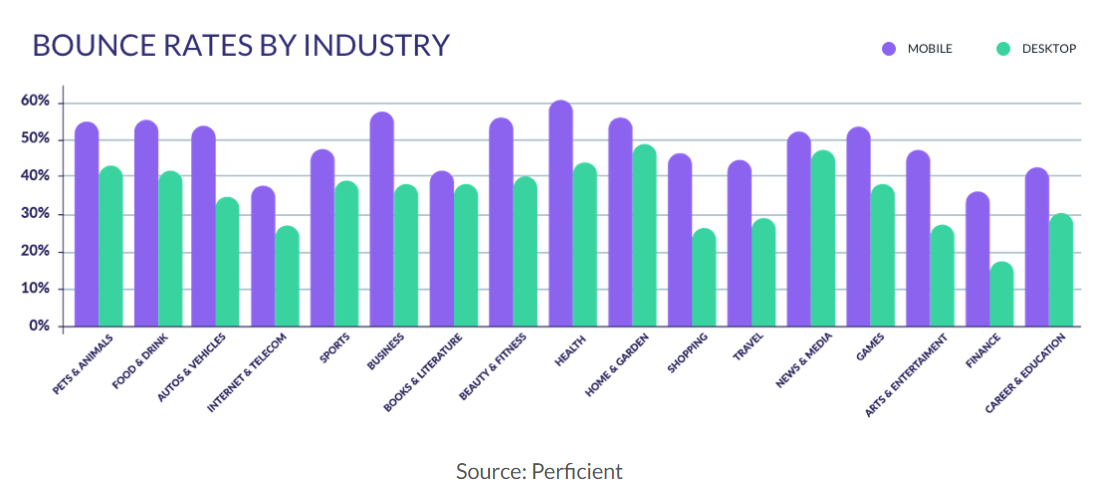
(Reference: websitebuilderexpert.com)
- In every industry, people spend more time on websites using desktops than on mobile devices, except for the books and literature industry.
- This is likely because many people use mobile reading devices for books, as per Website Load Time Statistics.
Impact Of Web Speed On Business
- Many people have websites for hobbies or non-profit activities. However, most websites are created to support a new business. As mentioned earlier, if a website loads slowly, it can hurt a business’s success.
Website Load Time Statistics show just how damaging slow load times can be. Unfortunately, many businesses with slow websites don’t address these issues. Here’s a look at some important statistics on how web speed affects businesses:
79% of Dissatisfied Customers Won’t Return
- If customers are happy with how a site performs, they are likely to come back.
- According to the Website Builder Report, 79% of users who have a bad experience on a site are unlikely to return.
- Of these, 64% will go to a different online store to buy the same product or find the same information.
- Additionally, 18% of online shoppers will only abandon their cart if the website loads quickly.
- Poor load times are also the main reason for cart abandonment for 51% of American internet shoppers, according to Website Load Time Statistics.
Conversion Rate Drops by 4.42% for Every Second of Delay.
- According to Website Load Time Statistics, slow load times have a direct effect on how well businesses convert visitors into customers.
- HubSpot research found that for every second of delay between 0 and 5 seconds, the conversion rate drops by 4.42%.
- Improving site speed, even by just 0.1 seconds, can significantly boost sales. For example:
- Average order value increased by 9.2%.
- Luxury brand page views per session rose by 8.6%.
- Retail conversions grew by 8.4%.
70% of Users Say Speed Affects Their Willingness to Buy
- About 70% of online shoppers say that the speed at which a website loads affects their decision to stay on the site or make a purchase.
- No one wants to waste time or money on a slow website.
- Faster-loading sites provide a better user experience and encourage people to buy more.
86% of B2C Websites Load in 5 Seconds or Less
- To catch users’ attention, websites should load quickly, ideally within the first two seconds.
- If not, the next best target is within five seconds. A 2020 report by Portent showed that 86% of B2C (business-to-consumer) websites now load within five seconds, up from 81% the previous year.
- B2B (business-to-business) sites showed no improvement, with 82% loading within five seconds.
E-commerce Brands Lose $18 Billion Annually Due to Abandoned Carts
- Online stores lose around $18 billion each year because shoppers abandon their carts before completing purchases.
- A major reason for this is slow page loading.
- To prevent this, make your checkout process simpler and ensure your website loads quickly.
- This can help keep visitors from leaving frustrated and complaining.
Mobile Device Statistics By Website Traffic
(Reference: enterpriseappstoday.com)
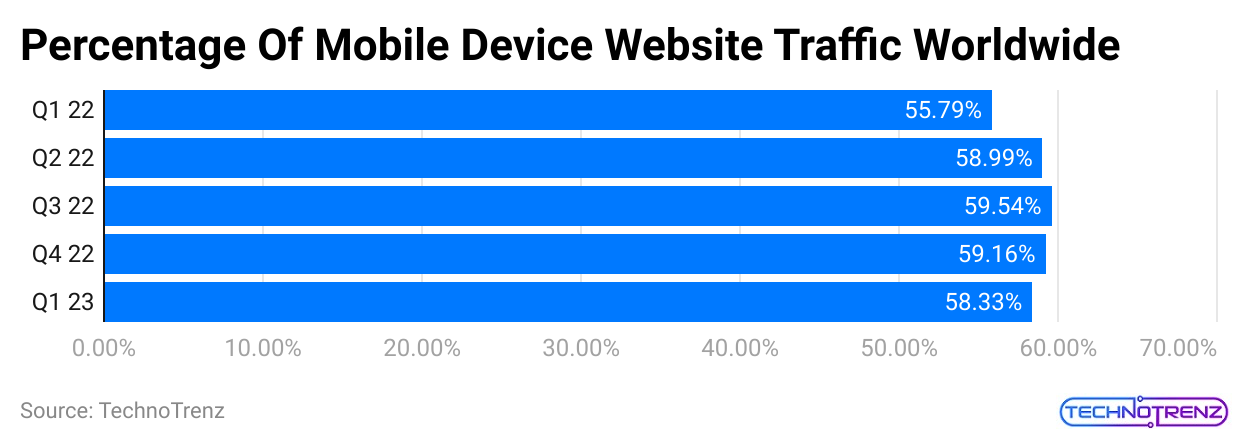
In 2022, mobile devices accounted for the following percentages of global website traffic:
- 1st Quarter: 55.79%
- 2nd Quarter: 58.99%
- 3rd Quarter: 59.54%
- 4th Quarter: 59.16%
- However, according to Website Load Time Statistics, mobile traffic dropped slightly to 58.33% in the First quarter of 2023.
By 2023, mobile device usage for accessing websites increased in North America, reaching 51.2% of web traffic. Here are the top numbers of website visitors for major platforms:
- Instagram: 6.18 billion
- YouTube: 33 billion
- Facebook: 17.8 billion
- Twitter: 6.8 billion
- Google: 85.1 billion
- Facebook: 17.8 billion
Average Website Load Time Statistics
(Reference: techreport.com)
- Google says that compressing images and text on about a quarter of a page could save 250 KB. This method helps 10% of website pages save up to 1 MB or more, which significantly speeds up loading times.
- Google could lose 20% of its traffic for every 100 milliseconds a page takes to load. So, faster load times are crucial for maintaining website traffic.
- WordPress has some of the fastest page loading times on mobile devices. Its focus on user experience across all devices means website owners don’t need to worry much about optimization.
- Luxury websites have cut their loading times by 0.1 seconds. They now load faster, and the number of pages viewed on these sites via mobile devices has increased by 8%.
- In 2021, the average mobile webpage took 15.3 seconds to load. However, a Google survey showed that the average mobile page took 22 seconds to load.
- The average loading time for desktop pages is 10.3 seconds. In 2021, desktop pages loaded faster than mobile pages.
- The average Time-to-First Byte (TTFB) for desktops is 1.29 seconds, and for mobile devices, it is 2.59 seconds.
- The ideal number of requests for a website to load efficiently is fewer than 50. This refers to the number of pieces of content a site needs to display as per Website Load Time Statistics.
- About 25.3% of WordPress websites perform better than average on desktops. WordPress sites are highly optimized for various devices, providing a better-than-average experience on desktops.
Reasons For Slow Website Loading Time Statistics
Now that you know what an ideal average page load time should be and how to check your own, let’s look at some common reasons why a website might load slowly.
Unoptimized Images
- Large or high-resolution images can make your web page take longer to load.
- This issue happens with any website builder or content management system (CMS).
- Also, using image formats like JPEG instead of PNG or GIF can help because JPEGs are usually smaller.
Problems with JavaScript
- JavaScript makes your website interactive, but if it is not set up properly, it can slow down page load time.
- Each time a page loads, the browser must load the JavaScript files first.
- If you have too many API calls, it might cause “render-blocking JavaScript.”
- Regularly checking your JavaScript scripts can help you find and remove unnecessary parts.
Flash Content Overload
- Flash can make websites interactive but often slows down page loading because Flash files are usually large.
- To avoid this, try to reduce or remove Flash content. Consider using HTML5 alternatives for better performance.
Ignoring Caching Techniques
- Website Load Time Statistics stated that caching helps speed up your website by storing frequently used data so that when a new user requests the same content, it loads faster from the cache.
- If you still need to set up caching, you’re missing out on a simple way to improve load times.
Poorly Written Code
- Bad coding practices, such as too much white space, empty lines, or irrelevant comments, can increase your page’s stylesheet size and slow downloading.
- Cleaning up and compressing your code can speed things up and improve your search rankings. For best results, consider hiring a professional.
Too Many Ads
- While ads can help you make money, too many ads can hurt user experience and slow down your page.
- Lots of ads mean more HTTP requests, which makes the page take longer to process.
- This is especially true for interstitials, auto-downloading ads, pop-ups, and other rich media ads, which can generate thousands of HTTP requests.
The Impact Of Load Time On SEO And User Behavior
- Core Web Vitals are important for Google search rankings, but improving them doesn’t guarantee a higher ranking on its own. They are just one of many factors Google uses to assess a page’s overall quality.
- Generally, web pages that rank higher in search results tend to have lower Largest Contentful Paint (LCP) times. For example, the average LCP for the top spot on Google search results is 2.13 seconds.
- Website Load Time Statistics stated that the LCP for the 10th spot is 2.18 seconds, and for the 20th spot, it is 2.2 seconds.
- The differences are small, and all top 20 positions meet the ‘good’ LCP standard of 2.5 seconds. You can track your rankings using tools from our SEO rank monitoring guide.
(Reference: wordstream.com)
- More websites are meeting Core Web Vitals standards. In 2022, 39% of websites met these standards, and this had increased to 50.5% by 2024.
- According to Website Load Time Statistics, the average page load time for a page that appears on the first page of Google search results is 1.65 seconds.
- Slow websites tend to rank 3.7 percentage points lower on average than fast sites. A site is considered ‘slow’ if it doesn’t meet the standard in any Core Web Vital.
- On average, people spend 5 minutes and 57 seconds each day waiting for websites to load, which is about 1.5 days a year.
- When a website meets Core Web Vitals standards, visitors are 24% less likely to leave during the loading process.
- Website Load Time Statistics stated that about 46% of people will leave a website if it takes more than 4 seconds to load on a mobile phone.
- If a mobile site loads in just 1 second, only 7% of visitors leave. This number almost doubles to 13% if the load time is 2 seconds.
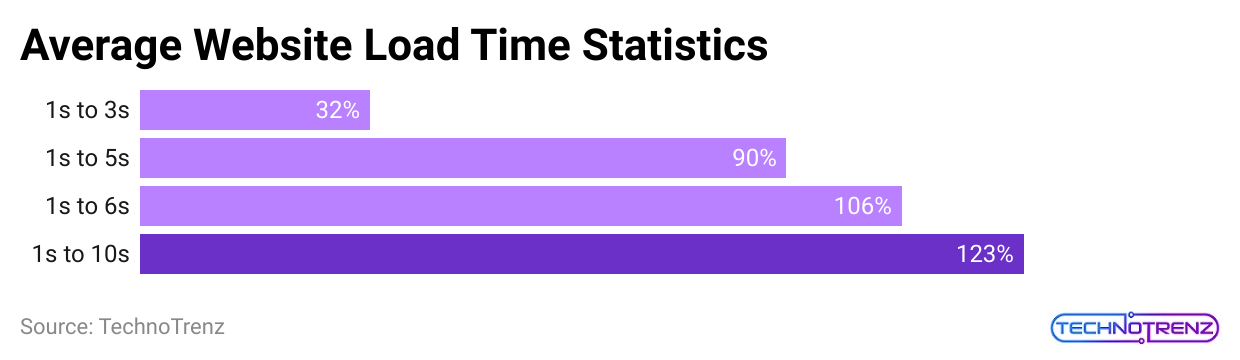
- The chance of abandonment increases by 32% for pages that load between 1 and 3 seconds and by 90% for pages that load between 1 and 5 seconds.
- Check out our landing page stats to learn about average conversion rates and find the best landing page builders to create high-converting pages.
- About 45% of people say they are less likely to buy from a slow-loading e-commerce site, and 37% are less likely to return to a slow site as per Website Load Time Statistics.
- If you want to build a fast e-commerce store, you can explore the best e-commerce platforms to find the right one for you.
E-commerce Site Speed Statistics
- Reducing your page load time by 1 second can increase your conversion rate by 5.6%.
- A site that loads in 1 second has a conversion rate that is five times higher than a site that takes 10 seconds to load.
- Website Load Time Statistics stated that around 40% of shoppers will leave an e-commerce site if it takes more than 3 seconds to load.
- 80% of users find a slow-loading site more frustrating than a site that is temporarily down.
- Stress levels rise by 33% if content takes more than 6 seconds to load, which is as stressful as a math test or watching a horror movie.
- Nearly 70% of consumers say page speed affects their decision to buy from an online store.
- 50% of online users would rather skip animations and videos for faster load times.
- Sites on the first page of Google search results load in an average of 1.96 seconds. Faster speeds can improve your Google ranking.
- According to Website Load Time Statistics, 83% of people expect websites to load in 3 seconds or less.
- 73% of consumers would likely switch to a different site if the one they’re on is too slow.
(Reference: queue-it.com)
Effects of Slow E-commerce Pages
- 50% of shoppers will try to refresh a page that loads slowly.
- 22% will close the tab.
- 14% will visit a competitor’s site.
- 64% of online shoppers will only look elsewhere if they have a good experience.
- 44% share negative experiences with others.
- 33% of consumers will stop buying from a brand they like after just one bad experience.
- 65% of consumers trust a business less if they have a problem.
- Website Load Time Statistics stated that A 1-second reduction in load time boosts conversion rates by 5.6%.
- A site that loads in 1 second has a conversion rate five times higher than a site that loads in 10 seconds.
- 4% of shoppers are less likely to purchase due to slow loading times.
- 8% of shoppers are less likely to return to a slow-loading site, as per Website Load Time Statistics.
- 9% of shoppers are likely to recommend a site based on its speed.
Let’s say your e-commerce site gets 50,000 visitors a day, has a conversion rate of 3.5%, and the average order value is $50. If your average page load time is 6 seconds:
- You make 1,750 orders per day.
- Your daily revenue is $87,500.
Now, if you improve your page load time by just 1 second, your conversion rate increases to 3.7%:
- You’ll get 1,850 orders per day.
- Your daily revenue rises to $92,500.
- For a year, this 1-second improvement could boost your revenue by $1.8 million.
- If you reduce your page load time to Google’s recommended 3 seconds, you could see an additional $5.5 million in revenue over a year.
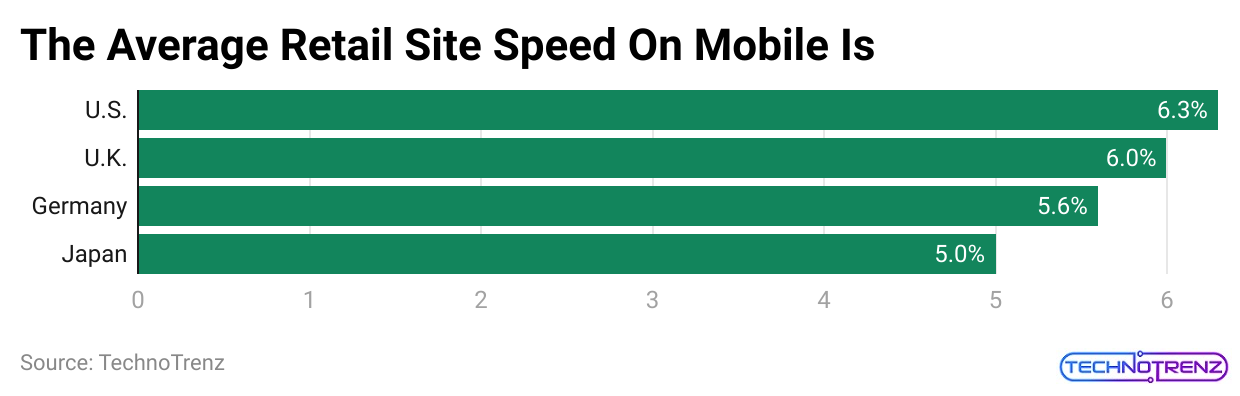
- Google recommends that mobile pages load within 3 seconds for optimal performance.
- In the US, retail sites average a 6.3-second load time on mobile, which is more than twice Google’s recommended benchmark.
- In the UK, e-commerce sites load faster at an average of 6 seconds.
(Reference: queue-it.com)
- 86% of e-commerce sites load in 5 seconds or less on desktop computers.
- The average load time for the top 100 websites worldwide on desktop is 2.5 seconds.
- On mobile devices, these top 100 sites take an average of 8.6 seconds to load.
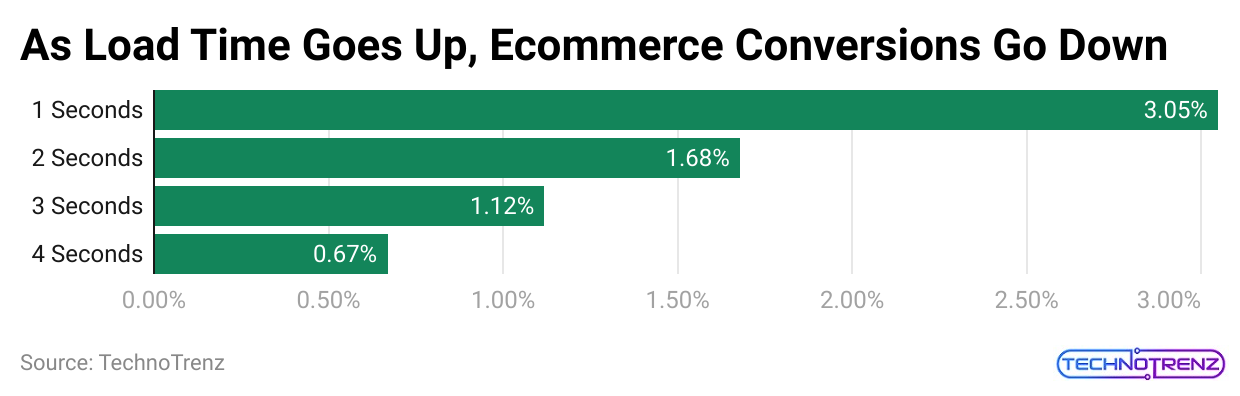
- The best e-commerce conversion rates, averaging 3.05%, are found on pages that load in 1 or 2 seconds.
- An average product detail page (PDP) without optimization takes 6.1 seconds to load.
- Optimized PDPs load 2 seconds faster than unoptimized ones, averaging 4.1 seconds.
- PDPs and category pages account for 72% of all page views during a shopping journey.
- Retail websites have the highest average number of pages viewed per session, with 5.01 pages per desktop session.
- Website Load Time Statistics stated that the optimized sites save buyers 23 seconds per shopping journey.
News Website Statistics Of USA By Social Media Traffic
CNN (us.cnn.com)
- Facebook: 34.7 million followers.
- Twitter: 61.5 million followers
- Instagram: 10 million followers
- Posting Rate: 5 posts per quarter
The New York Times (nytimes.com)
- Facebook: 18.2 million followers
- Twitter: 55.1 million followers
- Posting Rate: 21 posts per day
The Huffington Post (huffpost.com)
- Facebook: 12 million followers
- Instagram: 2.4 million followers
- Posting Rate: 19 posts per day
Fox News (foxnews.com)
- Facebook: 19.1 million followers
- Twitter: 23.9 million followers
- Instagram: 4.3 million followers
- Posting Rate: 30 posts per day
USA Today (usatoday.com)
- Facebook: 8.5 million followers
- Twitter: 5 million followers
- Instagram: 1.6 million followers
- Posting Rate: 11 posts per day
Politico (politico.com)
- Facebook: 2 million followers
- Twitter: 4.6 million followers
- Instagram: 1.9 million followers
- Posting Rate: 14 posts per day
How To Improve Website Loading Speed
- Enable Text Compression – Use tools like GZIP, Deflate, or Brotli to compress text-based files on your site. This reduces the size of files and data, making your pages load faster.
- Reduce Unused CSS – Trim down unnecessary CSS files and remove any unused CSS rules. This reduces the amount of data your site needs to load, speeding up your page.
- Minimize Unused JavaScript—JavaScript can slow down your site, so remove unnecessary code. This will reduce the amount of data being loaded and improve performance.
- Eliminate Render-Blocking Resources—Render-blocking resources, like certain JavaScript, CSS, and HTML imports, can delay the speed at which your page appears. Removing or deferring these resources can speed up the initial page load time.
- Optimize Images – Images can slow down your site, so make sure to set the width and height for each image to avoid layout shifts. Resize and compress images without losing quality, and use modern formats like WebP or AVIF for better compression.
- Enable Caching – Caching saves some web elements on users’ browsers, which means they don’t need to be reloaded every time they visit your site. This speeds up the loading time and improves the user experience.
- Avoid Large Network Payloads—Reduce the amount of data that needs to be transferred between your server and the user’s browser. This lowers expenses and speeds up page load times.
- Use a Content Delivery Network (CDN) – A CDN uses a network of servers to deliver web content based on a user’s location. This speeds up the load time by reducing the distance data has to travel.
- Switch to a High-Performance Server – If your server is slow, consider upgrading to a better one. A faster server can handle more visitors and improve your site’s loading speed.
- Reduce and Optimize Redirects – Optimize redirects by ensuring they are free of errors and work correctly. Remove unnecessary redirects to improve your page load speed.
Conclusion
From the above article on Website Load Time Statistics, it’s clear that having a well-designed and organized website can attract more users. Websites are crucial for any business as they help establish credibility. The key to making a website successful includes focusing on user preferences and following web designer recommendations.
This article provides important global statistics that highlight why having a good website is so important.
Sources
FAQ.
The ideal load time for mobile websites is 1-2 seconds. If a page takes longer than 3 seconds to load, 53% of mobile visitors will likely leave the site. With a 2-second delay, abandonment rates can reach up to 87%. Google aims for load times of under half a second.
Website speed, or performance, is how quickly a browser can fully load web pages from a site. If a site loads slowly, it can drive visitors away. On the other hand, sites that load quickly usually get more traffic and have better conversion rates.
Page speed definitely impacts SEO. It’s a direct ranking factor, especially since Google’s Algorithm Speed Update. Slow pages can hurt your rankings in two ways: they lead to higher bounce rates and lower time spent on your site.

Saisuman is a professional content writer specializing in health, law, and space-related articles. Her experience includes designing featured articles for websites and newsletters, as well as conducting detailed research for medical professionals and researchers. Passionate about languages since childhood, Saisuman can read, write, and speak in five different languages. Her love for languages and reading inspired her to pursue a career in writing. Saisuman holds a Master's in Business Administration with a focus on Human Resources and has worked in a Human Resources firm for a year. She was previously associated with a French international company. In addition to writing, Saisuman enjoys traveling and singing classical songs in her leisure time.