
YouTube Channel Statistics By Creators, Popular Channels, Demographics, Revenue, Marketing and Advertising
Updated · Sep 04, 2024


WHAT WE HAVE ON THIS PAGE
- Introduction
- Editor’s Choice
- What is CPM, And How is It Calculated?
- Top 10 Richest YouTubers In 2023
- General YouTube Statistics
- YouTube Creators Statistics
- Most Popular YouTube Channels Statistics
- YouTube Demographics
- YouTube Revenue Statistics
- YouTube Marketing And Advertising Statistics
- Sponsored Content Types By Platform
- YouTube T.V., Music And Content Statistics
- Popular Made-For-Children Channels By Subscribers
- Conclusion
Introduction
YouTube Channel Statistics: YouTube is the top video-sharing site, where millions of people upload, watch, and interact with videos every day. Since its launch in 2005, it has become a place for everything from how-to guides and news to entertainment and personal stories. With such a broad selection of videos, there’s always something to match every interest. YouTube is user-friendly and encourages both creators and viewers to be involved.
It offers features like live streaming, comments, and personalized suggestions, making it easy to connect with others and keep up with topics you care about. It’s a global community where people can share, learn, and engage with content. We shall shed more light on YouTube Channel Statistics through this article.
Editor’s Choice
- YouTube T.V. had more than 6.10 million subscribers as of January 2024, which is higher than the projected 6.5 million for December 2023.
- By February 1, 2024, YouTube had over 99 million paid subscribers, including those on free trials. In the U.S., there were almost 70 million paid users by the end of 2023.
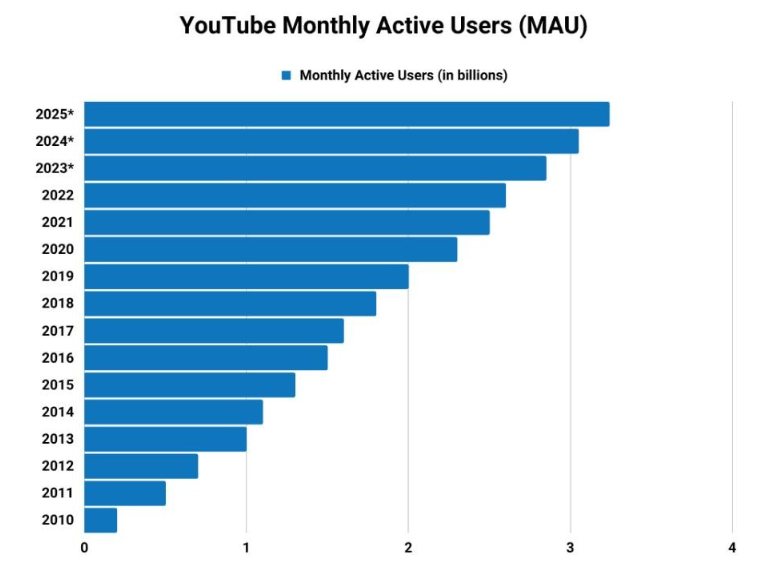
- By January 2024, YouTube had 2.7 billion active users monthly, according to YouTube Channel Statistics.
- Worldwide, people visit YouTube every 30 minutes and 40 seconds, watching videos for almost 30 minutes every visit. If users log in daily, they spend 15 hours per month and 182 hours and 30 minutes per year on the site.
- Till 2023, about 999 hours of video were uploaded every minute, which equals 50,000 hours every hour.
- As of March 2024, ChuChu TV Nursery Rhymes & Kids Songs is the top kids’ channel with around 70.3 million subscribers.
- With over 260 million subscribers, MrBeast is the most-subscribed YouTube channel in 2024.
- 65% of Google Preferred ads on YouTube saw a boost in brand awareness, with an average increase of 17%.
- In 2023, YouTube Shorts received over 50 billion views each day.
- Baby Shark Dance” is the most-watched video on YouTube, with over 13 billion views, followed by “Despacito” at 8.3 billion views.
What is CPM, And How is It Calculated?
CPM, or cost per 1,000 impressions, is the amount an advertiser pays on YouTube for every 1,000 times their ad is shown on your video. CPM can vary based on how much the advertiser bids, the type of ad, and how consistently the ad runs.
To calculate CPM, divide the total amount paid by the advertiser by the number of views the video has. Then, multiply that number by 1,000. For example, if an advertiser pays $9 for an ad that’s shown 5,000 times, you’d divide $9 by 5,000 to get $0.0018, then multiply by 1,000. This gives you a CPM of $1.80. YouTube keeps 45% of this amount, so you’d receive 55% of $1.80, which is $0.99.
There is also playback-based CPM. Instead of calculating the cost for 1,000 impressions, it calculates the cost for 1,000 video playbacks where the ad is shown.
If you want to avoid calculating CPM yourself, there are free online calculators available. Even though individual video CPMs might seem small (like $0.99), they can add up to a significant amount over time if many businesses use your videos for their ads.
Top 10 Richest YouTubers In 2023
| # | YouTuber | Channel | Subs | Est. Net Worth | Est. 2023 Income |
|
10 |
Mark Edward Fischbach | Markiplier
|
35.9 million | $35–45 million* | $30 million |
| 9 | Richard Tyler Blevins | Ninja
|
23.8 million | $40 million |
$10 million |
|
8 |
Felix Kjellberg | PewDiePie
|
111.0 million | $40 million | $7 million |
| 7 | Jake Paul | Logan Paul | 20.5 million | $60–80 million |
$34 million |
|
6 |
Logan Paul | Logan Paul | 23.6 million | $75 million | $21 million* |
| 5 | Vladislav and Nikita Vashketov | Vlad and Niki
|
105 million | $90–130 million* |
$45–60 million* |
|
4 |
Ryan Kaji | Ryan’s World | 35.9 million | $100 million | $35 million |
| 3 | Anastasia Radzinskaya | Like Nastya
|
110.0 million | $20–160 million* |
$22 million |
|
2 |
Jeffree Star | Jeffree star | 15.8 million | $200 million | $16–20 million* |
| 1 | Jimmy Donaldson | MrBeast
|
215 million | $100–500 million** |
$82 million |
- As of 2023, the top-earning YouTubers are Jimmy Donaldson, Jeffree Star, and Anastasia Radzinskaya.
- Jimmy Donaldson, who runs the MrBeast channel, is estimated to make $82 million. Jeffree Star, known for his Jeffree Star channel, earns between $16 million and $20 million.
- Anastasia Radzinskaya, who is known as Like Nastya, has an estimated income of $22 million.
General YouTube Statistics
- YouTube has over 2.70 billion active monthly viewers.
- There are over 800 million videos on YouTube.
- In 2023, YouTube is expected to be the second-largest social media platform in the world.
- About 87.7% of all YouTube views come from mobile devices.
- Over 450 million hours of viewing happen on Smart T.V.s as per YouTube Channel Statistics.
- In the Netherlands, 94.9% of people use YouTube.
- Globally, 37.6% of people use YouTube. YouTube Shorts was introduced in 2020.
- There are more male users on YouTube than female users.
- The largest age group on YouTube is 25 to 34 years old.
(Source: linkedin.com)
- In 2023, YouTube Shorts received over 50 billion views each day.
- The maximum length for a YouTube Short is 15 seconds.
- About 72% of YouTube Shorts are longer than 15 seconds.
- Jeffree Star is currently the highest-earning YouTuber.
- The YouTube channel with the most followers is T-Series.
- YouTube Channel Statistics stated that YouTube has over 114 million active channels.
- Around 66% of people plan to use YouTube more in the future.
- About 30% of people need help finding and connecting with their target audience.
- Only 9% of small businesses in the U.S. use YouTube.
- Each month, more than 50% of mobile internet users visit YouTube.
- YouTube Channel Statistics stated that over 25% of the global population checks YouTube at least once a month.
- About 52% of people who use the internet worldwide go to YouTube every month.
- YouTube Premium costs $13.99 and offers extra features.
(Reference: zippia.com)
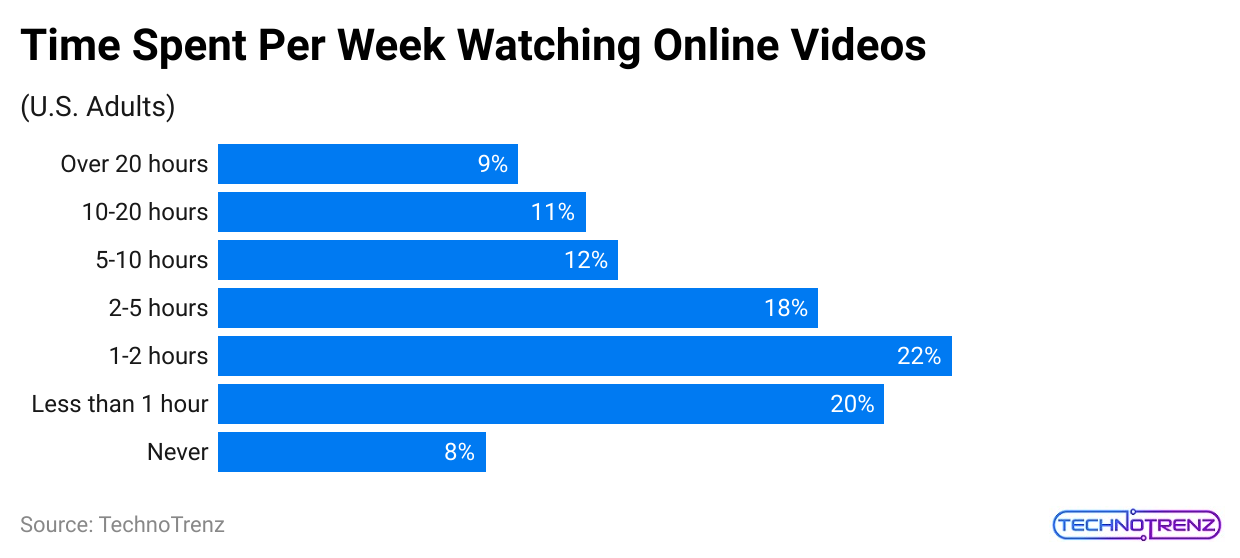
| Time | % |
|
Over 20 hours |
9% |
| 10-20 hours |
11% |
|
5-10 hours |
12% |
| 2-5 hours |
18% |
|
1-2 hours |
22% |
| Less than 1 hour |
20% |
|
Never |
8% |
- In 2023, YouTube Premium had 80 million subscribers.
- The U.S. makes the most money from YouTube in-app purchases (IAP).
- In the U.S., 62% of people use YouTube every day.
- More than 122 million users access YouTube daily through its app and website.
- People upload up to 500 hours of content every minute on YouTube.
- YouTube Channel Statistics stated that YouTube users watch 1 billion hours of videos each day.
- In 2023, YouTube earned $28.8 billion.
- YouTube’s revenue has grown by over 30% in the past four years.
- In the first half of 2023, YouTube made over $14.3 billion.
- People in India use YouTube more than in any other country.
- The U.S. has the second-largest number of YouTubers, according to YouTube Channel Statistics.
- On average, users spend about 20 to 30 minutes a day on YouTube.
YouTube Creators Statistics
- YouTube Creator Statistics show that there are about 15 million active creators on the platform who upload 500 hours of content every minute.
- 83% of YouTube creators with monetized channels say the platform helps them earn money and create content.
- In the United States, 74% of monetized creators say YouTube has positively impacted their professional goals.
- For 69% of YouTube content creators, the income from the platform is an important part of their earnings.
- One in three YouTubers in the U.S. considers YouTube their main source of income.
- According to YouTube Channel Statistics, around 200,000 creators and partners hire other people to manage or work on their YouTube channels.
- Most YouTube creators buy filming equipment and editing software to run their channels.
- As of 2023, 83% of content creators in the U.S. with physical stores said YouTube helped them grow their local businesses.
- Additionally, 78% of businesses believe YouTube is crucial for business growth.
- In 2023, 83% of female YouTubers said YouTube helped them share their ideas and passions.
(Reference: enterpriseappstoday.com)
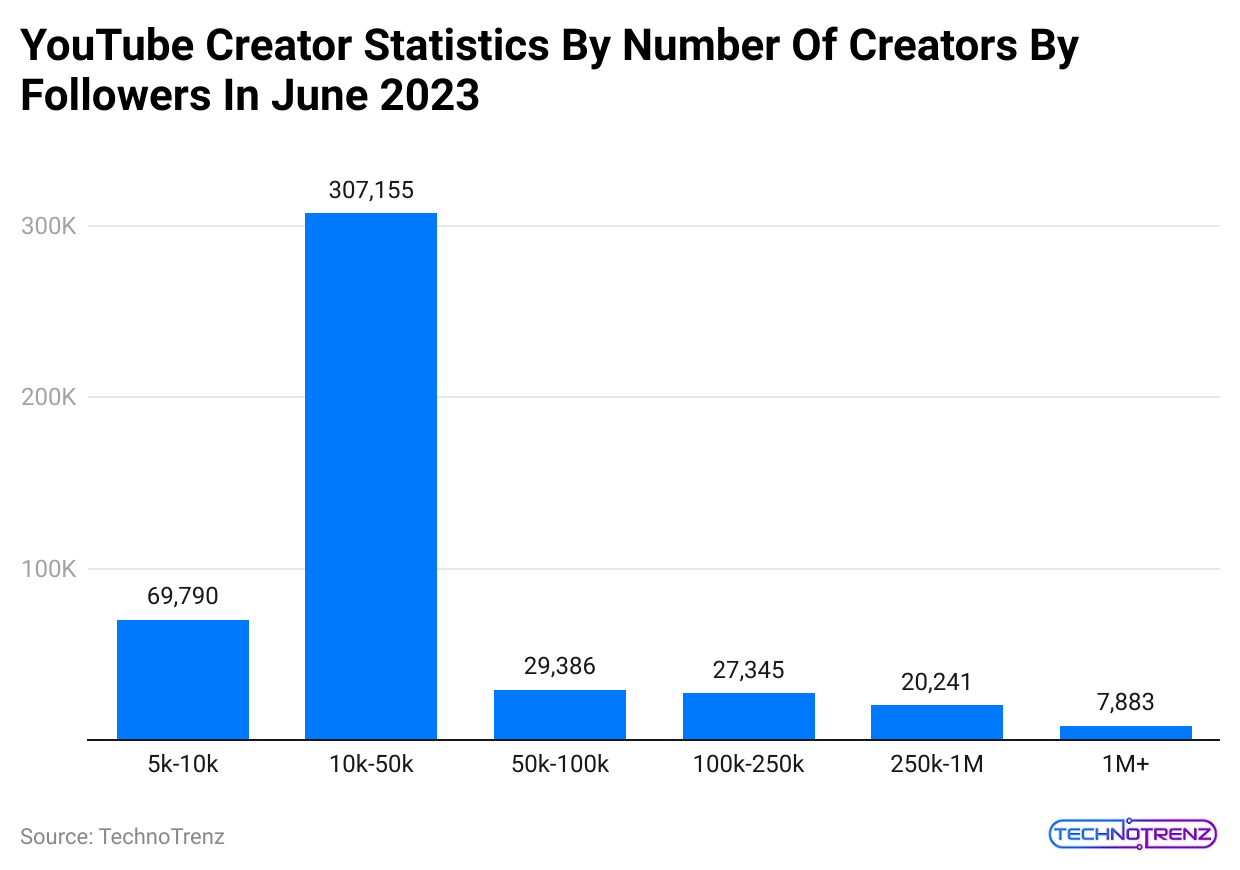
| Statistics | Followers |
|
5k-10k |
69,790 |
| 10k-50k |
307,155 |
|
50k-100k |
29,386 |
| 100k-250k |
27,345 |
|
250k-1M |
20,241 |
| 1M+ |
7,883 |
- The platform’s creative ecosystem provided more than 390,000 full-time equivalent jobs in the U.S. in 2023.
- According to YouTube Creator Statistics, 83% of creators want to use YouTube to make a positive impact on society.
- On average, videos uploaded every minute on YouTube are 4.4 minutes long.
- As of 2023, YouTube has over 114 million active channels and 10,000 partners with Content ID, including movie studios and broadcasters.
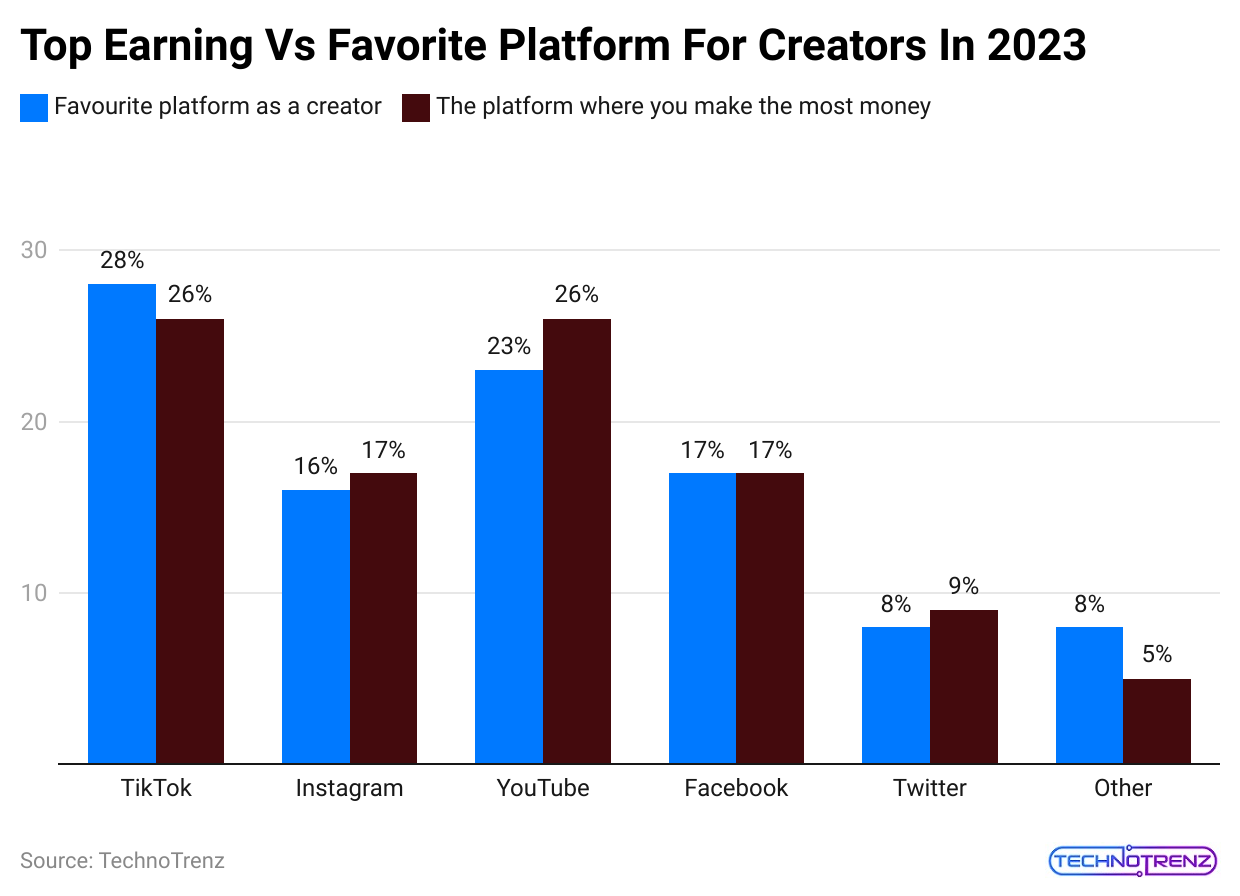
- YouTube Creator Statistics for 2023 show that YouTube is the top platform for tipping favorite creators, accounting for 26%.
- As of 2023, 23% of content creators chose YouTube as their favorite platform for content creation.
- Around 30% of creators need help to reach their target audience, according to YouTube Channel Statistics.
- Compared to celebrities, YouTubers are four times more likely to boost brand awareness among customers.
- On average, established YouTubers make between $23 and $45 every minute.
(Reference: enterpriseappstoday.com)
| Platforms | Favorite platform as a creator | The platform where you make the most money |
|
TikTok |
28% | 26% |
| 16% |
17% |
|
|
YouTube |
23% | 26% |
| 17% |
17% |
|
|
|
8% | 9% |
| Other | 8% |
5% |
- For 51% of creators on YouTube, being creative is their main focus.
- Sponsored videos on YouTube typically earn between $100 and $4,000.
- There are more than 38 million YouTube channels today, with 15 million being content creators.
- YouTube creators earn 68% of the advertising revenue, as per YouTube Channel Statistics.
- Globally, content creators upload 30,000 hours of video every hour.
Most Popular YouTube Channels Statistics
(Reference: enterpriseappstoday.com)
|
Channels |
In millions |
|
T-Series |
255 |
| MrBeast |
218 |
|
YouTube Movies |
177 |
| Cocomelon-Nursery Rhymes |
168 |
|
SET India |
166 |
| Music |
120 |
|
Kids Drawing Show |
117 |
| Like Nastya |
111 |
|
PewDiePie |
111 |
| Vlad and Nikki |
106 |
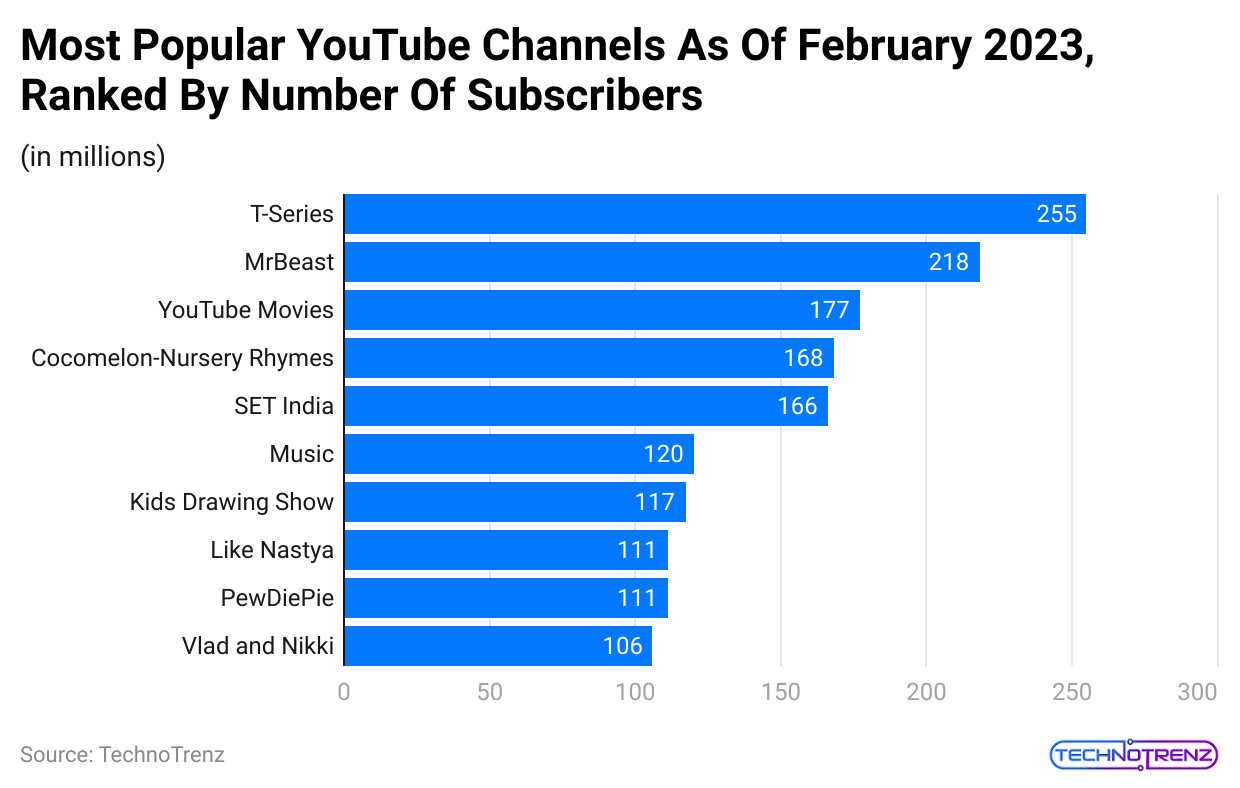
As of February 2023, the top three YouTube channels with the most subscribers were:
- T-Series with 255 million subscribers
- MrBeast, with 218 million subscribers
- YouTube Movies with 177 million subscribers
Other popular channels with millions of subscribers include Cocolemon-Nursery Rhymes, SET India, Music, Kids Diana Show, Like Nastya, PewDiePie, and Vlad and Niki.
YouTube Demographics
- YouTube has 2.5 billion users, which is almost one-third of all internet users.
- 70% of viewers bought from a brand after seeing it on YouTube.
- In 2023, India had the most YouTube users, with about 467 million.
- YouTube Channel Statistics stated that YouTube’s global ad revenue was about $29.24 billion in 2022.
- YouTube is the top video streaming app, and the average user spends 23.2 hours per month watching videos.
- The most-watched YouTube video is “Baby Shark Dance,” with 12.3 billion views.
- Videos are most likely to go viral on YouTube (27%), followed by TikTok (24%), Instagram (18%), and Facebook (14%).
 (Reference: sproutsocial.com)
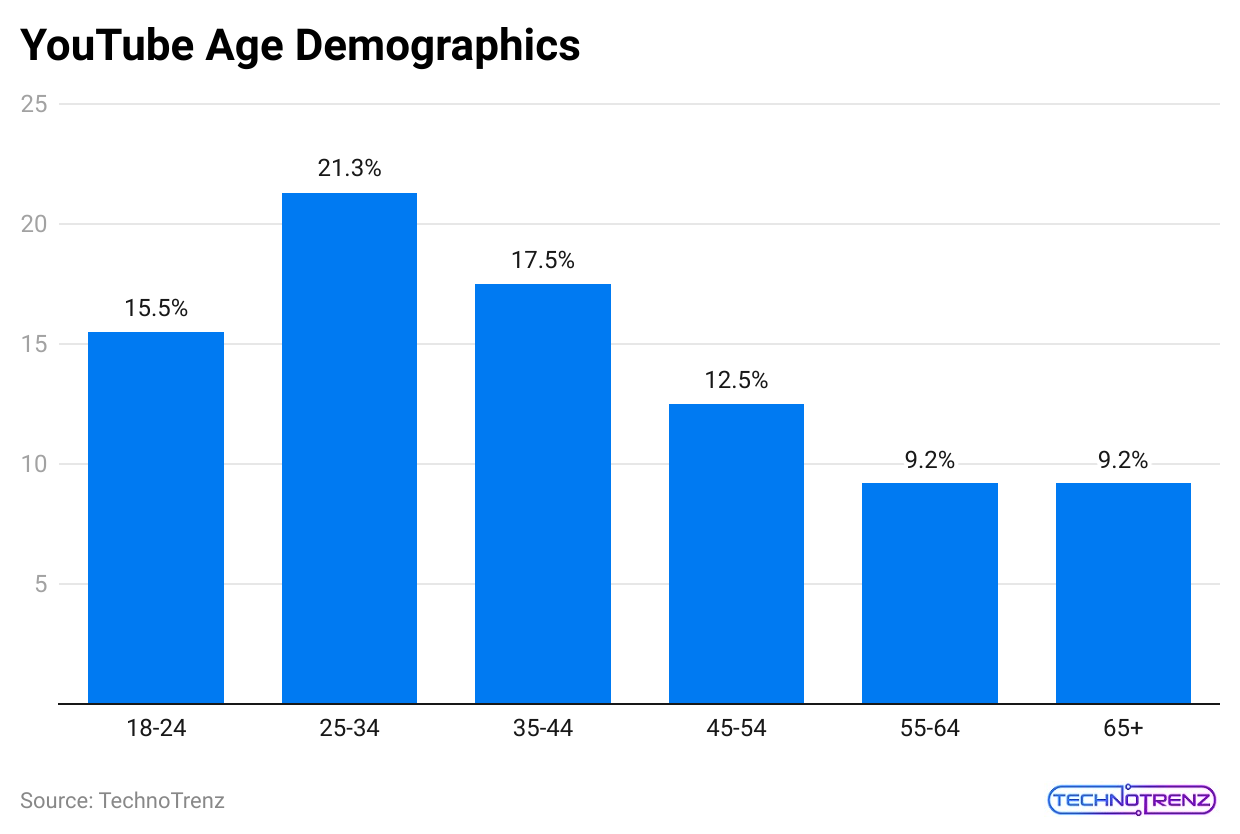
| Age Group | % |
|
18-24 |
15.5% |
| 25-34 |
21.3% |
|
35-44 |
17.5% |
| 45-54 |
12.5% |
|
55-64 |
9.2% |
| 65+ |
9.2% |
- Millennials have more believe in YouTube than any generation, according to YouTube Channel Statistics.
- 49% of Gen X,57% of Millennials,58% of Gen Z, and 27% of Boomers discover new products most often on YouTube.
- About 377 million adults aged 18-24 use YouTube, which is about 15% of YouTube’s audience.
- As of 2023, 20.2% of YouTube’s advertising audience is aged 25-34, the largest group, and 15.5% is aged 35-44.
- 85% of children aged 2-12 say they watch YouTube.
- 84% of parents who use YouTube or YouTube Kids believe it makes learning more fun for their children.
(Reference: backlinko.com)
- As of January 2023, 48.6% of YouTube users in the U.S. are male.
- 4% of YouTube users in the U.S. are female.
- Globally, 11.9% of YouTube’s audience are men aged 25-34.
- Globally, 8.8% of YouTube’s audience are women aged 25-34.
- The U.S. has the second-highest number of YouTube users, with 246 million.
- YouTube Channel Statistics stated that Brazil has the third-highest number of users, with 142 million.
- YouTube has local versions in over 100 countries, according to YouTube Channel Statistics.
- 74% of U.S. adults in rural areas, 81% in suburban areas, and 84% in urban areas use YouTube.
- As of May 2023, 96% of Gen Z users (born between 1997 and 2012) have a YouTube account.
- YouTube Channel Statistics stated that almost 56.66% of YouTube’s audience are Millennials or Gen Z.
- Of these, 30.19% are aged 25-34, and 26.47% are aged 18-24.
- 82% of Gen Z users of YouTube watch nostalgic content, as per YouTube Channel Statistics.
- 83% of Gen Z users of YouTube watch soothing content that helps them relax.
YouTube Revenue Statistics
- In the first quarter of 2024, YouTube earned $8.09 billion in revenue. This is a 12.07% decrease from the $9.2 billion in advertising revenue It earned in the last quarter of 2023, which was YouTube’s highest revenue ever in a single quarter.
- YouTube’s total revenue in 2023 was $31.5 billion, up 7.88% from $29.2 billion in 2022.
- Additionally, 2023 saw YouTube’s highest annual ad revenue to date, and based on past trends, it is expected that YouTube will earn even more in 2024.
(Reference: demandsage.com)
| Year | Revenue |
|
2010 |
$800 million |
| 2011 |
$1.3 billion |
|
2012 |
$1.7 billion |
| 2013 |
$3.1 billion |
|
2014 |
$4.2 billion |
| 2015 |
$5.5 billion |
|
2016 |
$6.7 billion |
| 2017 |
$8.1 billion |
|
2018 |
$11.1 billion |
| 2019 |
$15.1 billion |
|
2020 |
$19.7 billion |
| 2021 |
$28.8 billion |
|
2022 |
$29.24 billion |
| 2023 |
$31.5 billion |
|
2024 |
$8.09 billion. |
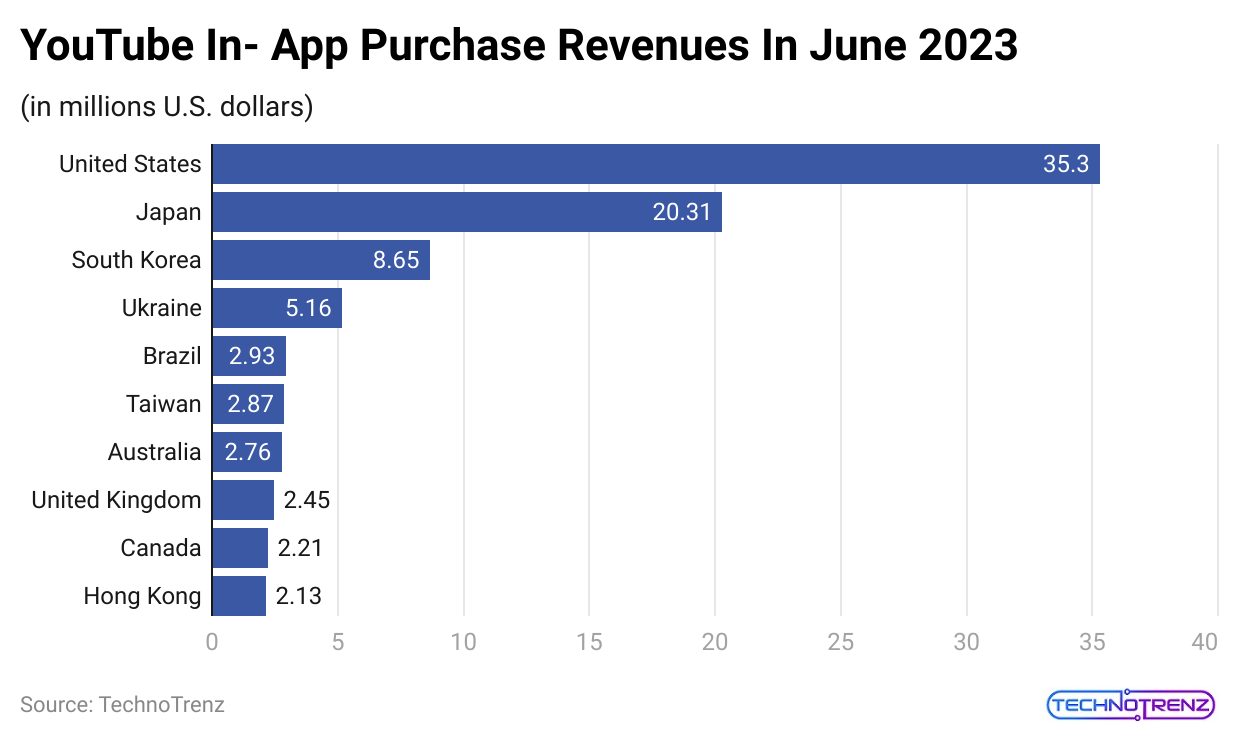
- In 2024, YouTube earned the most in-app revenue from the United States, totaling $28.29 million.
- Japan came in second with $19.26 million in in-app purchases in January 2024.
- According to YouTube Channel Statistics, South Korea ranked third, with $8.77 million in in-app revenue in January 2024.
- Overall, it’s clear that the United States and Japan generated much higher in-app revenue for YouTube compared to other countries.
- Below is a table showing YouTube’s in-app purchases in various countries worldwide for January 2024:
| Country | YouTube IAP Revenue |
|
Germany |
$1.9 million |
| Canada |
$2.02 million |
|
Hong Kong |
$2.3 million |
| Taiwan |
$2.47 million |
|
United Kingdom |
$2.49 million |
| Brazil |
$2.77 million |
|
Australia |
$2.82 million |
| South Korea |
$8.77 million |
|
Japan |
$19.26 million |
| United States |
$28.29 million |
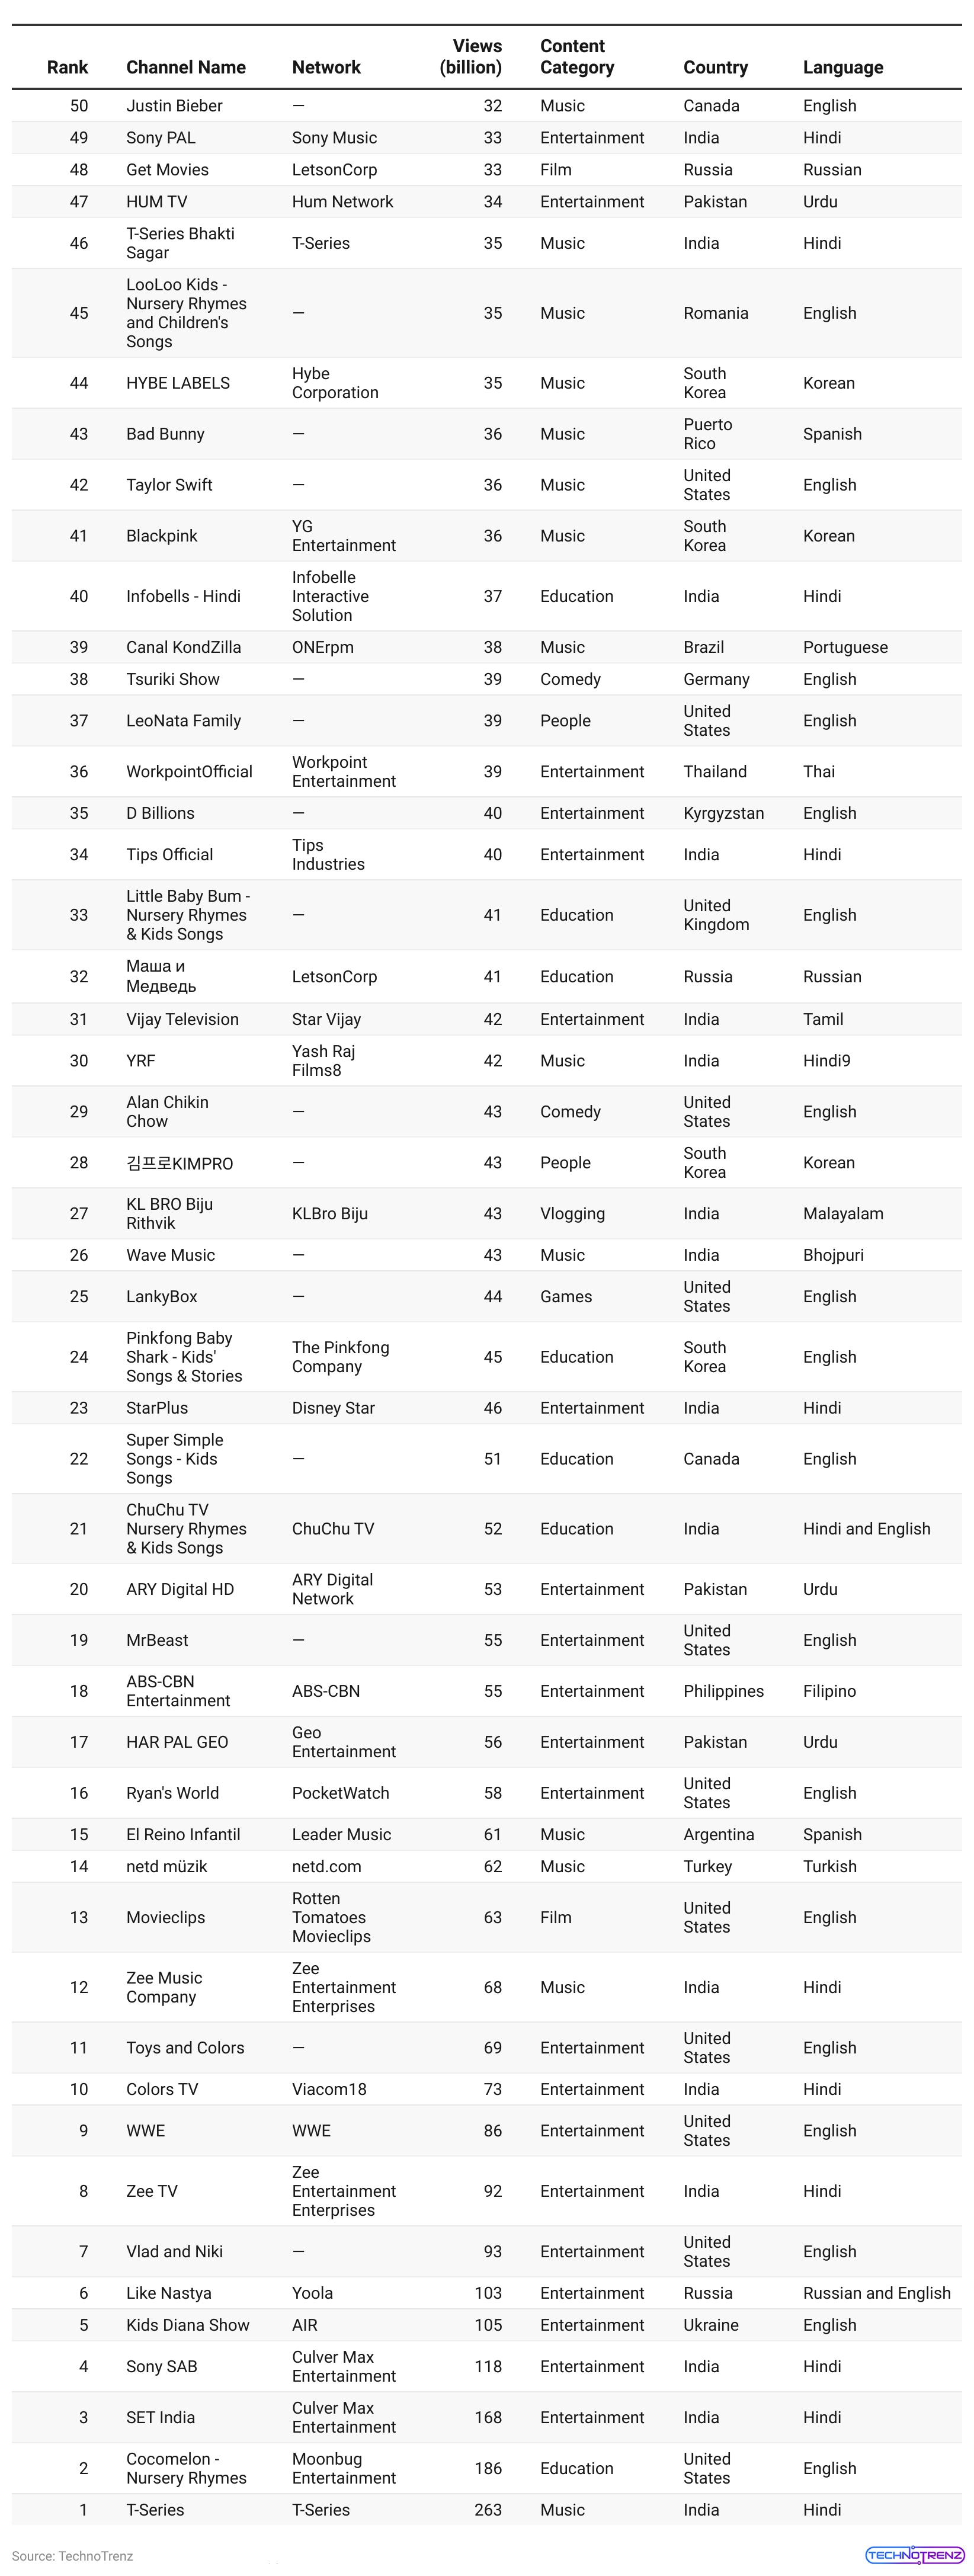
50 Most Viewed Channels
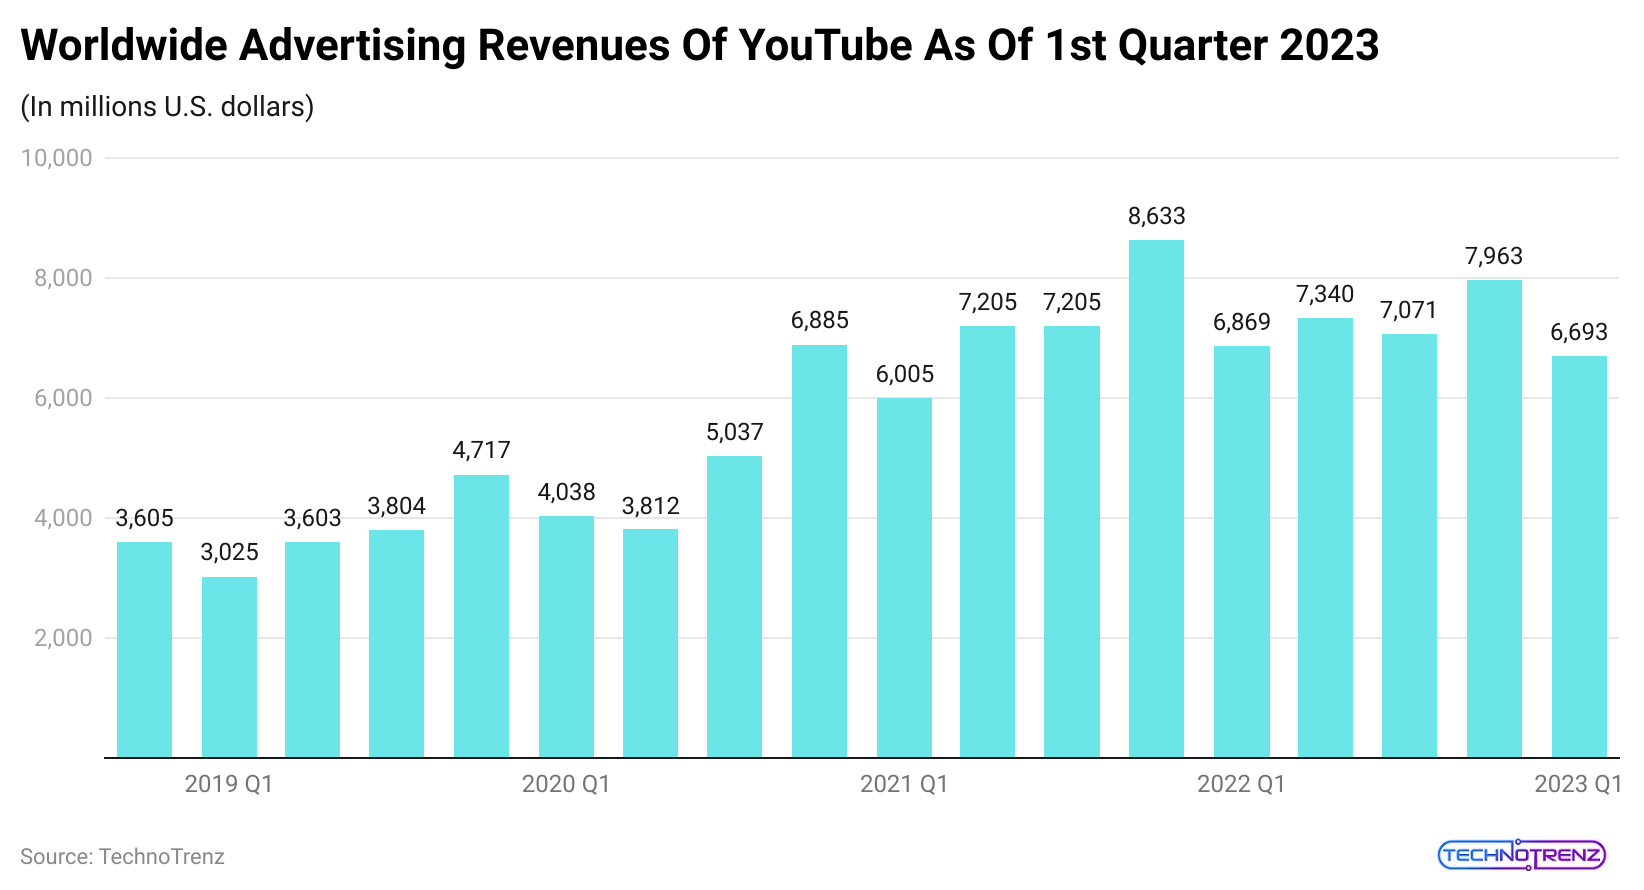
YouTube Marketing And Advertising Statistics
- Only 24% of marketers plan to make a strategy for YouTube Live.
- YouTube is a great place to increase brand awareness. According to Google’s data, 90% of people around the world use YouTube to find new brands.
- 87% of B2B marketers use video content. YouTube is a key marketing tool, ranking second in popularity. 70% of marketers recognize its importance in their influencer marketing plans.
- According to YouTube Channel Statistics, YouTube users are three times more prone to see video tuitions than to read instructions.
(Reference: notta.ai)
| Year | In a million U.S. dollars |
|
Q4 2018 |
3,605 |
| Q1 2019 |
3,025 |
|
Q2 2019 |
3,603 |
| Q3 2019 |
3,804 |
|
Q4 2019 |
4,717 |
| Q1 2020 |
4,038 |
|
Q2 2020 |
3,812 |
| Q3 2020 |
5,037 |
|
Q4 2020 |
6,885 |
| Q1 2021 |
6,005 |
|
Q2 2021 |
7,205 |
| Q3 2021 |
7,205 |
|
Q4 2021 |
8,633 |
| Q1 2022 |
6,869 |
|
Q2 2022 |
7,340 |
| Q3 2022 |
7,071 |
|
Q4 2022 |
7,963 |
| Q1 2023 |
6,693 |
- 59% of B2B marketers use YouTube for content marketing.
- 73% of B2B marketers use YouTube to share their content, according to YouTube Channel Statistics.
- 90% of shoppers have found a new product or service through YouTube.
- Among U.S. marketers surveyed, 79% are satisfied with how their YouTube ads are performing.
- Webinars are one of the best types of content for attracting and converting B2B leads.
- Mobile YouTube ads are 84% more likely to engage viewers than T.V. ads (Hootsuite).
- 42% of small and medium-sized businesses (SMBs) in the U.S. advertise on YouTube.
- For 60% of webinars, the goal is to turn leads into loyal customers.
- YouTube earned $6.69 billion in ad revenue in the first quarter of 2023.
- 65% of Google Preferred ads on YouTube saw a boost in brand awareness, with an average increase of 17%.
- In 2023, one-third of social media marketers plan to focus more on short-form videos to grow their presence on platforms like TikTok, Instagram, and YouTube.
(Reference: sproutsocial.com)
- 29% of marketers think pre-roll skippable video ads on YouTube are the most effective ad format.
- 62% of marketers plan to spend more on video ads on YouTube, according to YouTube Channel Statistics.
- YouTube makes up 27.1% of digital video ad spending.
- 8% of marketers believe YouTube is the best platform for video marketing.
- 70% of short ads on YouTube help increase brand awareness, as per YouTube Channel Statistics.
- 90% of YouTube ads help improve brand recall, according to YouTube Channel Statistics.
- Making content that matches viewers’ interests is three times more important than using a celebrity.
- Personal interests are 1.6 times more important to viewers than the quality of video production.
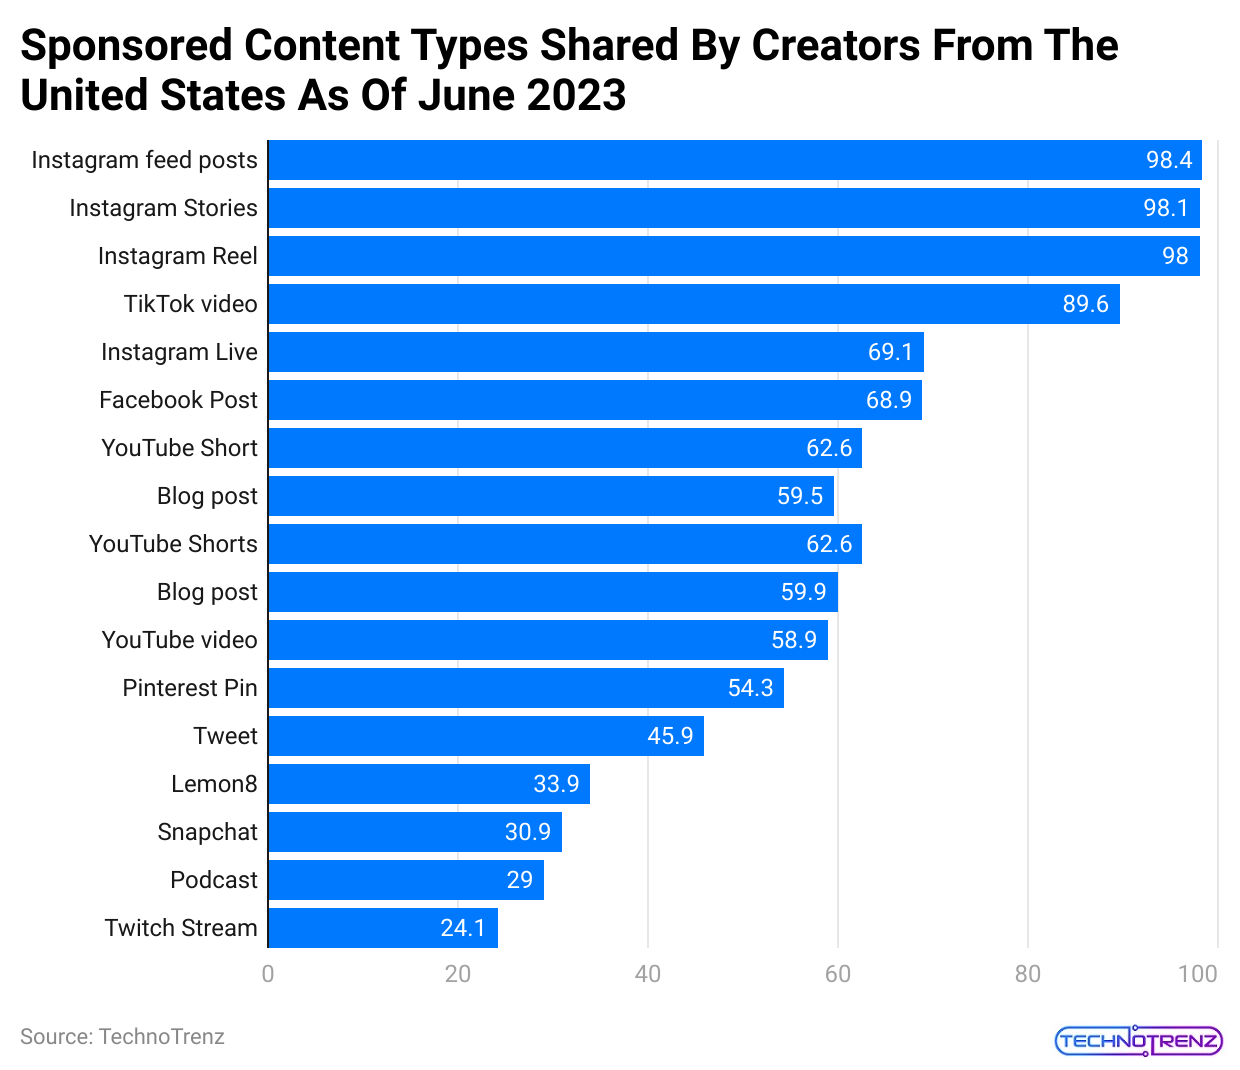
Sponsored Content Types By Platform
(Reference: enterpriseappstoday.com)
| Content | % |
|
Instagram feed posts |
98.4% |
| Instagram Stories |
98.1% |
|
Instagram Reel |
98.0% |
| TikTok video |
89.6% |
|
Instagram Live |
69.1% |
| Facebook Post |
68.9% |
|
YouTube Short |
62.6% |
| Blog post |
59.5% |
|
YouTube Shorts |
62.6% |
| Blog post |
59.9% |
|
YouTube video |
58.9% |
| Pinterest Pin |
54.3% |
|
Tweet |
45.9% |
| Lemon8 |
33.9% |
|
Snapchat |
30.9% |
| Podcast |
29.0% |
|
Twitch Stream |
24.1% |
- As of 2023, Instagram is the top social media platform for sponsored content in the United States.
- Creators use Instagram for 98% of their sponsored posts, stories, and reels. This shows that Instagram is very popular for sharing sponsored content, according to YouTube Channel Statistics.
- On the other hand, YouTube Shorts are also quite popular for sponsored content, with 62.6% of this type of content appearing in short videos on YouTube.
- This indicates that short videos on YouTube are a great way for creators to share sponsored content with their audience.
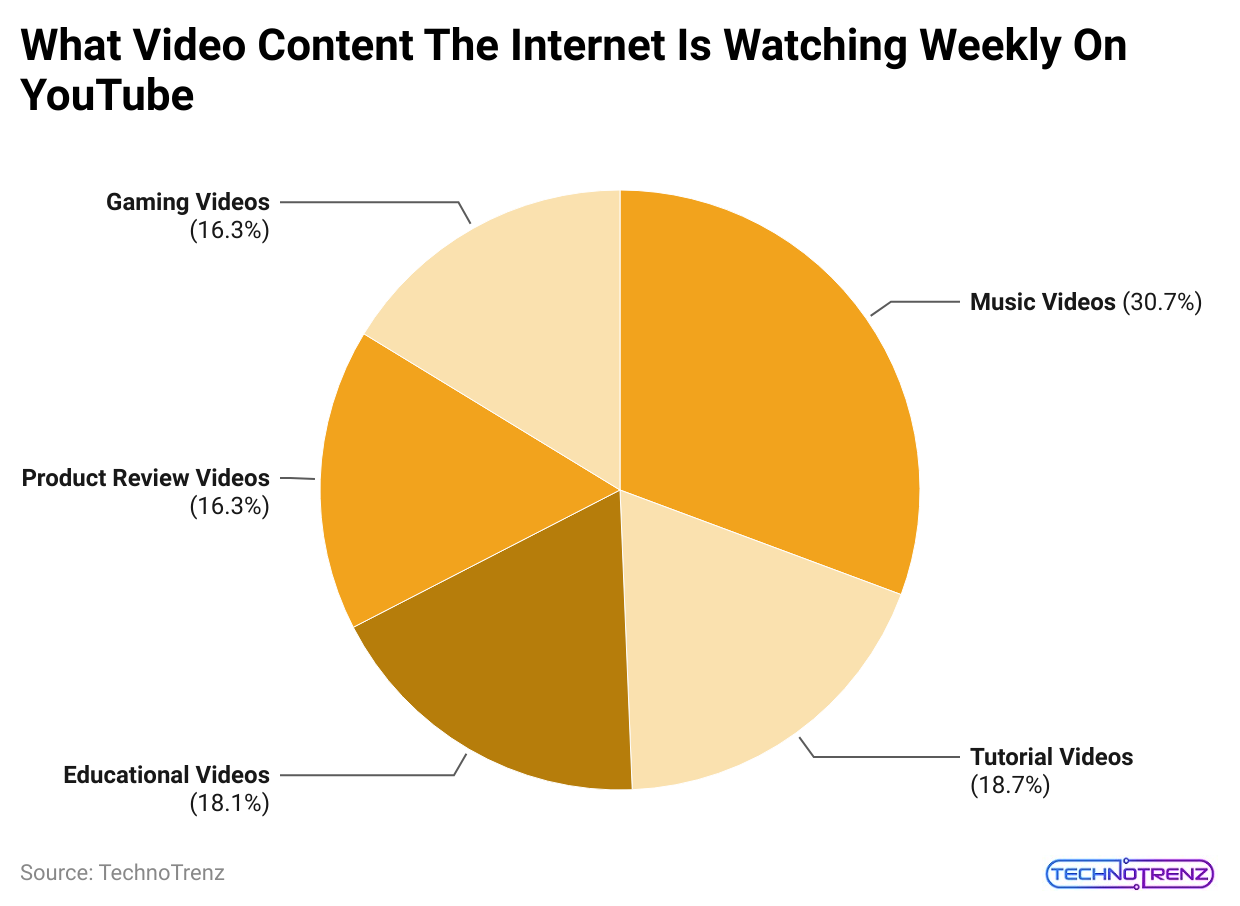
YouTube T.V., Music And Content Statistics
- T-Series, an Indian music and film company, has the most subscribers on a brand channel, with 260 million subscribers and over 20,000 video uploads as of January 2024.
- About 35% of consumers and 41% of millennials are interested in video-end links that provide more information about the brand featured.
- 81% of users sometimes explore videos recommended by YouTube.
- Educational and similar content types are the second most popular at 20%, followed by music at 20%, and ‘people and blogs’ at 19%.
- ‘Film & animation’ and ‘gaming’ are tied for fifth place, each with 7% of viewer interest.
- Baby Shark Dance” is the most-watched video on YouTube, with over 13 billion views, followed by “Despacito” at 8.3 billion views.
- YouTube T.V. has over 8 million subscribers, according to YouTube Channel Statistics.
(Reference: linearity.io)
- 82% of Gen Z users use YouTube to look back at nostalgic content.
- In the past year, 63% of Gen Z have interacted with meme-focused pages, and 57% like memes shared by brands.
- YouTube is the top internet T.V. service in the U.S., outpacing Hulu+ Live T.V., Sling T.V., and Fubo.
- YouTube Channel Statistics stated that the main draw for YouTube T.V. users is its convenience for watching content.
- Official media content on YouTube, like music videos, can quickly reach 100 million views in less than 48 hours.
- The first Grand Theft Auto VI trailer received over 93 million views in its first 24 hours, setting a record for non-music video launches.
- YouTube Premium, which offers ad-free videos and music streaming, matches Spotify’s price and reached 100 million subscribers in 2024.
- YouTube Shorts, initially introduced in India, expanded globally to over 100 countries, with daily views surpassing 50 billion in February 2023 (a 66% increase from the previous year).
- The original 15-second limit for YouTube Shorts in India was extended to 60 seconds when it went international.
(Reference: notta.ai)
| Country | In a million U.S. dollars |
|
United States |
35.3 |
| Japan |
20.31 |
|
South Korea |
8.65 |
| Ukraine |
5.16 |
|
Brazil |
2.93 |
| Taiwan |
2.87 |
|
Australia |
2.76 |
| United Kingdom |
2.45 |
|
Canada |
2.21 |
| Hong Kong |
2.13 |
- Over 72% of YouTube Shorts are longer than 15 seconds.
- YouTube invested $100 million in Shorts creators from 2021 to 2022.
- As of 2024, YouTube has over 51 million channels as per
- SET India leads the entertainment category with 133 million subscribers.
- Blackpink tops music artist channels with 74.2 million subscribers.
- Taylor Swift ranks in the top 40 with nearly 3 million search queries as per YouTube Channel Statistics.
- Music-related searches make up 20% of the top 100 queries on YouTube.
- The most-liked comment in YouTube history has received 1.8 million likes.
- YouTube’s algorithm effectively curates personalized content suggestions, which keeps users engaged longer.
- Videos capture the attention of 45% of all consumers and 56% of millennials more than other types of content.
- ‘How-to’ videos get more attention than gaming and music videos.
- YouTube Channel Statistics stated that over half of U.S. adults (51%) use YouTube to learn new skills.
- Between 2022 and 2023, the number of marketing users using YouTube for organic content advertising grew from 55% to 67%. This growth in use is due to the platform’s effectiveness.
- An additional 5% of flagged videos are removed for being spam or misleading, and 8% are deleted due to cyberbullying and harassment issues.
- YouTube is the second most efficient social platform for advertising content after LinkedIn. 86% of content advertisers consider YouTube to be at least somewhat efficient.
| Extremely Effective | Very Effective | Somewhat Effective | Not Very Effective | Not At All Effective | |
|
|
19% | 34% | 37% | 9% | 1% |
| YouTube | 12% | 29% | 45% | 12% |
2% |
|
TikTok |
18% | 19% | 37% | 26% | 0% |
| 9% | 26% | 42% | 21% |
2% |
|
|
|
11% | 24% | 46% | 19% | 0% |
| 12% | 20% | 45% | 16% |
7% |
|
|
|
6% | 17% | 47% | 23% |
7% |
Popular Made-For-Children Channels By Subscribers
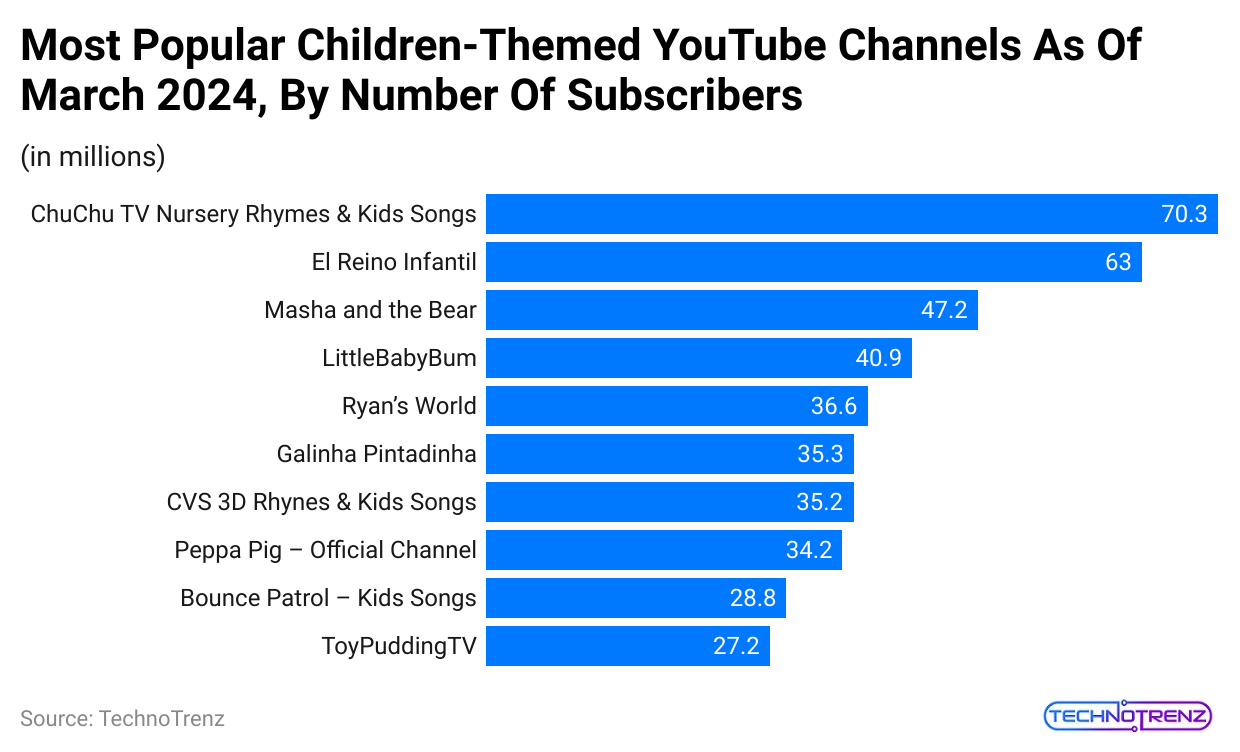
(Reference: statista.com)
| Channel name | Subscribers (in millions) |
|
ChuChu TV Nursery Rhymes & Kids Songs |
70.3 |
| El Reino Infantil |
63 |
|
Masha and the Bear |
47.2 |
| LittleBabyBum |
40.9 |
|
Ryan’s World |
36.6 |
| Galinha Pintadinha |
35.3 |
|
CVS 3D Rhynes & Kids Songs |
35.2 |
| Peppa Pig – Official Channel |
34.2 |
|
Bounce Patrol – Kids Songs |
28.8 |
| ToyPuddingTV |
27.2 |
- YouTube is very popular with younger users and kids, so channels for children are some of the most-watched.
- As of March 2024, ChuChu TV Nursery Rhymes & Kids Songs is the top kids’ channel with around 70.3 million subscribers.
- El Reino Infantil, a Spanish-language channel, is in second place with about 63 million subscribers, and Masha and the Bear are third with 47.2 million subscribers.
- According to YouTube Channel Statistics, more than half of them said their children often watch YouTube videos.
- In the U.S., kids were spending over an hour a day on the YouTube app in 2021.
- When it comes to what children like to watch online, software, audio, and video content were the most popular categories as of May 2022.
- About 44% of younger users engaged with these types of content. Between 2020 and 2021, between 52% and 55% of children in India, Saudi Arabia, and South Africa visited websites for software, audio, and video.
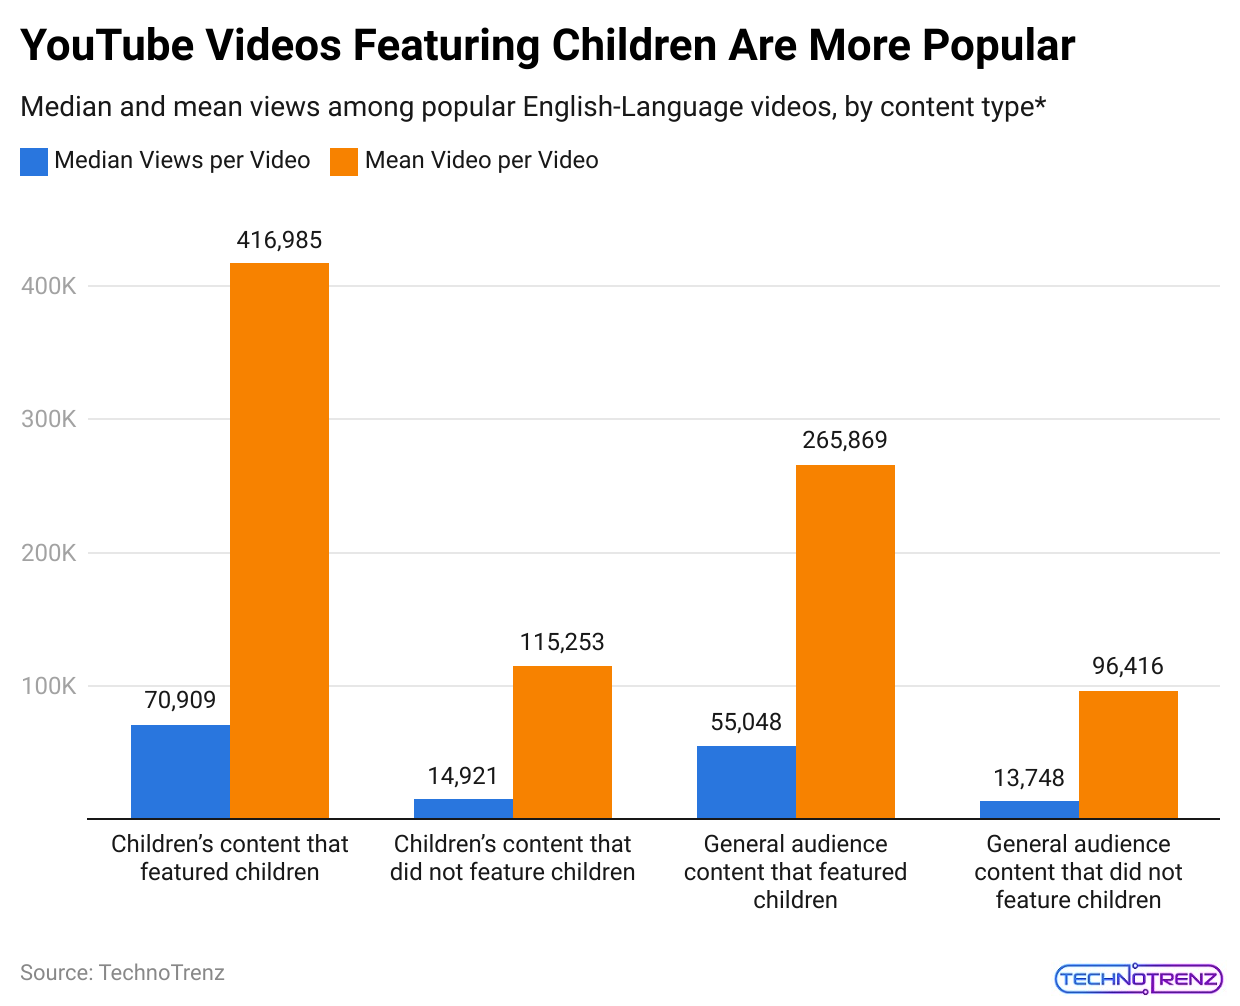
(Reference: statista.com)
| Category | Median Views per Video | Mean Video per Video |
|
Children’s content that featured children |
70,909 | 416,985 |
| Children’s content that did not feature children | 14,921 |
115,253 |
|
General audience content that featured children |
55,048 | 265,869 |
| General audience content that did not feature children | 13,748 |
96,416 |
Conclusion
YouTube is an online video streaming and sharing platform with both web and app versions and a social media platform. The platform is the second biggest and most used online platform worldwide. It has over 2.7 billion active users, and more gain access through the mobile app than the website. The mobile app is easier to operate with a better interface.
One interesting fact about YouTube is that it has more male users than female. Also, the Netherlands has the highest YouTube penetration rate. YouTube Channel Statistics shed light on the essential points and highlights of YouTube.
Sources
FAQ.
Cost per 1,000 impressions (CPM) is a measure of how much advertisers pay to show their ads on YouTube. In YouTube Analytics, you’ll see different CPM metrics, including the basic CPM, which shows how much an advertiser spends for every 1,000 times their ad is shown.
CPM stands for “cost per thousand,” with “mille” being the Latin word for “thousand.” It shows the average cost of having your ad shown 1,000 times—the amount you pay each time your ad is viewed 1,000 times.
The “Cost per 1,000 People Reached by Ad” measures how much you spend to reach 1,000 people with an ad on TikTok. To calculate it, you divide the total amount spent on the ad campaign by the number of people who saw the ad, then multiply that number by 1,000.

Saisuman is a professional content writer specializing in health, law, and space-related articles. Her experience includes designing featured articles for websites and newsletters, as well as conducting detailed research for medical professionals and researchers. Passionate about languages since childhood, Saisuman can read, write, and speak in five different languages. Her love for languages and reading inspired her to pursue a career in writing. Saisuman holds a Master's in Business Administration with a focus on Human Resources and has worked in a Human Resources firm for a year. She was previously associated with a French international company. In addition to writing, Saisuman enjoys traveling and singing classical songs in her leisure time.