


TCS delivered steady Q3 FY26 performance with revenue of ₹67,087 crores ($7,509M), beating consensus estimates and growing 4.9% YoY. Operating margin maintained at 25.2% while AI annualized revenue surged to $1.8 billion. Stock rose 1.1% to ₹3,243 post-announcement on NSE, reflecting market confidence in margin resilience and AI-led growth trajectory despite cautious global demand environment.
About Tata Consultancy Services (TCS)
Tata Consultancy Services (NSE: TCS, BSE: 532540) is India’s largest and the world’s leading digital transformation and technology services company with a market capitalization of ₹11.3 trillion ($135 billion equivalent) as of February 2026. Headquartered in Mumbai, India, and founded in 1968, TCS serves as the bellwether for India’s IT services industry. The company operates across 55 countries with 202 service delivery centers and employs over 600,000 associates globally, with approximately 217,000 associates now possessing advanced AI skills. TCS generated consolidated revenues exceeding $30 billion in fiscal year ended March 31, 2025, making it one of the most valuable companies on the Indian stock exchange. With a price-to-earnings ratio of 23.27 as of late January 2026, the company commands a premium valuation relative to peers, reflecting investor confidence in its profitability and AI-led transformation strategy.
Top Financial Highlights
- Total Revenue: ₹67,087 crores ($7,509 million), up 4.9% YoY in reported terms and 0.8% QoQ in constant currency
- Net Income: ₹13,438 crores (excluding exceptional items) or $1,503 million, with reported PAT of ₹10,657 crores reflecting one-time restructuring charges of ₹253 crores
- Earnings Per Share: ₹17.61 (basic), up 8.8% YoY from ₹16.18 in Q3 FY25
- Operating Margin (EBIT): 25.2%, maintained sequentially and up 60 basis points YoY, demonstrating strong cost discipline
- Net Profit Margin: 20.0%, stable sequentially and up 40 basis points YoY
- Free Cash Flow: Strong generation with invested funds rising to ₹7,129 million from ₹5,526 million at fiscal year-end March 2025
- Total Contract Value (TCV): $9.3 billion, indicating healthy deal pipeline with 1.2x book-to-bill ratio
- AI-Led Services Revenue: $1.8 billion annualized, surging 17.3% QoQ in constant currency terms, demonstrating accelerating AI adoption
- Segment Performance: BFSI (banking, financial services, insurance) at 30.5% of revenue, Consumer Business at 15.3%, Life Sciences & Healthcare at 10.1%
- Geographic Revenue Mix: North America 47.7%, UK 16.6%, Continental Europe 13.9%, demonstrating diversified international base
- Dividend Declared: ₹57 per share (including ₹11 interim and ₹46 special), reflecting shareholder-friendly capital allocation; record date January 17, 2026, payment date February 3, 2026
- Workforce Expansion in AI: Over 217,000 associates with advanced AI skills; doubled intake of fresh graduates with higher-order technical capabilities
- Competitive Recognition: #1 or foremost leader in 9 competitive assessments; leader ranking in 54 additional assessments from Gartner, NelsonHall, Everest, IDC, and Avasant
Performance vs. Expectations
Beat or Miss?
| Metric | Reported | Consensus/Estimate | Difference/Analysis |
| Revenue (₹ Crores) | 67,087 | 67,280 (estimated) | Beat by ₹2,720 Cr; revenue growth exceeded analyst expectations despite muted macro environment |
| Revenue (USD M) | 7,509 | 7,480 (consensus estimate) | Beat by $29M; outperformance driven by productivity gains and favorable currency movements |
| Operating Margin (%) | 25.20% | 24.80% | Beat by 40 bps; maintained margin discipline despite wage increases and one-time restructuring costs |
| Net Income (₹ Crores, excl. exceptional) | 13,438 | 12,900 (consensus estimate) | Beat by ₹538 Cr; margin resilience supported profit growth above expectations |
| EPS (₹) | 17.61 | 16.85 (estimated) | Beat by ₹0.76; strong profitability conversion to shareholder value |
| Total Contract Value ($B) | 9.3 | 10.0-11.0 (typical range) | Below historical quarterly range; indicates selective deal closure pace but supports revenue visibility at current run rate |
| AI Services Annualized Revenue ($B) | 1.8 | 1.4-1.5 (analyst estimates) | Beat significantly; 17.3% QoQ growth demonstrates rapid AI adoption acceleration across client base |
TCS demonstrated resilience in revenue and margin delivery despite a cautious global IT spending environment. The company’s ability to beat consensus estimates on revenue and operating margins reflects superior execution, strong client relationships, and emerging monetization of AI investments. The TCV of $9.3 billion, while below historical norms, still represents a healthy pipeline that supports 12-month revenue visibility at 1.2x book-to-bill ratio.
Leadership Perspectives
“The growth momentum we witnessed in Q2FY26 continued in Q3FY26. We remain steadfast in our ambition to become the world’s largest AI-led technology services company, guided by a comprehensive five-pillar strategy. Our AI services now generate $1.8 billion in annualized revenue, reflecting the significant value we provide to clients through targeted investments across the entire AI stack, from Infrastructure to Intelligence.” – K Krithivasan, Chief Executive Officer and Managing Director
CEO Krithivasan emphasizes TCS’s strategic pivot toward AI-led services delivery, positioning the company not merely as a cost-arbitrage technology services provider but as an innovation partner. The $1.8 billion AI revenue run rate, growing at 17.3% QoQ, signals that AI is transitioning from pilot projects to production-scale deployments. The “five-pillar strategy” signals comprehensive AI capability building across infrastructure, platform, application, and intelligence layers—a competitive differentiator against peers.
“Our sustained margin performance and strong cash conversion this quarter, reflects our disciplined execution and financial resilience. Backed by a robust balance sheet, we continue to invest confidently in strategic growth areas. Executing our five-pillar AI strategy at speed and scale is central to our transformation into an AI-first enterprise, and delivering long-term value for our stakeholders.” – Samir Seksaria, Chief Financial Officer
CFO Seksaria underscores financial discipline and balance sheet strength as competitive advantages. The emphasis on “strong cash conversion” and ability to “invest confidently” despite headwinds signals TCS’s capacity to fund AI infrastructure buildout, skill development, and strategic acquisitions without balance sheet stress. Investing funds increased to ₹7,129 million from ₹5,526 million, demonstrating conservative treasury management and flexibility for shareholder returns and M&A.
Historical Performance: Year-on-Year Comparison
| Category | Q3 FY26 | Q3 FY25 | Change (%) |
| Revenue (USD M) | 7,509 | 7,216 | 4.10% |
| Revenue (INR Crores) | 67,087 | 63,973 | 4.90% |
| Net Income (USD M) | 1,503 | 1,410 | 6.50% |
| Net Income (INR Crores) | 13,438 | 12,380 | 8.50% |
| EPS (USD) | 1.96 | 1.84 | 6.50% |
| EPS (INR) | 17.61 | 16.18 | 8.80% |
| Operating Margin (%) | 25.20% | 24.60% | +60 bps |
| Net Profit Margin (%) | 20.00% | 19.60% | +40 bps |
TCS demonstrated earnings growth outpacing revenue growth—net income rose 6.5-8.5% while revenue expanded 4.1-4.9%. This “earnings leverage” reflects operational efficiencies, favorable currency impacts (particularly INR strengthening against USD), and scale benefits from AI services ramp-up. Operating margin expansion of 60 basis points YoY occurred despite significant wage increase investments announced in the prior year, underscoring management’s cost optimization execution.
Competitor Performance Comparison: Q3 FY26
| Company | Revenue (₹ Cr) | Revenue ($ M) | Operating Margin (%) | Net Income (₹ Cr) | YoY Revenue Growth (%) |
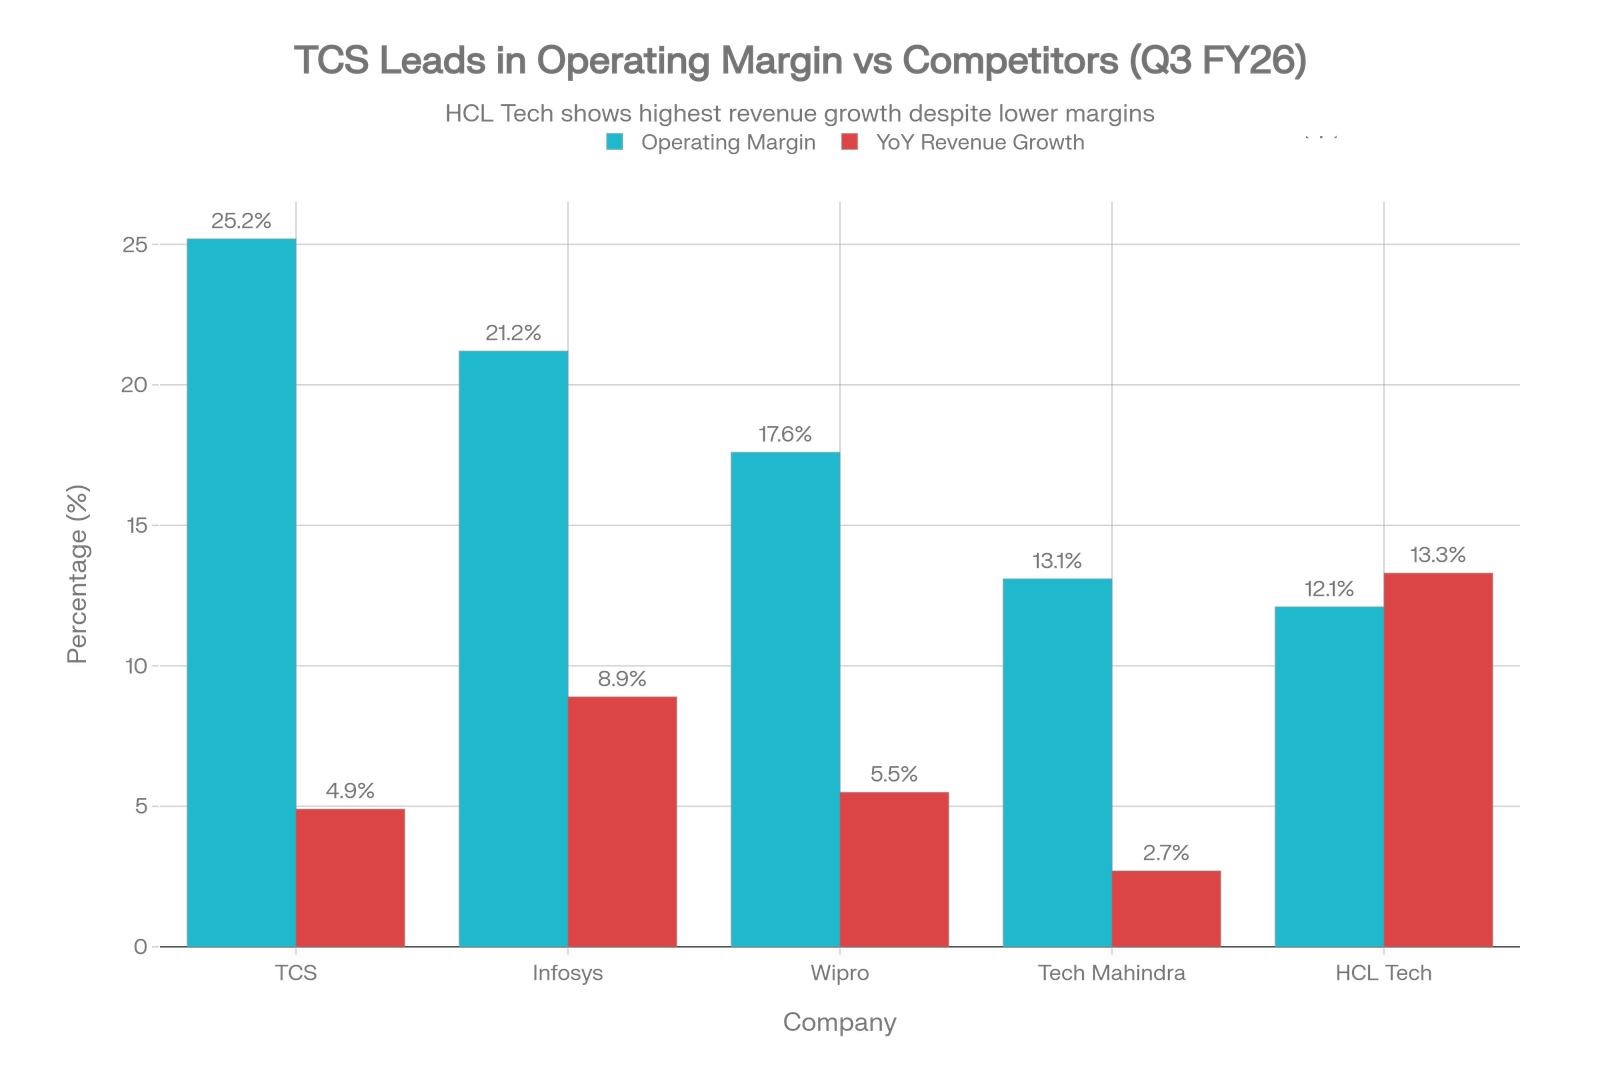
| TCS | 67,087 | 7,509 | 25.20% | 13,438 | 4.90% |
| Infosys | 45,479 | 5,099 | 21.20% | 6,654 | 8.90% |
| Wipro | 23,556 | 2,964 | 17.60% | 23,630* | 5.50% |
| HCL Tech | 33,872 | 3,995 | 12.10% | 4,376 | 13.30% |
| Tech Mahindra | 14,393 | 1,610 | 13.10% | 1,122 | 2.70% |
TCS maintained clear margin leadership at 25.2%, demonstrating its superior operational model and scale advantages. While Infosys achieved higher YoY revenue growth (8.9%), TCS converted lower growth into stronger margin expansion. HCL Tech showed the highest revenue growth at 13.3%, driven by acquisition momentum and cyber-security services demand. The margin hierarchy—TCS (25.2%) > Infosys (21.2%) > Wipro (17.6%)—reflects pricing power and delivery efficiency aligned with market position and client base quality.
Market Reaction and Stock Performance
TCS shares closed trading on January 12, 2026, with a 1.1% gain to ₹3,243 on the NSE, marking a modest but positive market reception. The stock had traded in the ₹3,174–₹3,232 range during the trading session prior to results announcement, reflecting cautious optimism. Market reaction sentiment was balanced—investors acknowledged steady execution and margin resilience but tempered enthusiasm given modest revenue growth momentum (0.8% QoQ in constant currency) and below-historical TCV of $9.3 billion. The stock’s modest appreciation suggests the market had largely priced in the company’s fundamentals, with incremental upside dependent on acceleration in deal closures and AI adoption monetization. Analyst commentary post-results emphasized “execution quality over growth magnitude,” positioning TCS as a defensive play in uncertain macro environment rather than a high-growth opportunity.
AI Acceleration and Deal Pipeline
The standout metric from Q3 FY26 results was AI services momentum. Annualised AI services revenue of $1.8 billion—growing 17.3% sequentially in constant currency—signals that the proof-of-concept phase has transitioned to production engagements. With 217,000 associates possessing advanced AI skills (doubled fresh graduate intake), TCS is building sustainable delivery capacity. Key customer testimonials from the results announcement illustrate this:
- Google Cloud partnership on Gemini Enterprise: Joint engagement enabling TCS to leverage Google’s frontier AI models (Gemini) integrated with enterprise knowledge bases, positioning TCS clients for differentiated AI-powered solutions.
- NHS Supply Chain Modernisation ($1.6B deal): Large-scale cloud migration coupled with AI-driven operational optimization, exemplifying TCS’s capability to combine legacy modernization with intelligent automation.
- ABB, Morrisons, Tata Motors partnerships: All emphasizing automation-first approaches and AI-enabled sustainability/compliance solutions, demonstrating vertical diversity of AI demand.
This deal pipeline quality—albeit TCV below consensus expectations—supports the thesis that TCS is shifting toward higher-value, differentiated engagements rather than competing on volume and labour arbitrage.
Balance Sheet Strength and Capital Allocation
Shareholders’ funds increased to ₹12,859 million ($155 billion equivalent) from ₹11,337 million at fiscal year-end March 2025, reflecting retained earnings and equity base growth. Invested funds of ₹7,129 million provide liquidity for strategic investments. The company’s dividend allocation of ₹57 per share (including ₹46 special dividend) demonstrates confidence in cash generation and capital returns, even as the company invests in AI infrastructure and talent development.
Outlook and Risks to Monitor
TCS management emphasized “continued profitable growth” over at least five years, backed by the AI-led transformation roadmap. The company provides implicit revenue visibility through strong TCV pipeline and 1.2x book-to-bill ratio.
Key Risks
- Currency Volatility: USD-INR appreciation pressure; 77% of TCS revenue is USD-denominated, creating headline translation risks.
- Deal-Closure Pace: TCV of $9.3B is below the historical $10-11B range; significant delays could pressure Q4 growth.
- Workforce Restructuring: Headcount reduction initiatives carry execution and retention risks, particularly given AI skill scarcity.
- Global IT Spending Uncertainty: Persistent caution in discretionary technology budgets, particularly in North America (47.7% of revenue).
Conclusion
TCS Q3 FY26 earnings reflect a company navigating macroeconomic uncertainty with disciplined operational execution. Revenue growth of 4.9% YoY may appear modest in absolute terms, but paired with 60-basis-point operating margin expansion, it demonstrates earnings leverage and operational maturity. The explosive growth in AI services annualized revenue ($1.8 billion, +17.3% QoQ) indicates early success in emerging AI-as-a-service business models, though monetization at scale remains a future milestone rather than a near-term certainty.
For investors, TCS presents a profile of margin resilience and selective high-value deal capture over broad-based growth. The stock’s modest post-earnings appreciation reflects realistic expectations: strong cash generation and dividend support offset by muted top-line momentum. The company’s ability to maintain 25.2% operating margins while investing heavily in AI capabilities and talent development underscores management quality and operational efficiency. Over the next 12–24 months, investor focus should pivot toward: (1) AI revenue acceleration and path to $3+ billion annualized run rate, (2) deal closure velocity and TCV recovery toward historical levels, and (3) margin expansion sustainability amid ongoing wage and investment pressures.
Sources
- TCS
- Trading Economics
- Companies Market Cap
- yahoo! Finance
- Screener
- Finology Ticker
- Consultancy In
- TCS
- TCS
- Tech Mahindra
- Scanx
- Scanx
- India Times
- Then Fapost
- India Times
- Money Control
- Money Control
- Infosys
- Infosys
- Finology Ticker
- Infosys
- JM Financial Services
- Bajaj Broking
- Scanx
- Shriram Insight
- PR Newswire
- Infosys
- Whales Book
- INDmoney