


Introduction
General Motors Statistics: General Motors (GM) is one of the world’s largest car manufacturers while navigating the complex shift from traditional gasoline-powered vehicles to modern electric transportation. The 2025 to 2026 period shows strong sales growth alongside stable revenue and operational changes, driven by global market shifts, new policies, and technological progress.
The U.S. automotive market remains under GM’s control, but the company shows both financial strength and operational challenges, particularly in its electric-vehicle projects and international operations. GM generates billions from its software services and multiple vehicle lines, enabling the company to transform into a technology-based mobility enterprise in the coming years.
Editor’s Choice
- GM reported 2025 revenue of USD 182.4B, down 1.3% year-over-year.
- Net income dropped by 55.1% to reach USD 10.1B.
- The business experienced a 14.6% decline in EBIT-adjusted to USD 12.7B, and its margin decreased to 6.9%.
- The company experienced a decrease in net income margin to 1.5%, indicating it is facing challenges in generating profits.
- The automotive operating cash flow decreased by 21.7%, resulting in USD 18.7B.
- The adjusted free cash flow declined 24.6% to USD 10.6B.
- The diluted EPS decreased by 48.7%, resulting in USD 3.27, due to lower earnings.
- Global deliveries are projected to reach 6.182M units in 2025 (+3.0%).
- North America accounted for 53.6% of total deliveries in 2024.
- The U.S. market sold 2.853M units in 2025, demonstrating consistent sales growth.
- GM held a global market share of 6.8% in 2025.
- OnStar deferred revenue stood at USD 5.4B, projected to reach USD 7.5B in 2026.
- Super Cruise generated USD 234M revenue with over 620,000 subscribers.
- EV sales grew 48% annually, maintaining GM’s #2 EV market position.
- The company incurred a USD 7.9B charge related to EV expenses, which negatively affected its profitability.
General Motors Financial Outlook
(Source: investor.gm.com)
- The current financial report from General Motors presents an examination of its 2025 performance, which shows mixed results but also reveals important strategic insights from 2024.
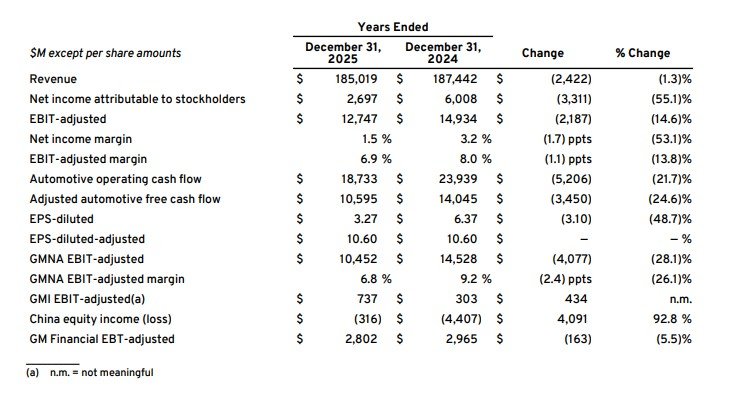
- The organization experienced a slight 1.3% revenue reduction, bringing its total revenue to USD 182.4 billion in fiscal year 2025, while its profitability metrics showed more significant changes.
- The organization experienced a 55.1% decrease in net income, which fell to USD 10.1 billion, indicating substantial margin erosion and cost-related challenges, even though revenue remained constant.
- The analysis of EBIT-adjusted earnings shows a 14.6% decline to USD 12.7 billion due to declines in operational performance.
- The company showed this through its EBIT-adjusted margin decline, which fell from 8.0% to 6.9% due to higher operating expenses, market pricing challenges, or strategic investments.
- The net income margin similarly fell to 1.5%, underscoring diminished bottom-line strength.
- Investors consider cash flow performance to be an important risk factor. Automotive operating cash flow declined 21.7% to USD 18.7 billion, while adjusted automotive free cash flow dropped 24.6% to USD 10.6 billion.
- The decreases indicate that the company faces tighter liquidity, resulting in increased operational costs and higher capital spending needs, both of which are essential for companies operating in the capital-intensive automotive manufacturing sector.
- The company reported a 48.7% decline in diluted EPS to USD 3.27, driven by a decline in net income.
- The adjusted EPS remained unchanged at USD 10.60 because non-recurring items and restructuring costs had a major impact on the financial results that were presented.
- The EBIT-adjusted results for GM North America (GMNA) decreased by 28.1%, while its profit margins decreased to 6.8% because of decreased customer demand and increased operational costs in its primary market.
- GM International (GMI) achieved a significant EBIT-adjusted growth while China equity income recovered from a previous loss to a smaller deficit, which improved by USD 4.1 billion, showing the beginning of market stability in a typically unpredictable market.
- General Motors demonstrates financial resilience through its revenue performance, but its declining profit margins and earnings and cash flow performance indicate operational difficulties.
- The company shows stable adjusted EPS performance, which, combined with positive international developments, suggests a strategic change for the company that will last longer than any operational problems.
General Motors Global Sales Performance By Region
(Source: investor.gm.com)
- The most recent General Motors supplemental data provides specific details about how many vehicles were sold worldwide and how market share and regional performance metrics reveal the company’s competitive status in the automotive sector.
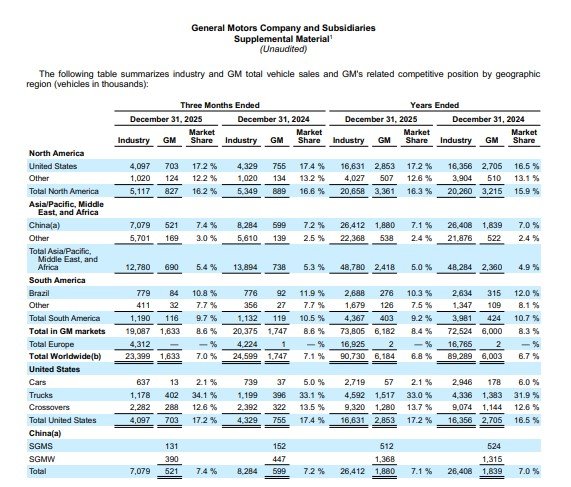
- In Q4 2025, GM sold 23.4 million vehicles worldwide, which accounted for 1.0% of the total industry sales according to GM.
- GM’s market share throughout the year reached 6.8% while the company maintained its position in the market despite tough competition, which brought about minor market share changes from 6.7% to 6.8%.
- The company maintains its strong position in international automotive markets because of its consistent market performance, which continues through economic challenges.
- GM’s primary profit center, North America, generated 4.1 million vehicle sales during Q4 2025 while the company achieved a 17.2% market share, which represented an increase over the previous year’s 17.4%.
- The company maintained its market share at 17.2% throughout the year, which represented a small increase over the previous 16.5% share, indicating GM’s strong market power in this area that generates high profits.
- GM achieved total annual sales of 4.1 million units in the United States, which resulted in a stable 17.2% market share that mainly came from the truck and crossover segments, which together made up more than 80% of total sales volume.
- The annual GM market share for China dropped from 7.0% to 7.1%, but quarterly demand showed fluctuations.
- The total market share in Asia-Pacific remained at 5.0% because domestic electric vehicle manufacturers and pricing competition posed challenges to the market.
- South America displayed mixed indicators because GM’s yearly market share declined from 10.7% to 9.2% while the company maintained its volume requirements.
- Brazil continued to be a major market for the company, even though its market share dropped to 10.3%.
- The U.S. market for crossovers from the segment brought in 12.6% of sales during the quarter.
- The U.S. market for trucks delivered 34.1% of sales, which demonstrates GM’s commitment to selling vehicles that provide the highest profit margins.
- The sales data of General Motors shows that the company maintains strong sales in North America, while its international markets have reached a stable point, and its Asian operations continue to face difficulties.
- The data demonstrates how GM uses its regional strengths and its ability to manage product distribution to keep its market position in the automotive industry, which currently experiences rapid changes.
General Motors Earnings Per Share
(Source: investor.gm.com)
- The latest earnings per share (EPS) statistics from General Motors show extreme differences between the quarterly income decline and the yearly earnings.
- The quarterly income decline of General Motors shows extreme differences from its yearly performance, which affects its ability to generate shareholder returns and provides insight into its earnings quality.
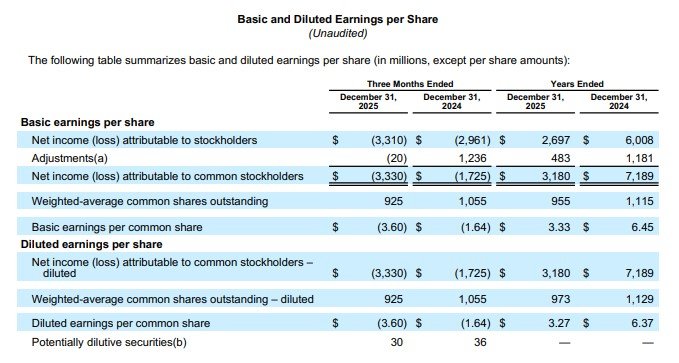
- GM reported a net loss of USD (3.33) billion for Q4 2025, which increased from their previous Q4 2024 loss of USD (1.73) billion.
- The basic and diluted EPS results showed USD (3.60), which marked a twofold increase from the previous year, which recorded USD (1.64).
- The company now faces greater difficulties in achieving profitability because its current financial situation has reached a critical level.
- The decline in earnings performance results from three core elements that create earnings instability, according to analysts who monitor these specific elements.
- The complete financial analysis shows a different result. The company generated annual net income of USD 3.18 billion, which fell short of the previous year’s total earnings of USD 7.19 billion, thus representing a 55% decrease.
- The diluted earnings per share (EPS) declined from USD 6.37 to USD 3.27, which demonstrates that the company experienced reduced earnings power even though it achieved profitable results.
- The capital structure analysis shows that the weighted-average shares outstanding decreased from 1.13 billion to 973 million (diluted), which indicates that the company continues to repurchase shares or make capital changes that serve as an essential tool for managing EPS.
- The adjusted income for the period showed minimal growth because the financial results were mainly driven by one-time events.
- The EPS performance of General Motors shows that the company currently faces earnings difficulties, but it continues to generate ongoing annual profits.
- Investors consider margin recovery and cost management practices as essential for determining whether the company can sustain its future earnings growth.
General Motors Global Delivery Trends
(Source: investor.gm.com)
- The delivery performance data from General Motors (GM) demonstrates that the company achieves its strategic objectives through controlled delivery growth and its distribution network across various regions.
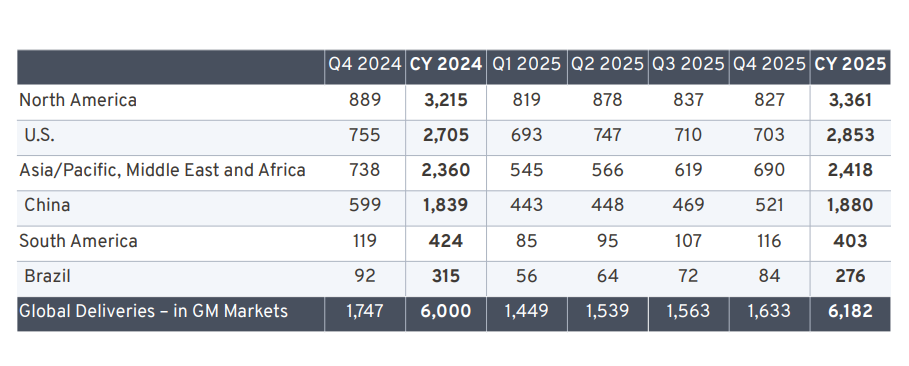
- GM achieved 6.0 million global deliveries in CY 2024, with 3.215 million units (approximately 53.6%) coming from North America, which established itself as the principal revenue source.
- The United States market delivered 2.705 million units, which represented approximately 84% of North America’s total volume, thus demonstrating strong domestic market demand and pricing control.
- The forecast for CY 2025 shows that total shipments will increase to 6.182 million units, which represents a 3.0% year-over-year increase.
- The North American market maintains stability with 3.361 million units, while the United States market shows a slight increase to 2.853 million units, which strengthens its position as the top market share holder.
- The Asia/Pacific and Middle East and Africa (APMEA) region is expected to expand from 2.36 million to 2.418 million, primarily due to China’s growth, which will account for approximately 1.88 million units that represent over 77% of APMEA volume.
- The quarterly data indicate that the company will experience continuous growth until 2025, when it will reach its highest point of 1.633 million deliveries during the fourth quarter because of seasonal customer demand and better supply chain operations.
- The South American market shows a minor decline from 424K to 403K, while Brazil’s market decreases to 276K, which demonstrates the impact of economic challenges.
- The delivery performance of GM worldwide, combined with its delivery practices to specific regions and its reliance on China for operations, produces essential indicators that determine its short-term forecast of the automotive market.
General Motors Digital Revenue Surge and Multi-Powertrain Growth Strategy
- General Motors operates as a hybrid industrial-tech company that uses digital services, electric vehicle expansion, and durable internal combustion engine systems to achieve business growth.
- The most important metric for OnStar shows that deferred revenue reached USD 5.4 billion in 2025, and this amount will increase to approximately USD 7.5 billion in 2026, which demonstrates the company’s ability to generate recurring revenues through its software products.
- The company expects to reach 12 million subscribers in 2025 and more than 13 million subscribers in 2026, which generates software-like profit margins for the business.
- Super Cruise serves as a primary growth driver that has gained over 620000 subscribers, which represents an 80% annual growth rate since its launch and generated USD 234 million in sales, which will reach USD 400 million by 2026.
- The pre-owned vehicle market shows a 40 % attachment rate, which demonstrates that customers stay with the brand while they choose to buy additional products from the company.
- GM operates in the automotive market with a balanced portfolio strategy that demonstrates its business capability.
- The Chevrolet Silverado achieved its highest sales performance in five years, which helped drive a 3% annual sales growth for internal combustion engine vehicles. GMC experienced a 6 % year-on-year sales increase, which led to its highest market share achievements.
- The automotive industry shows a 48 % annual growth rate for electric vehicle sales, which helps GM maintain its second position in the market.
- Cadillac and Chevrolet reached their highest electric vehicle sales achievements, which strengthened their electric vehicle development efforts despite facing regulatory challenges.
General Motors EV Economics
- General Motors operates as the main force that drives electric vehicle (EV) cost reduction.
- The three elements of battery economics, policy incentives, and production scale together create the framework that determines the long-term profitability of the business.
- The industry has already surpassed its vital threshold because battery costs have reached USD 100 per kilowatt-hour. Global lithium-ion battery pack prices will drop to about USD 90 per kilowatt-hour in 2025, which creates an earlier market entrance than previously anticipated.
- GM’s Ultium system pursued the target of USD 87 per kilowatt-hour because it wanted to establish itself as the leading cost provider through its NCMA battery technology and manufacturing processes, which included full production capacity.
- The company faces obvious difficulties with its operational work. GM’s Ultium Cells network operates from its two main production sites in Ohio, with 41 GWh capacity, and Tennessee, with 50 GWh capacity.
- The plant has a theoretical capacity to produce between 350000 and 500000 electric vehicles each year.
- In 2025, actual usage reached 80% in Ohio, 32.8 GWh, and 40% in Tennessee, 20 GWh, which resulted in 52.8 GWh total output.
- The Tennessee plant will start making LFP batteries, which use lithium iron phosphate technology, through a USD 70 million investment. The company will begin producing LFP batteries in Tennessee to meet market needs in energy storage and AI data centres by 2026.
- The company uses this strategy to develop its business through portfolio diversification, which helps it reduce its dependence on electric vehicle sales while it enters new high-demand markets.
- The NCMA production network in Ohio will streamline production processes, yet it will create dangers because all production happens at one location.
- The Inflation Reduction Act enabled GM to receive Section 45X manufacturing credits, which provided it with credits valued at USD 45 per kWh.
- The credits helped GM reduce its manufacturing expenses while making its batteries more affordable.
- The complete loss of the USD 7,500 EV consumer tax credit caused an extreme market demand shock. The EV market experienced a sales increase, which reached 66,501 units during Q3 2025, but later fell 43% from the previous year to about 25,000 units in Q4. This pattern demonstrates how government policies create unpredictable market demand fluctuations.
- The financial effects created a major impact. GM reported USD 7.9 billion in electric vehicle costs for 2025, which included USD 4.2 billion for supplier settlements and USD 1.8 billion for asset impairments.
- These costs resulted in net margins decreasing to 1.5% while EBIT margins dropped to 6.9%. GM’s ICE division maintained its strong performance, which produced USD 2.2 billion in EBIT during Q4 while achieving 6.1% margins. This development established the division as a key source of cash flow for the company.
- GM plans to develop LMR (lithium manganese-rich) batteries, which they will introduce by 2028, because they want to decrease their dependence on expensive cobalt and nickel materials.
- Industry forecasts predict that battery prices will continue to decline until they reach approximately USD 61 per kilowatt-hour by the year 2030. This prediction matches GM’s battery price limit of USD 70 per kilowatt-hour, which will allow their electric vehicles to achieve enduring profitability.
GM vs. Tesla and Ford (2026 Market Share)
| Brand / Group | 2025 U.S. EV Sales (units) | 2024 U.S. EV Sales (units) | YoY Change | 2025 U.S. EV Market Share | 2024 U.S. EV Market Share |
| Tesla | ~589,000. | ~634,000. | –7% | 46%. | 48.7% |
| GM (group total) | 169,887. | 114,426. | 0.48 | 13.2%. | 8.8% |
| — Chevrolet | ~92,000. | ~68,000. | 0.35 | 7.2%. | 5.2%. |
| — Cadillac | ~49,000. | ~29,000. | 0.69 | 3.8%. | 2.2%. |
| Ford Motor Co. | 84,113. | ~97,603. | –14% | 6.6%. | 7.5%. |
| Hyundai-Kia (group) | ~104,000 (est.). | ~81,000 (est.) | ~+28% | 8.6%. | ~6.4% (est.) |
| Volkswagen Group | 72,000+. | ~48,000. | ~+50% | 5.6%. | 3.7%. |
| Total U.S. BEV market | ~1,28 M (est.). | ~1.32M. | ~–2% | 7.7% of total new-car mkt (full yr avg). | ~7.5% of the total market. |
Conclusion
General Motors’ 2025 performance shows the company at a difficult point because it needs to move toward electric vehicles and digital transportation, yet it still operates its traditional services. The company experienced a decrease in profit despite maintaining steady revenue because it spent money on electric vehicle investments and restructuring activities, and encountered declining profit margins. The company showed its ability to recover from challenges through its robust performance in North American markets, its increasing software-based revenue streams, and its rising electric vehicle sales.
The company has established a mixed approach that combines traditional combustion engines with electric vehicles and digital products to drive its future development. GM needs to achieve better electric vehicle manufacturing cost performance, production capacity expansion, and cash flow management for its technology ecosystem to support sustainable business growth and shareholder returns in 2026.
FAQ
GM reported USD 182.4 billion in revenue in 2025, which showed a small decline of 1.3% compared to the previous year.
Profits fell because EV-related costs, restructuring charges, and margin pressure existed despite the company having stable revenue.
GM plans to deliver approximately 6.18 million vehicles worldwide during the 2025 fiscal year.
GM focuses on three main goals, which include reducing battery costs, increasing electric vehicle production capacity, and developing its Ultium platform.
Digital services such as OnStar drive business expansion for GM, which expects to achieve USD 7.5 billion in revenue during 2026.