


Introduction
Stellantis Statistics: The period between 2025 and 2026 brought both transformative changes and turbulent times to Stellantis N.V. The company experienced significant financial fluctuations because it had to deal with macroeconomic challenges while it restructured its operations and changed its electric vehicle strategy. The company maintained stable revenue streams, although its profits suffered major losses because of write-downs and changes in the market. Stellantis showed its ability to overcome challenges when it achieved better results in the second half of the year through increased product shipments and product development progress.
The company develops electric vehicles, hybrid vehicles, and internal combustion engine vehicles because it wants to meet the changing needs of customers and comply with government regulations. Stellantis concentrates on three objectives, which include profit restoration, operational improvement, and long-term sustainable development as it approaches the year 2026.
The article highlights key Stellantis statistics and 2025 financial data, offering investors, revenue analysts, and cash outflow enthusiasts a comprehensive view of the company’s financial performance and position.
Editor’s Choice
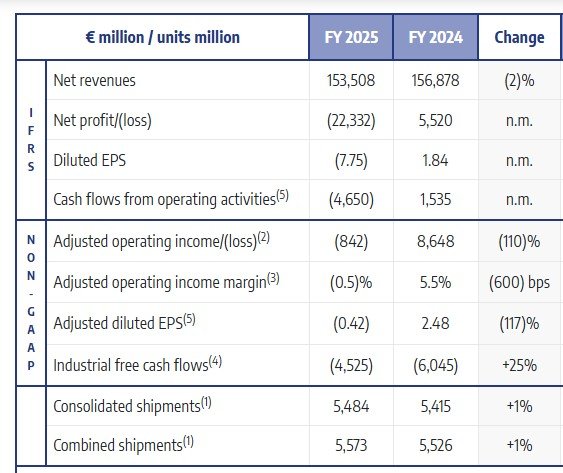
- Net revenues declined 2% YoY to €153.5B, showing top-line stability.
- Stellantis reported a net loss of €22.3B vs €5.5B profit in FY2024.
- The company experienced a decline in operating income, which reached -€842 million after it recorded €8.6 billion before the decrease.
- The company experienced a sharp decrease in operating margin, which dropped from 5.5% to -0.5%.
- The company experienced a cash flow loss, which reached -€4.65 billion compared to its previous cash flow of €1.53 billion.
- Industrial free cash flow improved by 25%, but the company still experienced a cash outflow of -€4.5 billion.
- The company spent €9.09 billion on capital expenditures and research and development, which represents a 15.5% decrease compared to the previous year.
- The company experienced a slight increase in total shipments, which rose by 1% across all countries.
- North American shipments increased by 3% to reach 1.47 million units.
- The volume of shipments from Europe decreased by 3%, reaching 2.49 million units.
- The volume of South American shipments increased by 10% to reach 1 million units.
- The Middle East and Africa region experienced a 7% increase in shipments, reaching 453,000 units.
- Maserati shipments experienced a 30% decrease, reaching 7,900 units.
- Total worldwide sales experienced a decline of 2.1%, reaching 5.57 million units.
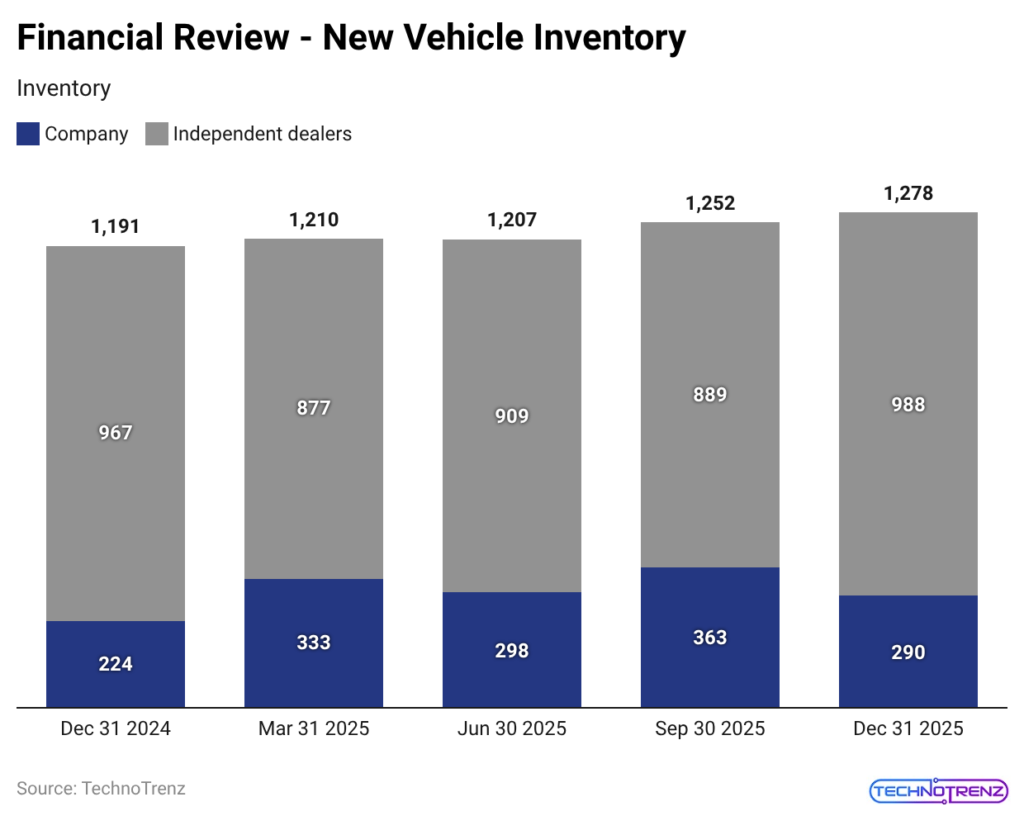
- The company experienced a 7.3% inventory increase, which reached 1.28 million units.
Stellantis Financial Performance
(Source: Stellantis.com)
- The fiscal year 2025 financial results of Stellantis demonstrate that their income sources maintain stability, while their ability to generate profits has declined.
- The net revenues decreased by 2 %, which brought total earnings to €153.5 billion. The company experienced stable demand levels, which it reported to its investors throughout the year despite facing macroeconomic challenges.
- The actual financial situation shows an earnings downturn because the company experienced a net loss of €22.3 billion while the previous year had delivered a €5.5 billion profit.
- The result of this financial performance negatively impacted diluted EPS, which dropped from €1.84 to -€7.75.
- The company experienced an operating income decline, which decreased from €8.6 billion to -€842 million. This operating income decline led to a decrease in operating margin, which reached -0.5% from 5.5% (a drop of 600 basis points)-this operational decrease stands as an essential warning sign to investors who monitor profitability trends and expense management abilities.
- The adjusted diluted EPS experienced a 117% decrease, which showed how earnings pressure had intensified.
- The cash flow patterns demonstrate increasing financial distress. The company experienced negative operating cash flow, which reached -€4.65 billion.
- The company experienced a 25% year-over-year improvement in its industrial free cash flow, which still remained in negative territory at -€4.5 billion.
- The capital allocation changes provided the company with partial relief from its financial difficulties.
- The company maintained stable shipment levels while its combined shipments and consolidated shipments increased by 1%. This increase demonstrated that customer demand and shipment capacity remained consistent.
- The financial performance of Stellantis maintains stable top-line revenue but experiences substantial net income declines.
- The decline occurs because of reduced profit margins, insufficient cash flow, and internal process deficiencies. Investors need to track these performance indicators in their upcoming assessments.
Stellantis Cash Flow Transformation
(Source: Stellantis.com)
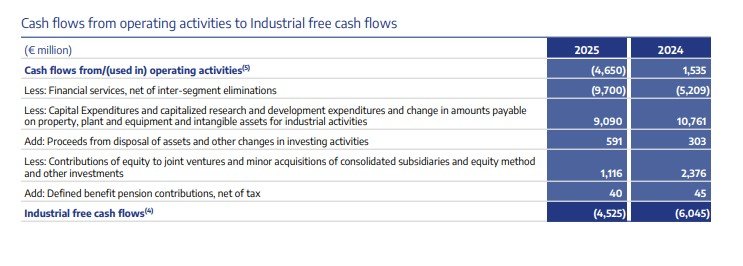
- The cash flow results of Stellantis in 2025 show an abrupt transformation from its operating cash flow and industrial free cash flow (IFCF) results because the company faces greater financial obligations.
- The company recorded an operating cash flow of €(4,650) million for 2025, which represented a complete turnaround from its previous year’s figure of €1,535 million and resulted in a €6.2 billion decrease.
- The organization experiences stricter financial circumstances because it needs more funds to support its daily operations.
- The financial services sector created a significant obstacle, which expanded its losses to €(9,700) million because of increased costs from inter-segment eliminations and debt payment obligations.
- The company maintains high levels of capital expenditures and research and development spending because it allocated €9,090 million for these purposes, which represents a 15.5% decrease from the previous year’s amount of €10,761 million, while the company continues to implement cost control measures.
- The company generated €591 million in asset sale proceeds, which represents a near doubling of asset sales since 2021 and demonstrates the effectiveness of its selective asset sale approach.
- The company reduced its equity contributions and acquisitions to €1,116 million, which shows that the company will pursue its expansion plans more conservatively.
- Industrial free cash flow reached €(4,525) million, which shows an improvement from 2024 when the figure reached €(6,045) million because the company achieved a 25% recovery, which still remained below zero.
- Stellantis currently experiences a transitional period where it must choose between funding new technologies or achieving immediate financial stability through improved cash flow operations.
Stellantis 2025 Global Segment Performance
The 2025 full-year performance of Stellantis highlights a transitional year marked by regional divergence, margin compression, and macroeconomic headwinds. The company experienced volume growth in some areas, but its profits declined across most regions because of pricing pressure, foreign exchange fluctuations, and structural cost problems.
North America
- North America experienced a 3% increase in shipments, which reached 1.47 million units, because of strong demand for Ram light-duty trucks and Jeep Wrangler and Gladiator models.
- The company experienced a 4% decrease in net revenues, which dropped to €60.9 billion because of increased incentive costs and negative currency effects from the strong U.S. dollar.
- The adjusted operating income (AOI) turned into a €1.9 billion loss after the previous year’s €2.6 billion profit, which caused a -3.1% negative margin.
- The company experienced a €4.5 billion profit decline because tariff pressures, warranty cost revisions, and product mix deterioration negated retail demand.
Europe
- The Enlarged Europe segment also faced contraction because shipments decreased by 3% to 2.49 million units.
- The decline of legacy models from Peugeot, Opel, and Fiat led to significant volume declines, although new products such as the Opel/Vauxhall Frontera helped to decrease this impact.
- The company experienced a 2% revenue decline, which resulted in €57.7 billion in revenue, while AOI decreased by €3.1 billion to reach a loss of €651 million.
- The margin compression, which decreased from 4.1% to -1.1%, was due to increased competition and pricing pressure and higher industrial costs, especially for warranty and regulatory compliance with light commercial vehicles (LCVs).
Middle East and Africa
- The Middle East and Africa region has shown volume stability through Stellantis, which achieved total shipments of 453000 units after a 7 % shipment increase.
- The company experienced a 4 % revenue decline, which resulted in €9.7 billion in revenue because of heavy Turkish lira currency depreciation.
- A €472 million decline in AOI, which reached €1.4 billion, and its profit margins decreased to 14.7 %.
- The region demonstrates how emerging market profitability gets affected by foreign exchange fluctuations despite strong pricing methods.
South America
- South America emerged as a volume growth engine, with shipments rising 10% to 1 million units, led by Argentina, Brazil, and Chile.
- Revenues grew modestly by 2% to €16.2 billion, yet AOI declined by €309 million to €2.0 billion.
- The cost structures and pricing power of Brazilian and Argentine companies experienced major impacts from currency devaluation, which resulted in a margin decline to 12.1%.
- The region remains one of Stellantis’ most profitable areas because of its advantageous volume combination and tax credit advantages.
China, India, and the Asia Pacific
- The China, India & Asia Pacific segment maintained volume stability at 61000 units while generating substantial profit growth.
- The company achieved a profit of €74 million after losing €58 million in the previous period, which raised its profit margin to 4.0 %.
- The company achieved recovery through better product mix and cost management, together with increased sales of Ram products,s which indicated that its operations began to recover in a difficult business environment.
Maserati
- The Maserati luxury division experienced a major contraction. The company experienced a 30% decrease in shipments, which brought total units shipped down to 7900, and its revenue dropped by 30% to €726 million.
- The company experienced a slight reduction in losses, which reached €198 million, while its profit margins continued to remain at -27.3%.
- The premium market faces structural problems because of weak Chinese demand, smaller product offerings, and decreased interest in luxury vehicles.
- Stellantis’ 2025 performance reflects a complex interplay of foreign exchange headwinds, pricing pressure, tariff impacts, and cost inflation.
- The global shipments showed selective growth, and profitability erosion across key markets signals the need for stronger cost discipline, portfolio optimization, and electrification-led innovation.
- The company’s ability to stabilize margins in 2026 will depend on navigating macroeconomic uncertainty while accelerating its transition toward high-margin, sustainable mobility solutions.
Stellantis Inventory
(Reference: Stellantis.com)
- The inventory pattern at Stellantis shows how the company maintains production control while enhancing its dealer network throughout the years 2024 to 2025.
- The total inventory increases from 1,191k units in December 2024 to an estimated 1,278k units by December 2025, which results in a 7.3 % year-over-year increase that shows supply chain operations return to normal.
- A basic essential point reveals how company inventory levels differ from the inventory that independent dealers maintain.
- The company’s inventory reached its highest point at 363k units during September 2025, which represents a 62% rise from the 224k units recorded in December 2024, indicating that the company has actively built up its inventory to handle unpredictable demand or to prepare for upcoming product releases.
- The dealer inventory system experiences changes as it moves between 877k units in March 2025 and 988k units by December 2025 through improved distribution methods.
- The total inventory shows a minor decrease from March to June 2025, moving from 1,210k units to 1,207k units, which suggests that the company has achieved better product distribution.
- The inventory increased to 1,252k units during September 2025, which shows that the company used inventory to prepare for special events or seasonal demands.
- Stellantis demonstrates its changing inventory control process through its current inventory practices, together with its product growth trends and distribution methods.
- The data shows that the company prepares for future demand while establishing operational flexibility within its dealer network, which represents a crucial competitive edge in the modern automotive market.
Stellantis Global Sales Performance
(Source: Stellantis.com)
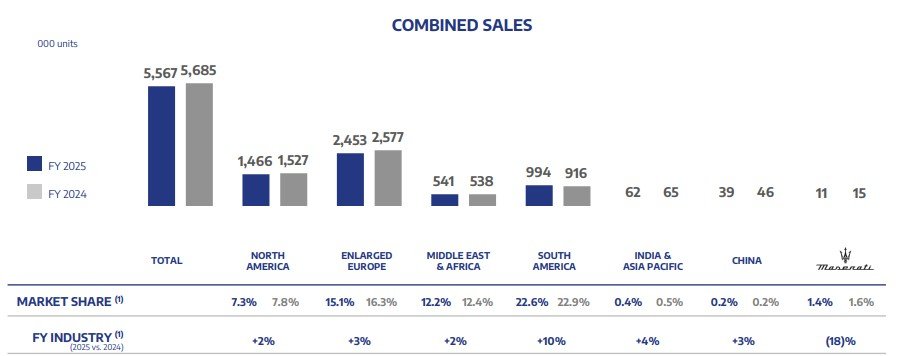
- Stellantis’ fiscal year 2025 total sales distribution across international markets shows both positive and negative results, which reveal strategic insights about the company.
- The total sales dropped from 5,685k units in FY2024 to 5,567k units in FY2025, which represents a -2.1% annual decrease that shows reduced demand because of changing economic conditions.
- North America experienced decreased sales, which dropped from 1,527k to 1,466k units (-4.0%) because of declining customer interest and potential inventory adjustments. The market share of Enlarged Europe remained stable at 15.1%, yet the market experienced a 4.8% decline, which brought sales down from 2,577k to 2,453k units through intense competition in a crowded market.
- South America achieved growth through its market expansion, which led to increased sales from 916k to 994k units because of its strong market share of 22.6%, which exceeded the industry growth rate of 10%.
- The Middle East & Africa region reported a small increase of +0.6%, while India & Asia Pacific and China experienced slight decreases, which demonstrate the persistent difficulties faced by Asian markets.
- Maserati experienced a decline in production volume, which dropped from 15k to 11k units (-26.7%) because of increased competition in the luxury market.
- Stellantis uses its sales performance together with its regional business operations and market share distribution to handle inconsistent worldwide demand while focusing on areas with high expansion potential.
- The data shows that the company has redirected its strategic focus toward developing markets while establishing new business areas and enhancing operational performance to maintain its competitive edge.
Conclusion
Stellantis Statistics: The company experienced its most difficult year in 2025, which brought both operational difficulties and financial challenges, but the business managed to maintain its revenue stream through the entire year. The company now operates at a net loss because of decreasing profit margins and increased operating costs, which result from its ongoing strategic changes. Demand for products remained strong because shipment numbers increased, and South America and other markets showed successful outcomes.
The company maintains its commitment to spend on both electrification and research while it controls its capital expenditures. The company faces immediate operational difficulties because of its growing inventory and its reduction in cash. Stellantis achieves recovery because its worldwide operations and its ability to produce different types of engines enable the company to recover from its present financial difficulties. The company needs to achieve two goals: its profit margins must become stable, and its cash flow needs to show improvement.
FAQ
The company experienced financial losses because its profit margins decreased, and it needed to reorganize, and it had to write off some of its assets. The company experienced financial losses because its profit margins decreased, and it needed to reorganize, and it had to write off some of its assets.
The company experienced stable revenue, but its total revenue decreased by 2 % to reach €153.5 billion. The company experienced stable revenue, but its total revenue decreased by 2% to reach €153.5 billion.
South America showed the strongest growth with an 8.5–10% increase in volumes.
The company experienced negative operating cash flow, which reached -€4.65 billion because of its increased expenditures and capital investments.
Global sales dropped by 2.1 % while different regions showed different sales results.