


Disclaimer: This press release/article is provided by a third party, which is solely responsible for its content. Readers are advised to independently verify all information and do their research before acting on it or investing any money. CoinLaw is not responsible for any financial loss that may result from reliance on this content.
This press release/article is provided by a third party, which is solely responsible for its content. Readers are advised to independently verify all information and do their research before acting on it or investing any money. CoinLaw is not responsible for any financial loss that may result from reliance on this content.
Introduction
Honda Statistics: Honda Motor Co., Ltd. entered 2025–2026 experiencing a major transition, which resulted from electrification difficulties, changing regional customer needs, and global economic factors. The company operates worldwide because it sells automobiles, motorcycles, and power equipment, yet its financial results and operational efficiency show inconsistent performance. The business faced profit challenges because of decreasing EV demand and increasing competition in China and tariff costs, yet its motorcycle and hybrid vehicle segments delivered consistent revenue.
Honda operates as a major automotive company that employs more than 190000 workers worldwide and conducts business throughout North America, Asia, and Europe while shifting its business strategy to focus on hybrid vehicles and cost-effective electric vehicle production. This article will show Honda statistics, including the global production, revenue, sales, and regional growth.
Editor’s Choice
- Honda’s global production declined 5.0% YoY to 270,008 units in February 2026.
- Japan production surged 108.7% YoY to 67,550 units, contributing ~25% of total output.
- Overseas production fell 8.8% YoY to 202,458 units, still accounting for ~75% share.
- North America production increased 4.8% YoY to 141,631 units, leading global output.
- U.S. production rose 6.1% YoY to 90,377 units, representing ~64% of regional volume.
- Asia production declined sharply 34.9% YoY to 50,445 units, reflecting demand weakness.
- China’s output dropped 25.7% YoY to 26,649 units, highlighting competitive pressure.
- Japan auto sales decreased 5.2% YoY to 54,415 units in February 2026.
- Registrations fell 8.2% YoY to 30,085 units, indicating cautious consumer demand.
- Mini-vehicle sales declined marginally 1.2% YoY to 24,330 units, with ~44.7% share.
- Exports surged 199.3% YoY to 8,974 units.
- Europe exports jumped 335.8% YoY to 4,100 units, contributing ~45.7% of total exports.
- Honda’s total revenue grew 28.3% to ¥21,688.7 billion from FY2023 to FY2025.
- The automobile segment contributed ¥14,169.2 billion (~65.3%) of total revenue in FY2025.
- Equity-method investments rose 3% to ¥1,242.6 billion, while undistributed earnings fell 35% to ¥256.0 billion.
Honda Global Production
(Source: global.honda)
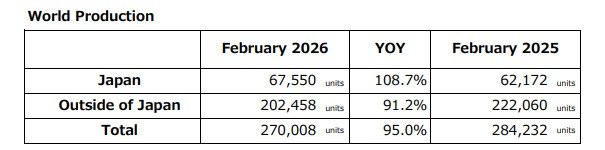
- Honda’s February 2026 production data reflects a nuanced global performance shaped by regional divergence and demand recalibration.
- Total output reached 270,008 units, marking a 5.0% year-over-year (YoY) decline from 284,232 units in February 2025—signaling a mild contraction in overall manufacturing momentum.
- A key highlight is Japan’s domestic production surged, which climbed to 67,550 units, delivering a robust +108.7% YoY growth. This sharp increase suggests strategic localization, improved supply chain stability, or stronger domestic demand recovery.
- Japan now contributes approximately 25% of total global production, a notable rise compared to prior periods.
- Conversely, production outside Japan dropped to 202,458 units, reflecting a -8.8% YoY decline. This segment still dominates with roughly 75% share, but the contraction may indicate softer international demand, geopolitical headwinds, or inventory normalization across key markets.
- The production gap between domestic and overseas markets is narrowing, hinting at a potential rebalancing strategy.
Honda Global Production By Region
(Source: global.honda)
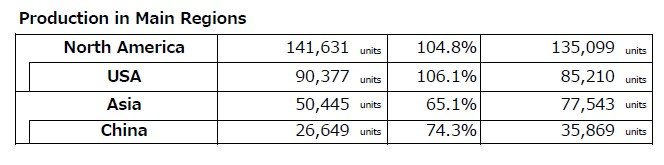
- The Honda production data from February 2026 shows that the company operates in different regions while adjusting its production based on customer needs.
- North America functions as the main production base because it produced 141631 units, which showed a 4.8 % annual growth from 135099 units.
- The regional development shows that consumer demand remains stable while supply chains operate effectively and dealerships maintain high sales rates.
- The USA functions as the main driver for this cluster, which produced 90377 units after experiencing a 6.1 % annual growth.
- The U.S. manufacturing base produces almost 64% of North American output, which establishes the country as a vital element in Honda’s international production system.
- The upward trend in this data shows North America auto production, U.S. vehicle output growth, and Honda regional performance through the use of these particular keywords.
- Asian production exhibits a complete decline, which results in output reduction to 50445 units because of a major annual decrease of 34.9 %.
- The Chinese manufacturing industry showed a major decrease when its output decreased to 26649 units, which represents a 25.7 % annual decline.
- The two data sets indicate that market demand has decreased while businesses face more competition and Asian markets experience regulatory and economic challenges.
- North America has become the main source of regional output while Asian production has decreased. Honda can use this situation to move its production facilities and sales operations to achieve a better global balance.
Honda Japan Auto Sales
(Source: global.honda)
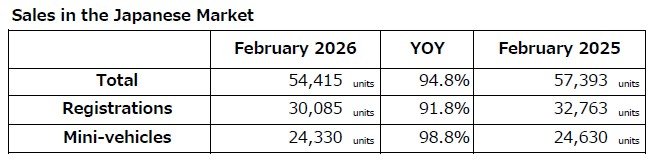
- The Japanese automotive market experienced a complex market contraction during February 2026 through Honda’s sales performance, which showed demand patterns beginning to stabilize.
- Total sales reached 54,415 units, marking a 5.2% year-over-year (YoY) decline from 57,393 units in February 2025.
- The industry faces multiple challenges because customer behavior has changed, and businesses have restarted their supply networks while economic conditions have weakened.
- The analysis shows that vehicle registrations, which serve as an essential measurement of new vehicle demand, reached 30,085 units, which experienced a 8.2% YoY decline. This development shows that consumers spend money with caution while they choose to postpone their purchases because inflation costs and new transportation options have emerged.
- The mini-vehicle segment (kei cars) experienced modest growth through its 24,330 unit total, which showed a 1.2% YoY decline. This segment continues to benefit from strong urban demand, fuel efficiency advantages, and favorable tax structures—key drivers in Japan’s compact car market.
- Honda has established mini-vehicles as a vital part of its business because they make up 44.7% of its total sales.
- The core segment still holds dominance, but its strength has decreased, according to the 55.3% contribution from registrations.
- The Japanese automotive market will enter a new period, which will benefit businesses that use affordable vehicles and compact mobility solutions to gain a market advantage.
Honda Export Momentum
(Source: global.honda)
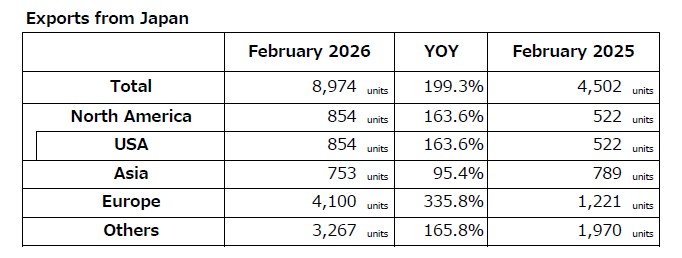
- The February 2026 export performance from Japan shows that Honda has achieved record export levels, which increased to 8974 units through a 1993 % growth rate compared to the previous year’s results.
- The international automotive markets have recovered through enhanced supply chain management, which serves as the main factor driving export growth.
- Europe stands out as the primary growth center for the region because its exports have increased to 4100 units, which represents a 3358 % growth compared to the previous year.
- The European automotive market shows renewed interest in Honda vehicles because customers now prefer models that meet stricter emission standards and deliver better fuel efficiency.
- The USA market generated all export growth because North American exports increased to 854 units, which represents a 636 % year-on-year increase.
- The USA market generated all export growth because North American exports reached 854 units, which represents a 636 % year-on-year increase, while showing constant consumer demand for Honda products.
- The Asian market showed a small decrease in exports because 753 units were sent out, which showed a 46% year-on-year drop.
- The Others category achieved strong expansion because it reached 3267 units, which represents a 658% growth compared to the previous year.
- Emerging markets show increasing demand, which business leaders use to expand their business operations into new territories.
- Europe now accounts for 45.7 % of total exports, while Other countries account for 36.4 % of total exports. This distribution shows that Honda has changed its international export distribution to focus on different geographical regions.
- The data demonstrates how Honda is expanding its operations worldwide while moving its focus to international markets that show the highest growth potential.
Honda Motor Co., Ltd. Global Fuel Economy and CO₂ Regulations
- The new fuel economy standards and CO₂ emission rules that various countries, including Japan, the United States, Canada, and European nations, have introduced compel Honda Motor Co., Ltd. to alter its business strategy.
- Japanese laws have developed through their organized and ambitious approach toward future regulations.
- The 2020 fuel economy standards required a 19.6% increase from 2015 standards, whereas 2030 targets under the Corporate Average Fuel Economy (CAFE) system demand a 32.4% increase from 2016 benchmarks.
- Japan’s Green Growth Strategy aims to achieve 100% electrified passenger vehicle sales by 2035 through its goal of including battery electric vehicles (BEVs), fuel cell vehicles (FCEVs), and hybrids.
- The implementation of WLTP/WLTC testing standards enables manufacturers to achieve better transparency and precise measurement of real-world performance, which drives them to develop more efficient powertrain systems and hybrid technologies.
- The United States system of regulations has become unstable throughout its history, but it maintains its strong influence on policies.
- The original goals established 54.5 MPG as the target for fuel efficiency and 163 g CO₂ emissions per mile for the year 2025, but the SAFE Vehicles Rule (2021-2026), which updated existing policies, lowered the annual efficiency targets to 1.5%.
- The latest EPA and NHTSA updates have introduced more stringent standards, which mandate a fuel efficiency target of approximately 49 MPG for 2026 and an 85 g CO₂ per mile requirement for the year 2032.
- The proposed CAFE standards of approximately 57.8 MPG for 2032 indicate that regulations will become stricter over time.
- California’s ZEV mandate, which requires all vehicles to become zero-emission by 203,5 establishes additional regulatory challenges that federal policies cannot control.
- Canada is implementing standards that closely match U.S. and California requirements, which strengthens North American standardization.
- National mandates require ZEV sales penetration of 20% by 2026, 60% by 2030, and 100% by 2035, while Quebec’s aggressive targets—32.5% in 2025 and 85% by 2030—position it as a regional leader in EV adoption policy. These frameworks accelerate market electrification and infrastructure development, which automakers require to implement their regional plans.
- The EU established its fleet-wide CO₂ emission target at 95 g CO₂/km which has since evolved into deeper cuts of -15% by 2025 and -37.5% by 2030 (vs. 2021 levels).
- The ZEV benchmarks require 15% compliance by 2025 and 35% compliance by 2030, which will drive the development of low-emission transportation solutions.
- The transition from NEDC to WLTP testing further tightens compliance, which requires automakers to optimize real-world emissions performance.
- Honda needs to increase its spending on electric vehicle platforms, together with hybrid systems, hydrogen fuel cells, and battery technology, because of international regulations.
- Businesses need to follow compliance requirements because they have become essential for gaining market advantage, which affects which products to develop, how much research funds to invest, and which markets to target for reaching future income goals in the automotive industry.
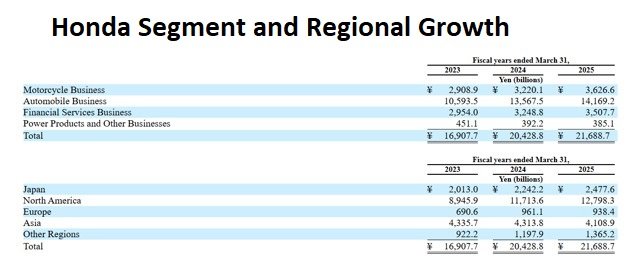
Honda Segment and Regional Growth Trends (FY2023–FY2025)
(Source: global.honda)
- The operational performance of Honda Motor Co. shows substantial growth across its two business units, which operate worldwide markets throughout three fiscal years that conclude on March 31 2025.
- The company’s total revenue expanded from ¥16,907.7 billion in FY2023 to ¥21,688.7 billion in FY2025, which shows an exceptional 28.3% cumulative growth due to worldwide demand, pricing control, and business operational strength.
- The Automobile Business operates as Honda’s main revenue source, which generated ¥14,169.2 billion in FY2025 to account for about 65.3% of total revenue.
- The total number increased from ¥10,593.5 billion during FY2023 because global vehicle sales surged while Honda improved its product selection and implemented electrification methods.
- Market demand for urban transportation services, which includes both emerging markets and urban mobility areas, continues to fuel the Motorcycle Business expansion, which has reached ¥3,626.6 billion after three years of growth that totaled 24.7%.
- The Financial Services Business delivered permanent revenue expansion, which led to a revenue total of ¥3,507.7 billion, while it backed two vital parts of the automotive business, which supported customer payment capacity and dealer funding needs.
- The Power Products and Other Businesses decreased in size to reach a total of ¥385.1 billion, which suggests that the company has chosen to stop certain business activities or that the market has become fully developed.
- North America generates most of Honda’s revenue, which reached ¥12,798.3 billion during fiscal year 2025, due to high-margin vehicle sales and strong consumer demand.
- Japan’s economy increased to ¥2,477.6 billion, whereas Europe showed unstable economic conditions, which reached its highest point in FY2024 before dropping to ¥938.4 billion.
- The Asian market experienced a slow drop, reaching ¥4,108.9 billion because of increasing competition and changing market conditions.
- Honda’s financial records show multiple revenue streams that generate income across various areas, but North America remains the company’s main revenue center while Honda continues to develop mobility technologies and environmentally friendly business practices.
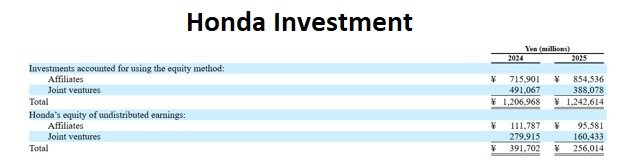
Honda Investments
(Source: global.honda)
- The 2025 investment data of Honda Motor Co. Ltd. shows that the company now invests more in equity but earns less because its undistributed earnings decrease, which results in different capital spending and partnership relationships.
- Total equity-method investments increased to ¥1,242.6 billion in 2025 from ¥1,206.9 billion in 2024 (+3%), driven primarily by a strong rise in affiliates’ valuation (¥854.5 billion, +19%).
- The organization achieved this expansion through better strategic alliances, joint technology ventures, and global partnerships, which drive progress in electrification and mobility solutions and next-generation automotive breakthroughs.
- The total value of joint venture investments decreased sharply to 388.1 billion yen, which marks a 21% decline, indicating that the company might sell its assets or pay back its investors, or that its main business partnerships, particularly in China and Southeast Asia, have become less effective.
- Honda is now shifting its investment strategy to focus on affiliates that provide better returns.
- The equity section of Honda’s undistributed earnings shows a more troubling development because it dropped 35% from ¥391.7 billion to ¥256.0 billion.
- The decline resulted from both affiliates and joint ventures because they retained less profit while paying out more dividends and facing earnings loss throughout their partnerships.
- Honda maintains a strong investment base that continues to grow, but its decreasing retained earnings indicate that the company will experience short-term profit limitations, which create a need for effective capital use and better output from its worldwide partnerships, since the automotive market becomes more competitive.
The Toyota Motor Corporation Tariff Shock 2025–2026
- Toyota’s financial results for FY2026 demonstrate revenue stability but face severe profit decline because of rising U.S. tariffs and supply chain challenges.
- Although Toyota generated strong sales growth, external policy changes created unprecedented challenges for the company’s profit margins.
- Toyota initially estimated that its FY2026 operating profit would reach ¥3.8 trillion, but tariffs worsened, so the company needed to reduce its estimate to ¥3.2 trillion.
- The total tariff burden surged to ¥1.4–¥1.45 trillion (~USD 9.5 billion)—the largest disclosed globally—highlighting the scale of exposure within the global automotive industry.
- Tariffs during Q1 FY2026 brought a cost of ¥450 billion, which created a 10.9% reduction in operating profit that resulted in North America suffering a ¥63.6 billion loss compared to the previous year’s profit of ¥100.7 billion.
- The main issue originates from Toyota’s fully established supply network, which connects all three North American countries through NAFTA and USMCA.
- The Tacoma model, which sold over 230000 cars in the United States, and the RAV4 model, which produces more than 500000 units each year in Canada, both faced significant financial damage from 25 vehicle tariffs and 50 steel and aluminium import duties.
- The Canadian RAV4 production shift to hybrid-only manufacturing resulted in increased tariff risks throughout the entire production process.
- Toyota faced higher risk exposure than Ford Motor Company, which created a USD 3 billion financial impact, and General Motors, which experienced a USD 4 to USD 5 billion impact because of its extensive need for cross-border manufacturing operations.
- Even Japanese competitors like Honda Motor Co. Ltd. faced less exposure risk, which impacted their business operations at around 450 billion yen.
- The company achieved its highest full-year revenue total of ¥50 trillion, which represents a 4.1% year-over-year increase because of its successful cost management, pricing, and marketing strategies, which helped to recover approximately ¥745 to 900 billion in tariff-derived financial losses.
- The operating profit forecast for Q3 FY2026 increased to ¥3.8 trillion, which represents an 11.8% growth because of better operational performance and favorable currency fluctuations, which resulted in a higher market value.
- North American operations reported a financial loss of ¥134.1 billion during the first half of FY2026, which represents the first regional loss since the 2008 financial crisis, which serves as a key historical reference point.
- The potential price increases for vehicles, which may happen three times during 2026, will damage Toyota’s mid-market consumer base because they want affordable products that offer good value.
- The electrification strategy of Toyota produces positive results because it maintains customer interest in its products.
- Hybrid and electrified vehicles accounted for 46.9% of global sales, which resulted in 10.5 million vehicles sold during 2025, proving Toyota’s status as the leading company in the worldwide EV and hybrid market.
- The financial performance of Toyota at FY2026 demonstrates a profitability crisis instead of a demand crisis because the company must create supply chain local operations, expand its US manufacturing facilities, and make essential strategic adjustments to function in a world where trade regulations become increasingly unpredictable.
Conclusion
Honda Motor Co., Ltd. shows two together with three separate performance paths, which create a stable period when they operate from 2025 until 2026 through their different production methods, their ability to generate revenue, and their changing market conditions. North American and domestic production operations create stability for the company, while Asian and Chinese markets show major revenue drops because of decreasing market demand and increasing competition.
The company achieves strong export growth together with its diversified business operations, which focus on automobile and motorcycle production. The company experiences dual challenges because of decreasing joint venture income and its decision to redirect capital resources.
Honda must concentrate on three key areas: hybrid leadership, electrification research, and international production and distribution to maintain its competitive edge for extended periods.
FAQ
Honda produced 270,008 units in February 2026, down 5% year-over-year.
North America leads with 141,631 units, growing 4.8% YoY.
Asia production fell 34.9% due to weak demand and rising competition, especially in China.
Honda’s revenue increased 28.3% from FY2023 to FY2025, reaching ¥21.7 trillion.
The export volume increased by 199.3% compared to the previous year, reaching 8,974 units, which was mainly driven by European markets.