


Merchants Bancorp (MBIN) posted Q1 2026 diluted EPS of $1.25, beating the consensus estimate of $1.16 by 9.6%. Revenue came in at $175.2 million, up 20.1% year-over-year and essentially in line with analyst forecasts of $175.6 million. Shares opened at $49.63 on April 29 following the earnings release, before giving back gains in subsequent after-hours and next-session movement.
About Merchants Bancorp
Merchants Bancorp (Nasdaq: MBIN) is a diversified bank holding company founded in 1990 by Michael Petrie and Randall D. Rogers, headquartered at 410 Monon Boulevard, Carmel, Indiana. The company operates through three primary business segments: Multi-family Mortgage Banking, which originates and services loans for multi-family rental housing and healthcare facility financing; Mortgage Warehousing, which funds agency-eligible loans for non-depository financial institutions; and Banking, which delivers retail, commercial, agricultural, and residential mortgage services.
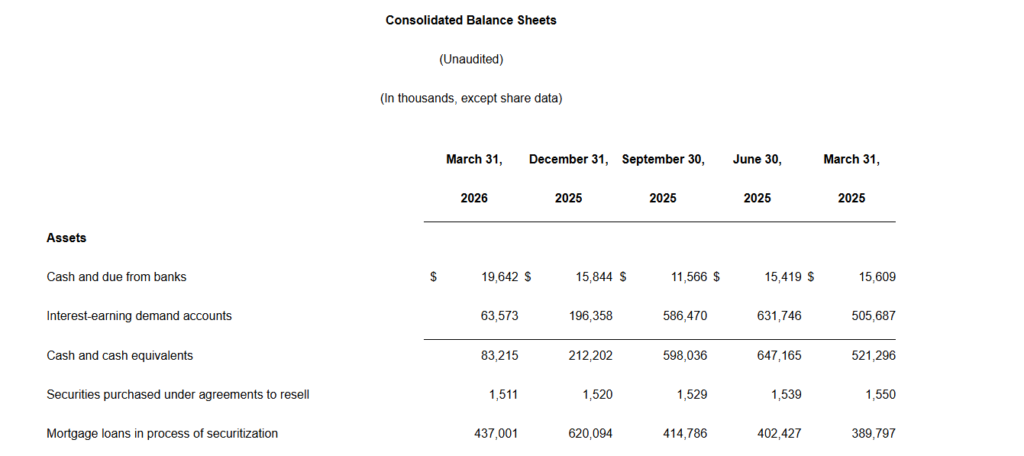
As of March 31, 2026, Merchants Bancorp reported record-high total assets of $20.3 billion and total deposits of $13.0 billion, reflecting its growing footprint in government-backed and multi-family lending. The company trades on the Nasdaq Capital Market under the ticker MBIN, with a market capitalization of approximately $2.29 billion and approximately 45.9 million shares outstanding. The company went public in October 2017, and its return on average assets stood at 1.43% for Q1 2026, with a return on average tangible common equity of 13.01%.
Top Financial Highlights
- Net income reached $67.7 million, increasing by $9.5 million or 16% compared to $58.2 million in Q1 2025.
- Diluted EPS stood at $1.25, reflecting a 34% year over year rise from $0.93, and exceeded the consensus estimate of $1.16 by 9.6%.
- Total revenue was $175.2 million, showing a 20.1% increase year over year and aligning closely with the analyst estimate of $175.6 million.
- Net interest income reached $128.6 million, up 5% from $122.2 million, though slightly below the estimate of $131.7 million by 2.3%.
- Noninterest income increased to $46.6 million, rising 97% from $23.7 million, supported by fair value adjustments to mortgage servicing rights and derivatives.
- Noninterest expense was $75.6 million, up 23% from $61.7 million, driven by higher salaries, credit risk transfer premiums, and other operating costs.
- The efficiency ratio improved to 43.2%, outperforming the analyst estimate of 45.0% by 184 basis points.
- Total assets reached a record high of $20.3 billion, reflecting an 8% year over year increase and 4% growth quarter over quarter.
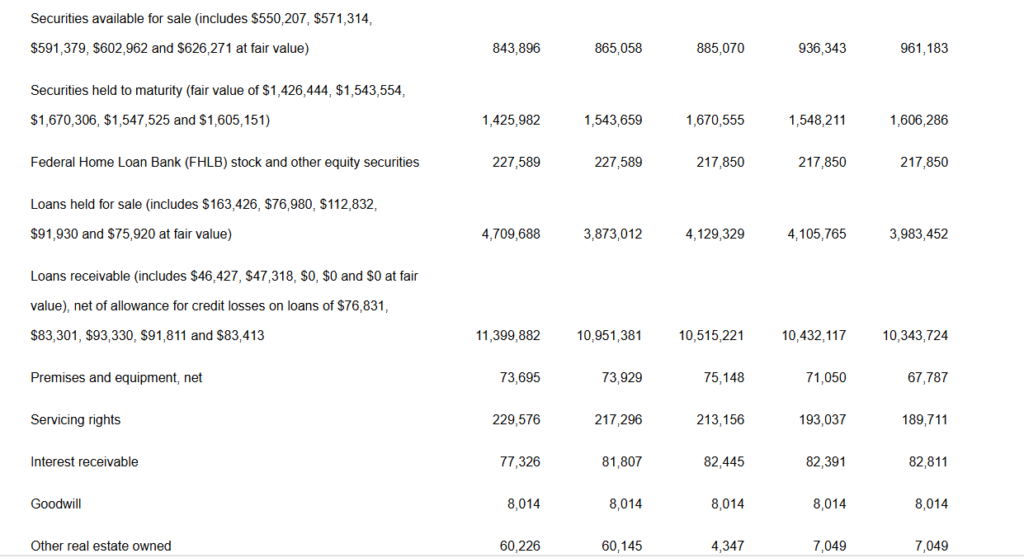
- Loans receivable stood at $11.4 billion, increasing 10% year over year and 4% sequentially.
- Total deposits were $13.0 billion, up 4%, with core deposits of $12.1 billion accounting for 93% of the total.
- Tangible book value per common share reached a record $38.55, rising 10% from $34.90 a year earlier.
- Net interest margin improved to 2.92%, up 3 basis points year over year.
- Return on average assets was 1.43%, increasing by 12 basis points compared to the previous year.
- The total capital ratio stood at 12.8%, with a Tier 1 capital ratio of 12.3%, reflecting strong financial stability.
- Liquidity was $11.1 billion, representing 55% of total assets, including $3.9 billion in unused borrowing capacity through FHLB and the Federal Reserve Discount Window.
Beat or Miss?
| Metric | Reported | Analyst Estimate | Difference / Analysis |
| Diluted EPS | $1.25 | $1.16 | +$0.09 beat (+9.6%) |
| Total Revenue (Net) | $175.2M | $175.6M | -$0.4M miss (-0.21%) – essentially in line |
| Net Interest Income | $128.6M | $131.7M | -$3.1M miss (-2.3%) |
| Net Interest Margin | 2.92% | ~2.88% (est.) | +4.5 bps beat |
| Efficiency Ratio | 43.20% | 45.00% | 184 bps beat – strong cost discipline |
| Noninterest Income | $46.6M | $44.1M | +$2.5M beat |
| Tangible Book Value/Share | $38.55 | $38.59 | In line – record high milestone achieved |
| Gain on Sale of Loans | $13.5M | $26.8M | -$13.3M miss – delayed by higher 10-year |
What Leadership Is Saying?
“Achieving record-high assets of $20.3 billion and a record tangible book value of $38.55 per share in the same quarter underscores the strength of our balance sheet and the momentum we are building. Just as important, asset quality continues to stabilize, positioning us exceptionally well as we move forward with confidence.” – Michael F. Petrie, Chairman and CEO, Merchants Bancorp
“Our results during the quarter reflected the dedication and resilience of our team. Our people remain accountable, collaborative, and disciplined in their work, reinforcing the culture that defines our organization while supporting the continued execution of our strategic plan.” – Michael J. Dunlap, President and Chief Operating Officer, Merchants Bancorp
Historical Performance
The table below compares Merchants Bancorp’s Q1 2026 results against Q1 2025 for key metrics.
| Category | Q1 2026 | Q1 2025 | Change (%) |
| Total Revenue (Net) | $175.2M | $145.9M | 20.10% |
| Net Interest Income | $128.6M | $122.2M | 5.30% |
| Noninterest Income | $46.6M | $23.7M | 96.70% |
| Net Income | $67.7M | $58.2M | 16.30% |
| Diluted EPS | $1.25 | $0.93 | 34.40% |
| Noninterest Expense | $75.6M | $61.7M | 22.50% |
| Total Assets | $20.3B | $18.8B | 8.00% |
| Net Interest Margin | 2.92% | 2.89% | +3 bps |
| Return on Avg. Assets | 1.43% | 1.31% | +12 bps |
| Provision for Credit Losses | $15.3M | $7.7M | 98.10% |
Competitor Performance: Q1 2026 vs. Q1 2025
The table below compares Merchants Bancorp against two publicly traded regional bank peers, Glacier Bancorp (GBCI) and WaFd Inc. (WAFD), for the most recently reported quarter against the year-ago period.
| Metric | MBIN Q1 2026 | MBIN Q1 2025 | YoY Change | GBCI Q1 2026 | GBCI Q1 2025 | YoY Change |
| Net Interest Income | $128.6M | $122.2M | 5.30% | $268.7M | $190.0M | 41.40% |
| Net Income | $67.7M | $58.2M | 16.30% | $82.1M | $54.6M | 50.40% |
| Noninterest Expense | $75.6M | $61.7M | 22.50% | $200.5M | N/A | N/A |
| Diluted EPS | $1.25 | $0.93 | 34.40% | $0.63 | $0.48 | 31.30% |
| Net Interest Margin | 2.92% | 2.89% | +3 bps | 3.80% | 3.04% | +76 bps |
How the Market Reacted?
Shares of Merchants Bancorp (MBIN) opened at $49.63 on April 29, 2026, the day following the earnings announcement, reflecting an initial market response to the EPS beat of $0.09 above consensus.
However, the stock gave back most of those gains in subsequent sessions, falling to approximately $45.00 by April 30, representing a decline of roughly 9.3% from recent levels. Analysts surveyed by FactSet noted that while the EPS beat was meaningful, concerns likely centered on the 98% year-over-year jump in the provision for credit losses, a 25% sequential rise in non-performing loans, and the significant shortfall in gain-on-sale of loans versus estimates.
On a more positive note, the FDIC/IDFI Memorandum of Understanding from mid-2025 was formally terminated in Q1 2026, a regulatory milestone that should provide a degree of reassurance to long-term investors about the company’s improving compliance standing
