


Strathcona Resources reported Q1 2026 oil and natural gas sales of $1.12 billion and Operating Earnings of $194 million or $0.91 per share, with Free Cash Flow of $47 million or $0.22 per share. Reported figures came in below the prior year, and no explicit analyst EPS or revenue consensus was disclosed, so after-hours movement is not available.
About Strathcona Resources Ltd.
Strathcona Resources Ltd. is a Canadian oil and gas producer listed on the Toronto Stock Exchange under the ticker SCR. The company positions itself as one of North America’s fastest growing pure play heavy oil producers, focused on thermal oil and enhanced oil recovery projects. Strathcona is headquartered in Calgary, Alberta, and operates long life assets across Cold Lake, Lloydminster Thermal, and Lloydminster Conventional regions. The business strategy centers on consolidation and development of long life, low decline heavy oil assets to drive production growth and Free Cash Flow.
Strathcona’s common shares trade in Canada, and recent trading levels around the high 30s in Canadian dollars imply a multi billion dollar market capitalization, although the exact figure is not specified in the Q1 2026 release. The company currently pays a quarterly dividend of $0.30 per share, reflecting a meaningful cash return component for shareholders. While the press release does not disclose a current P/E ratio or total employee count, it highlights guidance for approximately $1.0 billion of Free Cash Flow in 2026 at current strip pricing, underlining management’s focus on capital returns and balance sheet deleveraging.
Top Financial Highlights
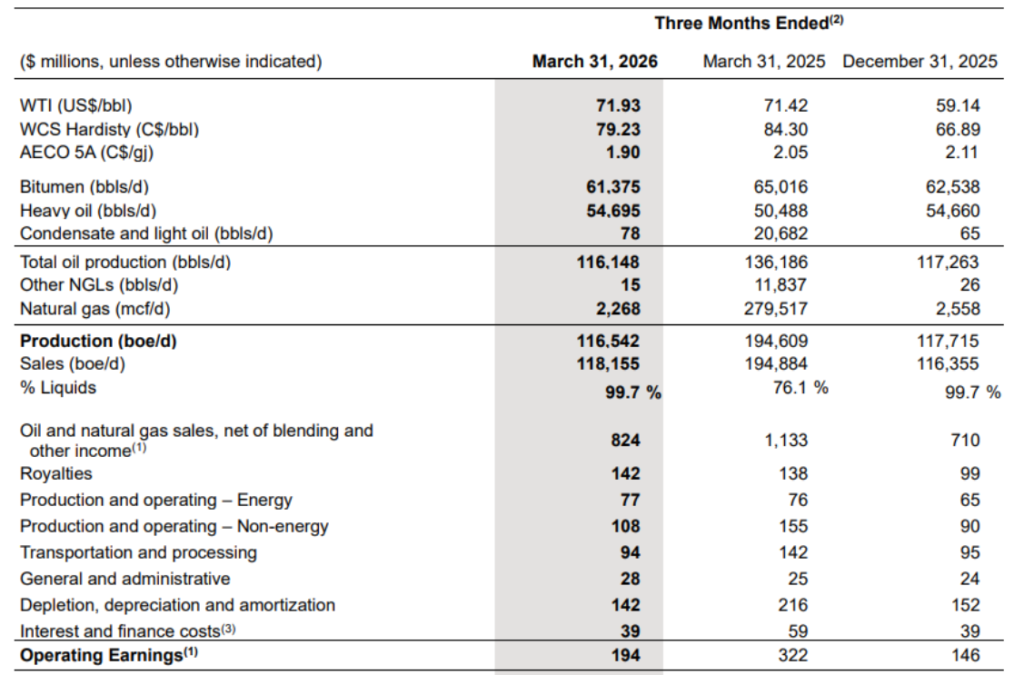
- Q1 2026 production averaged 116,542 boe/d with 99.7% liquids, broadly flat versus Q4 2025.
- Oil and natural gas sales, net of blending and other income, were $824 million, down from $1.13 billion in Q1 2025.
- Total oil and natural gas sales before blending and other items were $1.12 billion in Q1 2026 versus $1.46 billion a year earlier.
- Operating Earnings were $194 million or $0.91 per share, compared with $322 million in Q1 2025.
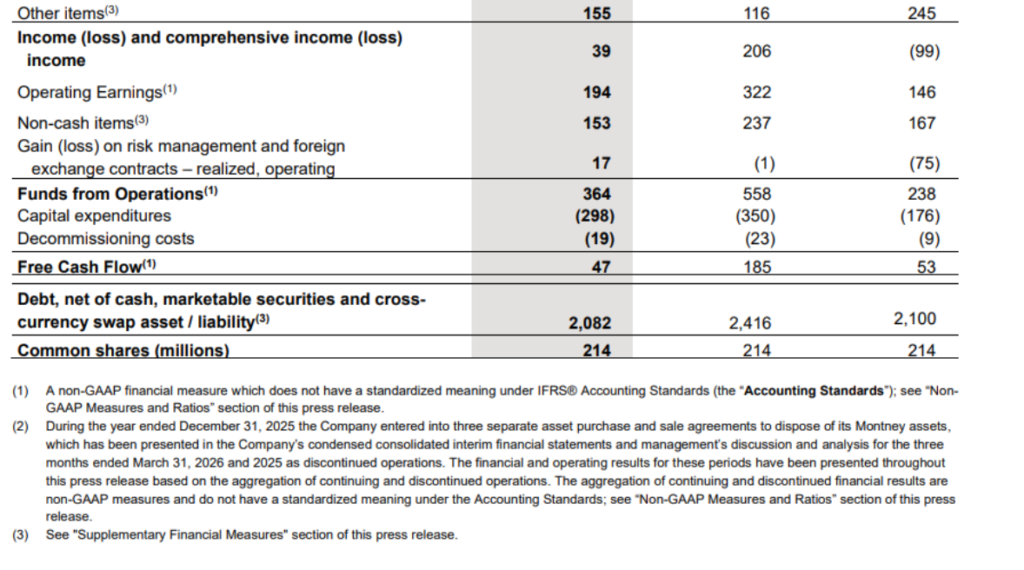
- Free Cash Flow was $47 million or $0.22 per share, versus $185 million in the prior year quarter.
- Funds from Operations totaled $364 million, down from $558 million in Q1 2025.
- Net income and comprehensive income came in at $39 million, compared with $206 million a year earlier.
- Capital expenditures were $298 million in the quarter as the 2026 capital program remained weighted to the first half of the year.
- Decommissioning costs were $19 million, compared with $23 million in Q1 2025.
- Net debt, defined as debt net of cash, marketable securities and cross currency swap position, was $2.08 billion at March 31, 2026, versus $2.42 billion at March 31, 2025.
- Heavy crude oil production averaged 54,695 bbl/d, up from 50,488 bbl/d in Q1 2025.
- Bitumen production averaged 61,375 bbl/d, slightly below 65,016 bbl/d in the prior year period.
- Total production including natural gas was 116,542 boe/d in Q1 2026 versus 194,609 boe/d a year earlier, reflecting the impact of Montney asset dispositions and discontinued operations.
- Management reaffirmed 2026 production guidance of 120 to 130 Mbbls/d and a capital budget of $1.0 billion.
- The Board declared a quarterly dividend of $0.30 per common share, payable June 17, 2026 to shareholders of record on June 8, 2026.
Beat or Miss?
Analyst consensus estimates for Q1 2026 revenue and EPS were not disclosed in the company release, and there is no explicit reference to “beating” or “missing” Street expectations. Given the decline in revenue and net income versus Q1 2025, the quarter represents a weaker year on year comparison, although Operating Earnings improved sequentially versus Q4 2025 on higher oil prices.
| Metric | Reported Q1 2026 | Difference / Analysis |
| Revenue (oil & gas sales) | $1.12 billion | Down vs $1.46 billion in Q1 2025, reflecting asset sales and lower volumes. |
| Oil & gas sales net of blending | $824 million | Declined from $1.13 billion YoY, showing softer realized revenues. |
| Operating Earnings per share | $0.91 | Down from higher Q1 2025 levels but up vs Q4 2025 on stronger pricing. |
| Free Cash Flow | $47 million | Below $185 million in Q1 2025 due to higher capex and lower funds from operations. |
| Net income | $39 million | Down sharply from $206 million a year earlier, reflecting lower revenues and other items. |
| EPS (net income basis) | N/A in release | Operating Earnings per share given, but GAAP EPS not explicitly provided. |
| Consensus revenue | N/A | No published consensus in the press release. |
| Consensus EPS | N/A | No published consensus in the press release. |
What Leadership Is Saying?
“Production for the first quarter of 2026 of 117 Mboe/d, almost entirely liquids, was in line with the fourth quarter while Operating Earnings increased 33% quarter over quarter, largely driven by higher oil prices, even as we advanced our capital program that is weighted to the first half of the year.”
“At current strip prices, we expect to generate approximately $1.0 billion of free cash flow in 2026, which will be directed first to debt repayment, with share buybacks, M&A and additional dividends to be evaluated opportunistically over the year and closer to year end.”
Historical Performance
The company provides a detailed reconciliation of total results for continuing and discontinued operations between Q1 2026 and Q1 2025, reflecting the sale of Montney assets and reclassification of those operations as discontinued. The figures below focus on total results as presented in the press release.
| Category | Q1 2026 (Total) | Q1 2025 (Total) | Change % |
| Revenue (oil & gas sales) | $1,121 million | $1,459 million | Approximately −23.2% YoY. |
| Oil & gas net of blending | $824 million | $1,133 million | Approximately −27.3% YoY. |
| Net income | $39 million | $206 million | Approximately −81.1% YoY. |
| Operating Earnings | $194 million | $322 million | Approximately −39.8% YoY. |
| Funds from Operations | $364 million | $558 million | Approximately −34.8% YoY. |
| Capital expenditures | $298 million | $350 million | Approximately −14.9% YoY. |
| Free Cash Flow | $47 million | $185 million | Approximately −74.6% YoY. |
How the Market Reacted?
In absence of explicit price moves, the tone of the release is mixed, with weaker YoY revenue and net income offset by stronger sequential Operating Earnings and reaffirmed 2026 guidance. Management’s outlook points to approximately $1.0 billion of Free Cash Flow in 2026 and continued capital returns via a $0.30 per share quarterly dividend, which supports a broadly constructive, albeit selective, investor sentiment. The emphasis on debt reduction, disciplined capital spending and long life heavy oil projects suggests a cautious but generally bullish strategic stance for the rest of 2026.