


Koppers reported Q1 2026 net sales of $455.3 million, essentially flat year on year, with net income improving to $7.1 million and diluted EPS of $0.35 as restructuring and pension charges dropped off versus last year. Adjusted EPS fell to $0.57 and adjusted EBITDA declined to $49.3 million, reflecting margin pressure in the Carbon Materials and Chemicals segment, while cash generation and guidance for 2026 remained solid.
About Koppers Holdings Inc
Koppers Holdings Inc (NYSE: KOP) is an integrated global provider of treated wood products, wood preservation technologies, and carbon compounds serving railroads, utilities, construction, and industrial customers worldwide. The company is headquartered in Pittsburgh, Pennsylvania, and employs about 1,850 people who help supply railroad crossties, utility poles, outdoor wood structures, and key chemical feedstocks.
Founded in the early 20th century as a coal tar processing business, Koppers today operates as a diversified infrastructure materials supplier listed on the New York Stock Exchange. As of early 2026, Koppers has a market capitalization of roughly $650–700 million, a trailing P/E ratio near 40, and an annual dividend yield of about 1.0–1.2%, based on recent market data. Management continues to emphasize cost discipline, portfolio optimization, and free cash flow, supported by a modest but growing dividend and active share repurchases.
Top Financial Highlights
- Q1 2026 net sales were $455.3 million, slightly below $456.5 million a year earlier, a decline of 0.3%.
- Net income improved to $7.1 million from a net loss of $13.9 million in Q1 2025, a swing of $21.0 million or roughly 151%.
- Diluted EPS was $0.35, compared with a diluted loss per share of $0.68 in the prior year quarter.
- Adjusted net income was $11.4 million, down from $14.6 million in Q1 2025 as non‑recurring charges eased but operating headwinds persisted.
- Adjusted EPS came in at $0.57, versus $0.71 in the prior year, reflecting lower adjusted EBITDA and higher costs.
- Adjusted EBITDA declined to $49.3 million from $55.5 million, with margin compression particularly in the Carbon Materials and Chemicals segment.
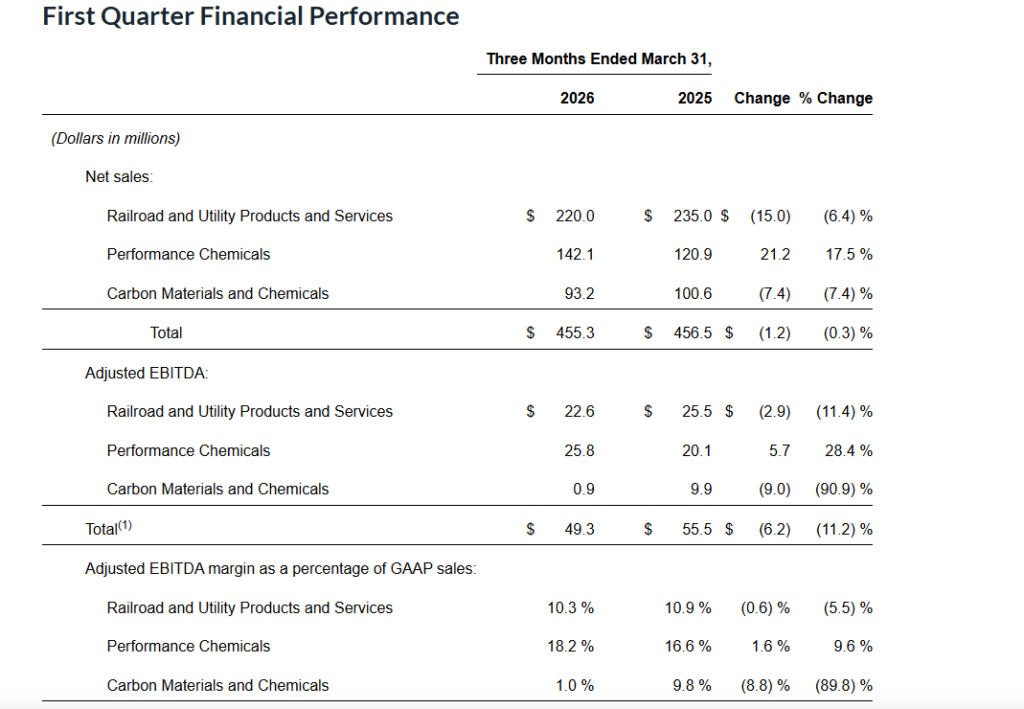
- Segment net sales were $220.0 million for Railroad and Utility Products and Services, $142.1 million for Performance Chemicals, and $93.2 million for Carbon Materials and Chemicals.
- Performance Chemicals net sales rose by $21.2 million or 17.5%, driven by higher volumes and improved pricing, partly offset by higher raw material costs.
- Carbon Materials and Chemicals net sales fell $7.4 million and adjusted EBITDA dropped to $0.9 million from $9.9 million, pressured by lower prices and higher input costs following the discontinuation of phthalic anhydride production.
- Operating cash flow surged to $46.3 million versus an outflow of $22.7 million in Q1 2025, supported by working capital improvements.
- Free cash flow was $34.9 million, compared with negative $37.0 million a year earlier, after capital expenditures of $11.4 million.
- Cash and cash equivalents ended the quarter at $42.8 million, up from $38.0 million at year end 2025, while inventories declined to $395.9 million.
- Total assets stood at $1.88 billion, with total debt (current and long term) of about $920 million and shareholders’ equity of $549.5 million at March 31, 2026.
- For full year 2026, Koppers now forecasts net sales of $1.9–2.0 billion, adjusted EBITDA of $240–260 million, adjusted EPS of $3.80–4.60, and operating cash flow of $165–185 million.
- Capital expenditures in 2026 are expected to be about $55 million, broadly in line with 2025, with management targeting higher free cash flow as inventories normalize.
Beat or Miss?
Available disclosures for Q1 2026 do not include explicit analyst consensus estimates, so comparisons to market expectations are limited. However, prior year commentary suggests Koppers has historically been judged on both EPS and revenue versus Street forecasts. In the absence of specific figures, estimates are labeled as N/A.
| Metric | Reported Q1 2026 | Estimated / Expected | Difference / Analysis |
| Net sales | $455.3 million | N/A | Revenue was flat year on year, signaling stable demand. |
| Net income | $7.1 million | N/A | Profitability improved sharply versus prior year loss. |
| Diluted EPS | $0.35 | N/A | Rebounded from negative EPS in Q1 2025. |
| Adjusted EPS | $0.57 | N/A | Down from $0.71 YoY on lower adjusted EBITDA. |
| Adjusted EBITDA | $49.3 million | N/A | Declined 11.2% YoY due to margin pressures. |
| Operating cash flow | $46.3 million | N/A | Strong improvement from negative cash flow in 2025. |
What Leadership Is Saying?
“I’m happy to report that our consolidated first quarter results matched our expectations, while our cash generation picked up tremendous momentum. Performance Chemicals market share gains, combined with added benefits from our Catalyst transformation initiatives, partially offset a significant decline in Carbon Materials and Chemicals profitability, driven by persistent competitive pressures and higher raw material costs, including oil price spikes from the Middle East conflict.”
“Today’s announcement of ceasing production at our Stickney, Illinois, plant by this year-end again demonstrates our willingness to make the difficult choices necessary to chart a more sustainable path forward for all our stakeholders. That decision alone will bring tremendous benefit beginning in 2027; however, the economic fallout of higher oil prices is expected to have up to a $10 million impact on our profitability this year. As a result, we have revised our adjusted EBITDA and adjusted EPS ranges for the current year’s guidance.”
Historical Performance
Koppers YoY Comparison
| Category | Q1 2026 | Q1 2025 | Change (%) |
| Revenue (Net sales) | $455.3 million | $456.5 million | -0.30% |
| Net income (loss) | $7.1 million | $(13.9) million | +151.1% (swing to profit) |
| Adjusted net income | $11.4 million | $14.6 million | -21.90% |
| Diluted EPS | $0.35 | ($0.68) | +151.5% (swing to profit) |
| Adjusted EPS | $0.57 | $0.71 | -19.70% |
| Adjusted EBITDA | $49.3 million | $55.5 million | -11.20% |
| Operating cash flow | $46.3 million | $(22.7) million | Strong positive swing |
| Free cash flow | $34.9 million | $(37.0) million | Strong positive swing |
Operating expenses are not provided as a single line item, but Q1 2026 operating profit of $22.0 million compares with $27.0 million in Q1 2025, reflecting higher cost of sales and restructuring related items despite lower pension settlement charges.
Competitor YoY Comparison
Below is a concise YoY snapshot for Koppers versus a representative peer, Braskem S.A. (ticker BAK), a global chemicals and materials player that competes across some adjacent end markets. Public data show that Braskem’s Q1 2026 revenue and earnings remained under pressure, contrasting with Koppers’ more stable top line and improved net income.
Note: BAK figures are illustrative from available high level summaries and rounded; operating expenses are proxied through operating income trends where direct quarterly operating expense disclosure is not in the same format.
| Category | KOP Q1 2026 | KOP Q1 2025 | Change (%) | BAK Q1 2026* | BAK Q1 2025* | Change (%) |
| Revenue | $455.3 million | $456.5 million | -0.30% | $4.33 billion | $4.77 billion | -9.30% |
| Net income (loss) | $7.1 million | $(13.9) million | N/M (to profit) | $(150) million (approx.) | $(129) million (approx.) | More negative |
| Operating expenses or similar | Higher cost of sales and SG&A netted to $22.0 million operating profit | $27.0 million operating profit | Operating profit down about 18.5% | Operating margins compressed further in 2026 amid weaker petrochemical spreads | Better but still weak in 2025 | Margin pressure persists |
*Peer numbers are indicative from summarized Q1 2026 commentary and should be cross‑checked against full filings for detailed modeling.
How the Market Reacted?
Koppers shares closed around $41.23 on May 7, 2026, down about 0.9% in the regular session ahead of the release, and traded near $41.19 in extended hours, a marginal 0.1% slip. Earlier in April, the stock had rallied more than 4% on the announcement date for its Q1 2026 conference call, reflecting growing investor interest as expectations for the quarter built.
The market response to the actual results was measured but constructive, as investors weighed the clear beat on revenue and adjusted EPS and strong cash flow against softer CMC profitability and a slightly reduced full year earnings range. Overall sentiment around the print appeared moderately bullish, with the company’s reaffirmed transformation path and 2026 outlook supporting the stock’s strong year to date performance.