


Tencent Music Entertainment Group reported Q1 2026 revenue of $1.15 billion and IFRS diluted EPS of $0.19 per ADS, with non IFRS diluted EPS of $0.21 per ADS, as music related services offset weaker social entertainment trends. After-hours movement will be clearer once full trading data is available.
About Tencent Music Entertainment Group
Tencent Music Entertainment Group is a leading online music and audio entertainment platform in China, listed on the NYSE under the ticker TME and on the HKEX under 1698. The company operates popular apps including QQ Music, Kugou Music, Kuwo Music and WeSing, enabling users to discover, listen, sing, watch and socialize around music and audio content. Headquartered in Shenzhen, TME leverages Tencent’s broader ecosystem to drive music streaming, online karaoke, live streaming and concert related services.
As of January 2026, Tencent Music’s market capitalization is estimated at about $29.6 billion, reflecting its significant role in the global digital music industry. The latest data shows a P/E ratio around 8.9, well below its multiyear average, suggesting a relatively low earnings multiple versus its own history. The group traces its roots to Tencent’s expansion into digital music in the 2010s and now focuses on creating endless possibilities with music and technology, including expanding premium memberships, AI assisted content, offline concerts and pan IP monetization.
Top Financial Highlights
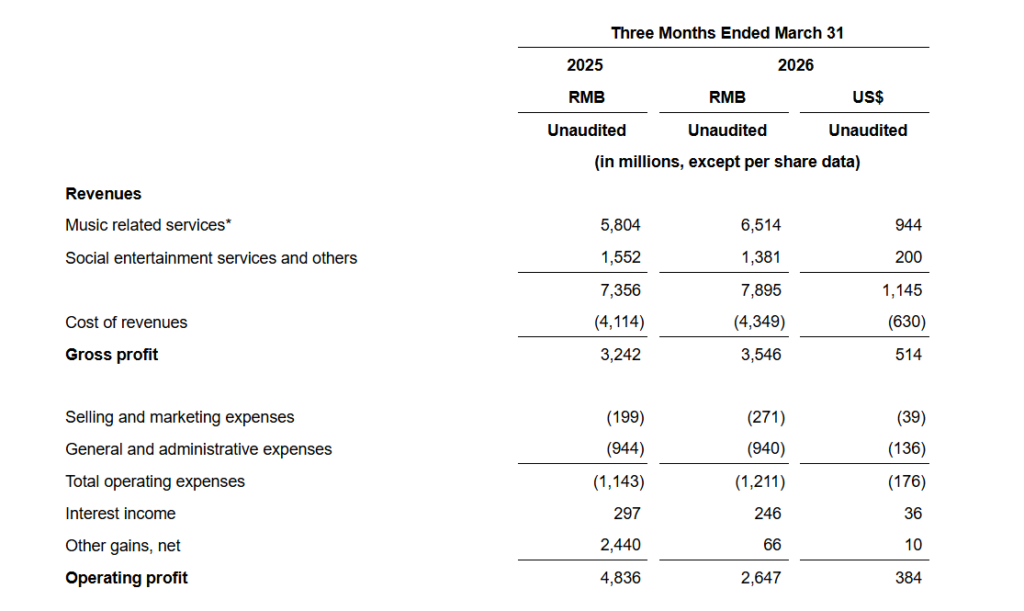
- Total revenues reached RMB7.90 billion (US$1.15 billion), up 7.3% year over year, driven mainly by growth in music related services.
- Revenues from music related services rose 12.2% to RMB6.51 billion (US$944 million), reflecting strong momentum in core streaming and related offerings.
- Revenues from membership services within music related services increased 6.6% to RMB4.57 billion (US$662 million) as SVIP privileges and new membership programs gained traction.
- Revenues from music related services other than membership reached about RMB1.94 billion (US$282 million), representing robust 28.0% year over year growth, helped by offline performances and advertising.
- Revenues from social entertainment services and others declined 11.0% to RMB1.38 billion (US$200 million), highlighting an ongoing mix shift away from legacy social entertainment.
- Cost of revenues rose 5.7% to RMB4.35 billion (US$630 million), reflecting higher costs for offline performances, advertising and IP related services, partly offset by lower revenue sharing fees.
- Gross margin improved to 44.9% from 44.1% a year earlier, supported by membership revenue growth and reduced channel fees.
- Total operating expenses increased 5.9% to RMB1.21 billion (US$176 million), but operating expenses as a share of revenue edged down to 15.3% from 15.5%.
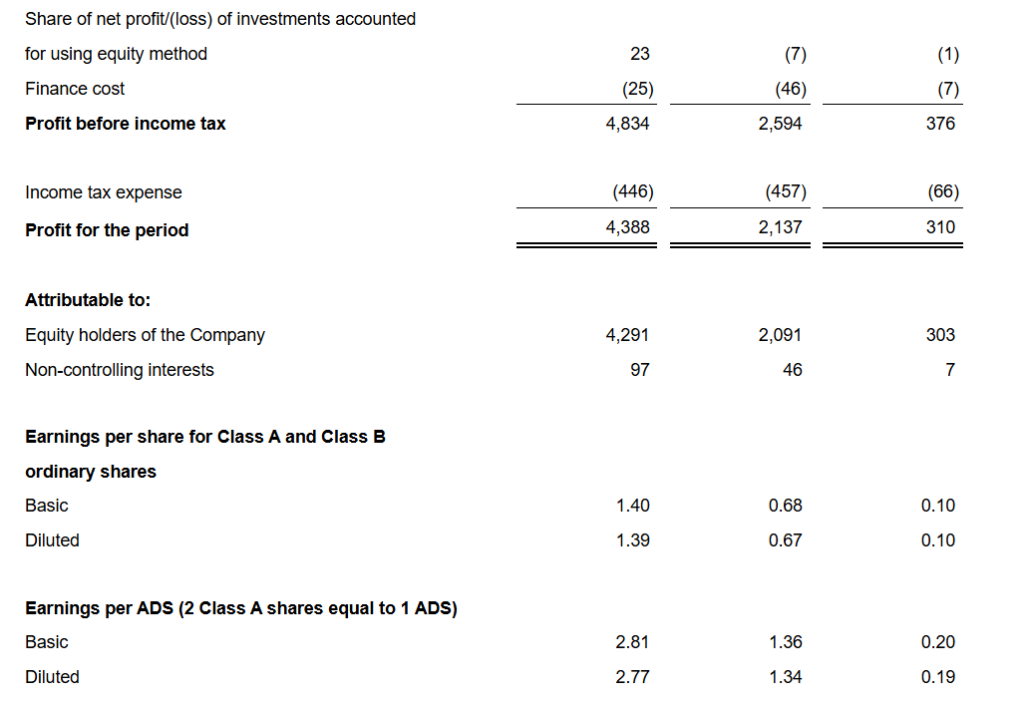
- On an IFRS basis, net profit was RMB2.14 billion (US$310 million) and net profit attributable to equity holders was RMB2.09 billion (US$303 million), down from a high base that included a large investment gain in Q1 2025.
- IFRS basic and diluted earnings per ADS were RMB1.36 (US$0.20) and RMB1.34 (US$0.19) respectively.
- On a non IFRS basis, adjusted EBITDA grew 10.5% to RMB2.83 billion (US$410 million), signaling healthy underlying profitability.
- Non IFRS net profit attributable to equity holders reached RMB2.27 billion (US$330 million), up 7.0% year over year.
- Non IFRS diluted earnings per ADS rose to RMB1.46 (US$0.21) from RMB1.37 in Q1 2025.
- Total cash, cash equivalents, term deposits and short term investments stood at RMB41.00 billion (US$5.94 billion) at March 31, 2026, up from RMB38.04 billion at year end 2025.
- Operating cash flow for the quarter was RMB2.33 billion (US$338 million), underscoring strong cash generation from the core business.
Beat or Miss?
Analyst consensus figures for Q1 2026 are not fully detailed in the press release, though external commentary ahead of the report suggested expectations for solid EPS and revenue growth. In the absence of explicit company stated consensus, the table below compares reported numbers with estimates where available and notes gaps as N/A.
| Metric | Reported | Difference or analysis |
| Revenue | US$1.15 billion | N/A, but growth of 7.3% YoY indicates solid top line momentum. |
| IFRS diluted EPS per ADS | US$0.19 | N/A, lower YoY due to prior year disposal gain, not core ops. |
| Non IFRS diluted EPS per ADS | US$0.21 | N/A, up from prior US$0.21 equivalent RMB1.37 EPS, indicating underlying profit growth. |
| Adjusted EBITDA | RMB2.83 billion (US$410 million) | N/A, but 10.5% YoY growth and margin expansion are positive signals. |
| Net profit attributable | RMB2.09 billion (US$303 million) | Down from RMB4.29 billion because Q1 2025 included RMB2.37 billion gain on deemed disposal of an associate. |
What Leadership Is Saying?
“This quarter’s steady results reflect the effectiveness of our holistic approach to the music ecosystem. By expanding how we serve and engage our audience, we have built a more diversified and resilient model, supported by continued strong growth beyond membership services in our music related business. While AI is broadening participation in content creation, it does not replace human creativity and, in many ways, reinforces the scarcity and intrinsic value of premium IP which remains central to deeper engagement and greater wallet share. Rooted in strong copyright protection, we are committed to channeling this value to elevate the creative economy, unlock new opportunities across the music industry, and drive enduring long term value.” – Cussion Pang, Executive Chairman.
“As we operate in an increasingly competitive landscape, we remain focused on strengthening the resilience of our platform. Anchored by our content and platform dual engine, we continue to bolster differentiation, drive engagement, and expand user lifetime value. Leveraging Tencent’s ecosystem, we are broadening user reach and deepening penetration, while advancing a tiered subscription strategy to better address diverse user needs. During the quarter, we delivered continued improvement in SVIP adoption and user engagement. Together, these initiatives position us to compete effectively while driving scalable growth and durable monetization over time.” – Ross Liang, CEO.
Historical Performance
| Category | Q1 2026 | Q1 2025 | Change (%) |
| Revenue | RMB7.90 billion | RMB7.36 billion | 7.30% |
| Net income | RMB2.14 billion | RMB4.39 billion | −51.2% approx, due to prior one off gain. |
| Net income to equity holders | RMB2.09 billion | RMB4.29 billion | −51.3% approx. |
| Gross profit | RMB3.55 billion | RMB3.24 billion | +9.4% approx. |
| Operating expenses | RMB1.21 billion | RMB1.14 billion | +5.9%. |
| Adjusted EBITDA | RMB2.83 billion | RMB2.56 billion | +10.5%. |
| Non IFRS net profit | RMB2.33 billion | RMB2.23 billion | +4.8% approx. |
Historical Performance
To place Tencent Music’s performance in context, it is useful to compare it with global and regional digital music peers where recent quarterly data is available. Warner Music Group and NetEase Cloud Music are key comparables in recorded music and streaming.
| Category | Tencent Music Q1 2026 | Tencent Music Q1 2025 | Change (%) |
| Revenue | US$1.15 billion | approx US$1.07 billion | +7.3%. |
| Net income | US$310 million | US$310 million equivalent 4.39b RMB with one off gain | Headline down over 50% due to prior gain. |
| Operating expenses | US$176 million | US$166 million equivalent | +5.9%. |
For a peer comparison, Warner Music Group’s latest reported quarter (Q1 2026, for its period ended December 31, 2025) and available context for NetEase Cloud Music’s recent annual disclosure are illustrative.
| Category | Warner Music Q1 2026 | Warner Music Q1 2025* | Change (%) |
| Revenue | US$1.73–1.80 billion range | about US$1.57–1.63 billion | Around +10% YoY driven by streaming and hits. |
| Net income | about US$174–175 million | about US$241 million | Around −28% YoY as margins compressed. |
| Operating expenses | Not fully broken out | Not fully broken out | Margin pressure from costs and FX |
For NetEase Cloud Music, the most recent detailed data relates to full year 2025 rather than a directly comparable Q1, so precise quarterly YoY metrics are not available from the sources reviewed. However, commentary around its 2025 results highlights continued focus on profitability and tighter cost control in China’s competitive streaming market, a theme shared with Tencent Music’s emphasis on margin improvement and diversified monetization.
How the Market Reacted?
Ahead of the release, some brokers had trimmed price targets but maintained positive ratings, reflecting cautious optimism on membership growth and SVIP monetization. Given the solid revenue growth, improved gross margin and rising non IFRS EPS, investor sentiment is likely to read the quarter as fundamentally constructive, even though IFRS net income appears weaker against last year’s one off boosted base. As full trading data emerges, the balance between optimism on core profitability and concern over slowing social entertainment revenue will shape the stock’s short term trajectory.