


Samsonite Group S.A. (SEHK: 1910) posted Q1 2026 net sales of $829.1 million, up 4.1% year over year on a reported basis. Adjusted diluted EPS came in at $0.026, down from $0.037 in Q1 2025. Net income fell 31.6% to $37.7 million. Shares closed at HK$13.73 on May 13, 2026, down 2.21% on the day of the results announcement.
About Samsonite Group S.A.
Samsonite Group S.A. (SEHK: 1910) is the world’s largest travel luggage company and a leader in global lifestyle bags, with a heritage dating back to 1910 and its joint corporate headquarters in Mansfield, Massachusetts, USA and a registered office in Luxembourg.
The company designs, manufactures, sources, and distributes luggage, business bags, computer bags, outdoor bags, and travel accessories under iconic brand names including Samsonite, TUMI, and American Tourister, selling across Asia, North America, Europe, and Latin America through wholesale channels, company-operated retail stores, and e-commerce.
As of May 13, 2026, Samsonite Group carries a market cap of approximately HK$18.99 billion (~USD 2.4 billion), with the stock trading at HK$13.69 and a trailing P/E ratio of approximately 8.66x. The company operates 1,139 company-owned retail stores globally as of March 31, 2026, and a total workforce spanning multiple continents. The current CFO is Thomas R. Pizzuti, who assumed the role effective February 2, 2026, following the departure of Reza Taleghani.
Top Financial Highlights
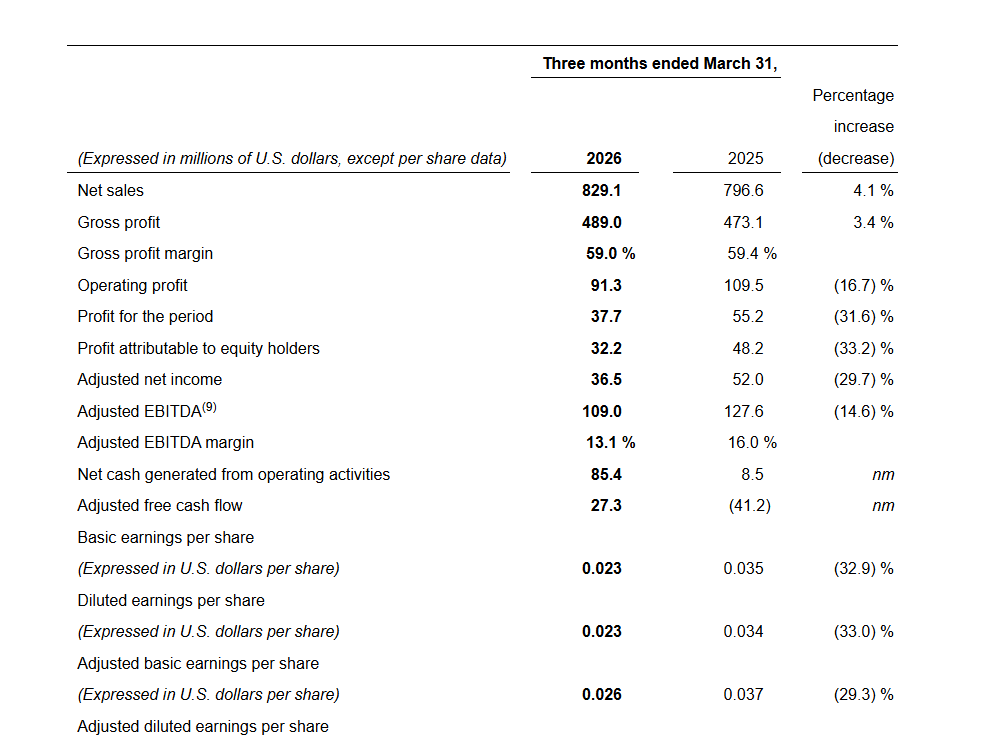
- Net sales reached $829.1 million in Q1 2026, up 4.1% on a reported basis and 0.4% on a constant currency basis versus Q1 2025.
- Gross profit was $489.0 million, with gross profit margin at 59.0% (versus 59.4% in Q1 2025).
- Adjusted EBITDA was $109.0 million, with adjusted EBITDA margin at 13.1% (versus 16.0% in Q1 2025).
- Operating profit was $91.3 million, down from $109.5 million in Q1 2025, a decline of 16.7%.
- Net income (profit for the period) was $37.7 million, down 31.6% from $55.2 million in Q1 2025.
- Adjusted net income stood at $36.5 million, a decrease of $15.4 million from Q1 2025.
- Adjusted basic and diluted EPS were both $0.026 per share, versus $0.037 per share in Q1 2025, down 29.3% to 29.5%.
- Adjusted free cash flow was a positive inflow of $27.3 million, a remarkable turnaround from an outflow of $41.2 million in Q1 2025, up $68.5 million year over year.
- Net cash generated from operating activities was $85.4 million, versus just $8.5 million in Q1 2025.
- Cash and cash equivalents at end of period: $670.4 million (up from $649.3 million at December 31, 2025).
- Net debt as of March 31, 2026 was $1,070.1 million, down $28.8 million from December 31, 2025.
- DTC channel net sales grew 4.2% (constant currency) and e-commerce alone grew 11.3% (constant currency) year over year.
- Lifestyle bags category net sales grew 4.8% (constant currency), outperforming the travel category which declined 2.0% (constant currency).
- The company declared a total $140 million dividend on March 19, 2026, payable July 15, 2026, and announced a new $50 million share repurchase program.
Key Financial Highlights for the First Quarter Ended March 31, 2026
Beat or Miss?
| Metric | Reported (Q1 2026) | Prior Year (Q1 2025) | Difference/Analysis |
| Net Sales | $829.1M | $796.6M | +4.1% reported; +0.4% constant currency |
| Gross Profit Margin | 59.0% | 59.4% | -40 bps; management views as strong |
| Adjusted EBITDA | $109.0M | $127.6M | -14.6%; margin compressed to 13.1% from 16.0% |
| Net Income | $37.7M | $55.2M | -31.6%; impacted by higher opex and marketing spend |
| Adjusted EPS (Diluted) | $0.026 | $0.037 | -29.5%; reflects higher distribution and marketing costs |
| Adjusted Free Cash Flow | +$27.3M | -$41.2M | Significant improvement; +$68.5M swing |
| Cash on Hand | $670.4M | $601.7M | +$68.7M YoY cash position improvement |
What Leadership Is Saying?
“We delivered positive reported net sales growth of 4.1% during the three months ended March 31, 2026 compared to the first quarter of 2025, and net sales grew 0.4% on a constant currency basis. We are confident in our ability to execute on our strategic priorities and navigate through macroeconomic volatility to accelerate long-term growth. These priorities are to amplify and elevate awareness of our iconic, consumer-centric brands, be the clear winner in digital to further support multi-channel growth, seize white space opportunities in lifestyle bags, and continue to win with products that resonate globally.”
Kyle Gendreau, Chief Executive Officer, Samsonite Group S.A.
“Adjusted free cash flow significantly improved to an inflow of US$27.3 million for the first quarter of 2026 compared to an outflow of US$41.2 million in the first quarter of 2025, primarily driven by favorable changes in net working capital year-over-year. Net debt was US$1,070.1 million as of March 31, 2026, a reduction of US$28.8 million from December 31, 2025.”
Thomas R. Pizzuti, Chief Financial Officer, Samsonite Group S.A.
Historical Performance
| Category | Q1 2026 | Q1 2025 | Change (%) |
| Net Sales | $829.1M | $796.6M | 4.10% |
| Gross Profit | $489.0M | $473.1M | 3.40% |
| Gross Profit Margin | 59.0% | 59.4% | -40 bps |
| Operating Profit | $91.3M | $109.5M | -16.70% |
| Net Income | $37.7M | $55.2M | -31.60% |
| Adjusted EBITDA | $109.0M | $127.6M | -14.60% |
| Adjusted Net Income | $36.5M | $52.0M | -29.70% |
| Adjusted Free Cash Flow | +$27.3M | -$41.2M | nm (+$68.5M swing) |
| Distribution Expenses | $284.3M | $256.5M | 10.80% |
| Marketing Expenses | $47.5M | $42.1M | 12.80% |
| G&A Expenses | $62.2M | $61.1M | 1.80% |
| Basic EPS | $0.023 | $0.035 | -32.90% |
| Adjusted Diluted EPS | $0.026 | $0.037 | -29.50% |
Regional Net Sales Breakdown:
| Region | Q1 2026 | Q1 2025 | Change (%) |
| Asia | $316.2M | $307.0M | +3.0% (+1.3% CC) |
| North America | $257.9M | $261.5M | -1.4% (-1.7% CC) |
| Europe | $195.4M | $175.5M | +11.3% (+0.8% CC) |
| Latin America | $59.6M | $52.5M | +13.5% (+4.7% CC) |
Brand Net Sales Breakdown:
| Brand | Q1 2026 | Q1 2025 | Change (%) |
| Samsonite | $431.2M | $407.4M | +5.8% (+1.3% CC) |
| TUMI | $191.9M | $186.9M | +2.7% (+0.5% CC) |
| American Tourister | $131.2M | $129.9M | +1.1% (-1.6% CC) |
| Other Brands | $74.8M | $72.5M | +3.2% (-0.9% CC) |
Competitor YoY Comparison
The most directly comparable listed peers in the global luggage sector are VIP Industries (BSE: 507880) and Safari Industries (NSE: SAFARI), both India-listed competitors. Note: VIP and Safari report on an Indian fiscal year basis (Q1 FY26 = April to June 2025, i.e., calendar Q2 2025), so these figures represent the most recent available quarterly results for each competitor. Direct calendar Q1 2026 comparables are not yet publicly available for VIP or Safari.
| Category | Samsonite Q1 2026 | Samsonite Q1 2025 | Change (%) |
| Net Sales | $829.1M | $796.6M | 4.10% |
| Net Income | $37.7M | $55.2M | -31.60% |
| Gross Margin | 59.0% | 59.4% | -40 bps |
| Category | VIP Industries Q1 FY26 | VIP Industries Q1 FY25 | Change (%) |
| Revenue | Rs. 566.1 Cr (~$67M) | Rs. 640.95 Cr (~$76M) | -11.70% |
| Net Income (PAT) | Rs. -13.1 Cr (loss) | Rs. 4.04 Cr | -424.30% |
| EBITDA Margin | 5.2% (normalized 10.2%) | 8.00% | -280 bps |
| Category | Safari Industries Q1 FY26 | Safari Industries Q1 FY25 | Change (%) |
| Revenue | Rs. 527.8 Cr (~$63M) | Rs. 458.24 Cr (~$55M) | 17.30% |
| Net Income (PAT) | Rs. 50.5 Cr | Rs. 44.4 Cr | 13.70% |
| EBITDA | Rs. 65.3 Cr | Rs. 61.2 Cr | 6.70% |
Samsonite’s scale dwarfs both India-listed peers combined, reinforcing its position as the world’s largest luggage company with roughly 20% global market share. VIP Industries posted a significant revenue and profit decline in its comparable period, while Safari Industries showed strong growth, highlighting the fragmented and divergent competitive landscape.
How the Market Reacted?
Samsonite Group shares (SEHK: 1910) closed at HK$13.73 on May 13, 2026, the day of the Q1 earnings announcement, down 2.21% from the prior session open, with intraday volume of approximately 5.97 million shares. The stock has declined approximately 4.13% year-to-date in 2026 and is trading near its 52-week low range of HK$13.52, well below its 52-week high of HK$21.98.
The overall sentiment from the report is mixed: while topline revenue growth of 4.1% and a massive free cash flow improvement of $68.5 million year over year are bullish signals, the significant compression in net income (-31.6%), adjusted EBITDA margin (down to 13.1% from 16.0%), and EPS (-29.5%) weighed on investor confidence.
The company’s guidance for low-single-digit constant currency net sales growth in full-year 2026 and a potential US dual listing in 2026 are potential near-term catalysts that the market will continue to monitor.
