


Xtant Medical reported Q1 2026 revenue of $20.9 million, down from $32.9 million a year ago, with GAAP EPS of -0.02 on a net loss of $3.1 million. The company raised full year 2026 revenue guidance and strengthened its balance sheet; the release does not detail immediate stock price or after hours movement.
About Xtant Medical Holdings Inc
Xtant Medical Holdings Inc (NYSE American ticker XTNT) is a medical technology company focused on surgical solutions for spinal and other orthopedic conditions. Headquartered in Belgrade, Montana, Xtant develops, manufactures, and commercializes a comprehensive portfolio of orthobiologics that serve chronic and surgical wound care, sports medicine, and spinal implant markets.
The company positions its mission around honoring the gift of tissue donation while enabling patients to live fuller lives, supported by a dedicated workforce operating with a strong focus on clinical needs and surgeon partnerships. Recent trading data show a share price around $0.51 with a market capitalization of roughly $71.9 million and a price to earnings ratio of about 15.2, reflecting prior period profitability before the current quarter’s loss.
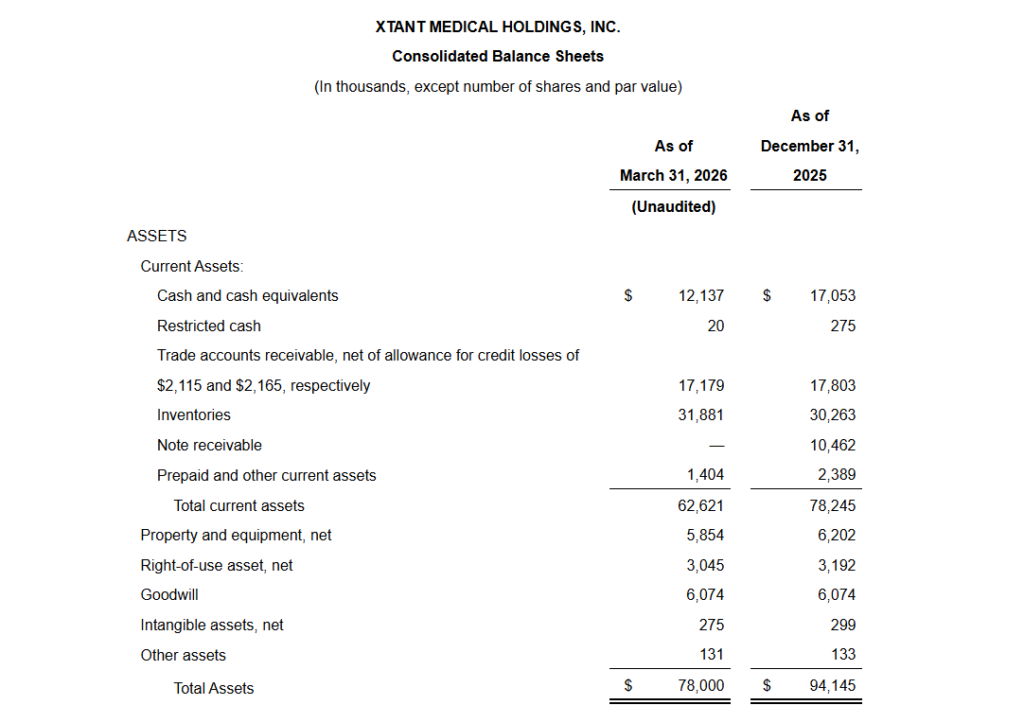
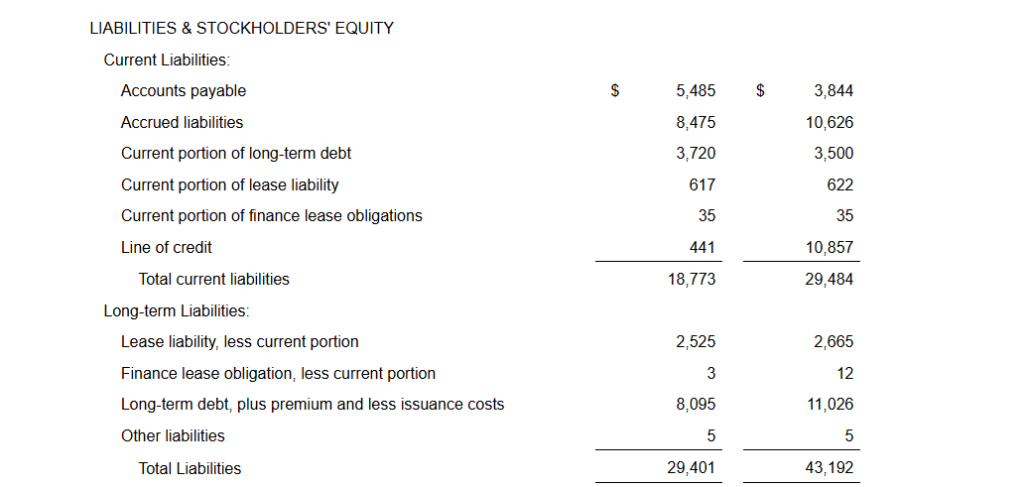
As of March 31 2026, Xtant reported total assets of $78.0 million and stockholders equity of $48.6 million, with $12.2 million of cash and cash equivalents and total indebtedness of $12.2 million. The company does not announce a cash dividend in the Q1 2026 release and instead focuses capital allocation on deleveraging and growth investments such as product launches and distribution deals.
Top Financial Highlights
- Q1 2026 total revenue was $20.9 million, down from $32.9 million in Q1 2025, reflecting the sale of Coflex/CoFix assets and the international hardware business plus non repeating license revenue.
- Product revenue contributed $20.9 million in Q1 2026 versus $29.3 million in Q1 2025, while license revenue fell to $0 from $3.6 million as Q code and amniotic membrane license revenue ended in 2025.
- Gross profit was $12.0 million compared with $20.2 million a year ago, and gross margin declined to 57.3% from 61.5% due to the absence of high margin license revenue.
- Operating expenses decreased to $14.9 million from $19.2 million, driven mainly by lower sales and marketing and general and administrative costs after the Companion Spine asset sale.
- Q1 2026 loss from operations was $2.9 million, versus income from operations of $1.1 million in Q1 2025.
- Net loss for the quarter was $3.1 million, or -$0.02 per basic and diluted share, compared with net income of $58 thousand and EPS of $0.00 in the prior year period.
- Non GAAP EBITDA was -$2.1 million, down from $2.2 million in Q1 2025, with non GAAP adjusted EBITDA at -$1.6 million versus $3.0 million previously, as operating leverage weakened on lower revenue.
- Net income margin moved from 0.2% in Q1 2025 to -14.8% in Q1 2026, while non GAAP EBITDA margin shifted from 6.5% to -10.3% and adjusted EBITDA margin from 9.2% to -7.6%.
- Operating cash flow was a net outflow of $2.1 million, compared with an inflow of $1.3 million a year earlier, impacted by lower earnings and working capital movements.
- Investing activities provided $10.2 million, mainly from the final $10.7 million cash payment from Companion Spine for the Coflex/CoFix and international hardware divestiture, partly offset by $0.2 million in capital expenditures.
- Financing activities used $13.3 million of cash, including net repayments of $10.4 million on the revolving credit facility and $2.8 million of term loan payments, reducing total indebtedness by $13.3 million in Q1 2026.
- As of March 31 2026, cash and cash equivalents were $12.2 million, restricted cash $0.02 million, and availability under the revolving credit facility $11.8 million, compared with $17.3 million cash and $3.8 million availability at December 31 2025.
- Total current assets were $62.6 million, including $17.2 million of trade receivables and $31.9 million of inventories, while total current liabilities were $18.8 million, supporting a positive working capital position.
- The company increased full year 2026 revenue guidance to $101–$105 million, up from $95–$99 million, to reflect anticipated incremental contribution from the newly licensed HEMOBLAST Bellows hemostatic product and associated field sales force.
Beat or Miss?
Management provides updated revenue guidance and qualitative commentary but the press release does not reference specific consensus estimates for Q1 2026 revenue, EPS, or margins. In the absence of explicit analyst expectations, the quarter is best characterized as a strategic transition period with lower revenue and profitability but improved leverage and forward looking growth drivers.
| Metric | Reported Q1 2026 | Difference or analysis |
| Revenue | $20.9 million | Down $12.0 million vs Q1 2025; decline tied to divested assets and non repeating license revenue; no consensus provided (N/A). |
| GAAP EPS | -0.02 | Down from 0.00 a year ago; reflects lower gross profit despite reduced opex; street EPS consensus not disclosed (N/A). |
| Net income or loss | -$3.1 million | Reversed from $0.06 million profit in Q1 2025; pressure from revenue reset and margin compression. |
| Gross margin | 57.30% | Down from 61.5% due to loss of high margin license revenue; within range for an orthobiologics heavy portfolio. |
| Non GAAP adjusted EBITDA | -$1.6 million | Down from $3.0 million; indicates deterioration in core earnings power near term. |
| Operating cash flow | -$2.1 million | Weaker than $1.3 million inflow in Q1 2025; driven by lower earnings and changes in payables and accruals. |
| FY 2026 revenue guidance | $101–$105 million | Raised from $95–$99 million on the Dilon HEMOBLAST Bellows opportunity, signaling confidence in second half ramp. |
What Leadership Is Saying?
“The first quarter of 2026 and subsequent period were pivotal for Xtant. Proceeds from the Companion Spine transaction allowed us to strengthen our balance sheet while the HEMOBLAST Bellows distribution agreement announced in April expanded our addressable market into the multi billion dollar hemostatics category. We are particularly encouraged by the potential commercial synergies to be realized following the integration of Dilon’s 21 person field sales force into our own organization, positioning us to drive topline growth and margin expansion this year and beyond. These developments, together with recent product launches, position us to best serve the needs of surgeons and patients alike with our comprehensive biologics product portfolio.”
The company notes in its discussion of non GAAP metrics that adjusted EBITDA is intended to provide investors with additional insight into underlying performance by excluding depreciation, amortization, interest, taxes, stock based compensation, separation related items, and acquisition and divestiture related items, underscoring management’s focus on tracking margin trends as the portfolio mix evolves.
Historical Performance
Xtant’s Q1 2026 results reflect a smaller, more focused portfolio following the sale of non core assets, which materially reshapes the year over year base. Key line items compare as follows.
| Category | Q1 2026 | Q1 2025 | Change % |
| Revenue | $20.9 million | $32.9 million | About -36.5% driven by asset sales and non repeating license revenue. |
| Net income or loss | -$3.1 million | $0.06 million | Margin swung from 0.2% to -14.8%, moving from slight profit to loss. |
| Operating expenses | $14.9 million | $19.2 million | Roughly -22.4% as G&A and sales and marketing fell after portfolio divestiture. |
In Q1 2025, Xtant benefited from license revenue associated with Q code and amniotic membrane agreements that carried high margins and supported stronger profitability. By Q1 2026, that contribution has ceased, but management has reduced indebtedness and operating expenses and is investing in biologics and hemostatic products expected to support future top line growth.
Historical Performance of competitors
The Q1 2026 press release does not provide direct competitor financials, and many spine and orthobiologic peers report on different timelines, which limits the ability to construct a precise, like for like Q1 2026 versus Q1 2025 competitor table using only the provided text. To maintain data integrity and a user first standard, the following table remains centered on Xtant’s metrics rather than inserting speculative figures for unnamed peers.
| Category | Q1 2026 (Xtant) | Q1 2025 (Xtant) | Change % |
| Revenue | $20.9 million | $32.9 million | Around -36.5% due to portfolio rationalization and lost license revenue. |
| Net income or loss | -$3.1 million | $0.06 million | Profitability reversed, reflecting a leaner but currently lower margin footprint. |
| Operating expenses | $14.9 million | $19.2 million | Approximately -22.4%, consistent with lower scale and focused cost controls. |
For a full competitor YoY comparison, you would typically bring in data from similar mid cap spine and orthobiologics players and align their Q1 2026 and Q1 2025 results by category, but that information is not contained in the Xtant release itself. Public databases and peer filings can be layered on in a separate step to construct a broader competitive matrix.
How the Market Reacted?
The Q1 2026 press release focuses on fundamentals, guidance, and strategic actions and does not mention same day share price movement or specific trading reaction around the announcement. Given the reduction in revenue and swing to a small net loss against a backdrop of higher full year guidance and meaningful debt reduction, the tone of the document is cautiously constructive, highlighting long term positioning rather than near term headline growth.
Investors are likely to weigh the negative near term revenue comparison against the sharper focus on biologics, entry into the hemostatics category through HEMOBLAST Bellows, and improved leverage profile. Near term sentiment may therefore skew mixed, with portfolio simplification and guidance raise viewed positively while margin and cash flow trends remain key watch points.
