


Manulife Financial delivered solid Q1 2026 results with core earnings of $1.8 billion (up 8% year-over-year on constant exchange rate basis), core EPS of $1.06 (up 11%), and net income attributed to shareholders of $1.1 billion. The company reported strong new business growth with contractual service margin up 16% and maintained a robust LICAT ratio of 136%. Shares information was not disclosed in the earnings release.
About Manulife Financial Corporation
Manulife Financial Corporation (TSX/NYSE/PSE: MFC, SEHK: 945) is a leading international financial services provider headquartered in Toronto, Canada. The company operates across three primary insurance segments (Asia, Canada, and U.S.) and its Global Wealth and Asset Management division. As of March 31, 2026, the company reported book value per common share of $26.30, an all-time high under IFRS 17, and maintained a financial leverage ratio of 22.5%. The firm’s adjusted book value per common share stood at $39.01, representing a 6% increase year-over-year.
Top Financial Highlights
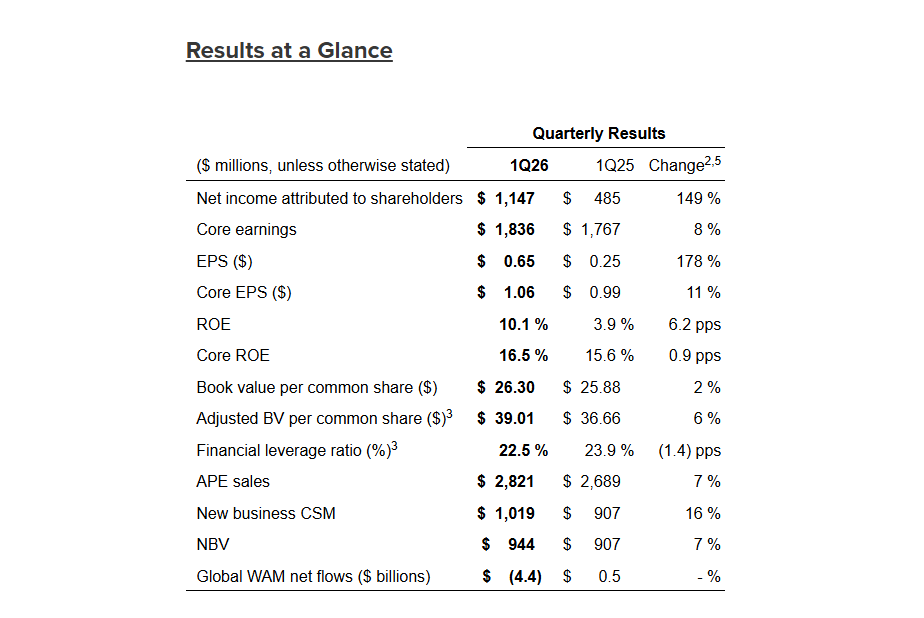
- Core earnings reached $1.8 billion, increasing 8% on a constant exchange rate basis compared to Q1 2025.
- Net income attributable to shareholders was $1.1 billion, rising by approximately 149% from the prior-year quarter.
- Core EPS stood at $1.06, up 11% from $0.99 in Q1 2025.
- Diluted EPS was $0.65, increasing 178% from $0.25 in the prior-year period.
- Core return on equity improved to 16.5%, up 90 basis points from 15.6% in Q1 2025.
- Overall return on equity increased to 10.1%, compared to 3.9% in the prior year.
- The LICAT ratio was 136%, indicating strong capital adequacy and financial stability.
- Book value per common share rose to $26.30, increasing 2% from $25.88 in Q1 2025.
- APE sales reached $2.8 billion, growing 7% year over year.
- New business contractual service margin totaled $1.0 billion, increasing 16% from the prior year.
- New business value was $944 million, reflecting 7% year-over-year growth.
- Global wealth and asset management net flows recorded net outflows of $4.4 billion, compared to net inflows in Q1 2025.
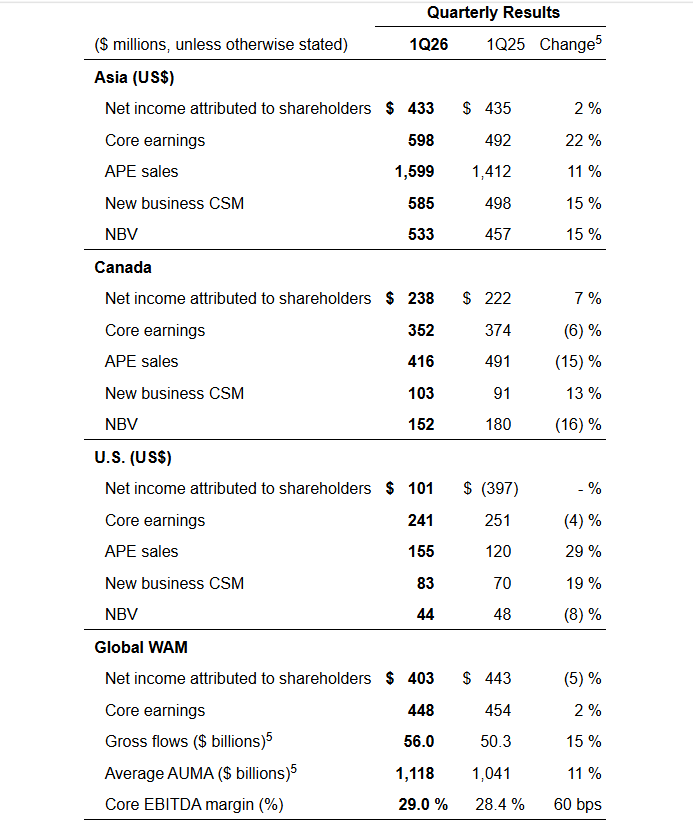
- Asia core earnings totaled $598 million, increasing 22% year over year.
- Contractual service margin reached $25.6 billion, representing 11% annualized organic growth.
- Shareholder returns totaled $1.2 billion through dividends and share repurchases.
Beat or Miss?
| Metric | Reported (Q1 2026) | Q1 2025 | Change | Analysis |
| Core Earnings | $1.836 billion | $1.767 billion | +8% (CER) | Strong performance driven by Asia business growth and favorable actuarial updates |
| Net Income (Shareholders) | $1.147 billion | $485 million | 149% | Significant improvement due to smaller market experience charges vs. prior year |
| Core EPS | $1.06 | $0.99 | +11% (CER) | Beat driven by earnings growth and continued share buybacks |
| Core ROE | 16.50% | 15.60% | +90 bps | Improved profitability and capital efficiency |
| APE Sales | $2.821 billion | $2.689 billion | 7% | Growth across key Asian markets offset by Canada declines |
| New Business CSM | $1.019 billion | $907 million | +16% (CER) | Double-digit growth across all three insurance segments |
What Leadership Is Saying?
“We delivered a solid first quarter, executing our strategy and demonstrating the strength of our diversified portfolio. We generated double-digit growth in core EPS, and new business momentum continued to build, driving double-digit growth in new business CSM across all three insurance segments, despite macroeconomic uncertainty. Asia achieved another strong quarter, with 22% growth in core earnings and 15% growth in new business value, reflecting robust contributions from key markets in the region.”
Phil Witherington, Manulife President & Chief Executive Officer
“Our balance sheet and financial performance demonstrated resilience during a volatile quarter. Excess capital remained strong, our financial leverage ratio improved, and book value per common share increased to an all-time high. We continued to deploy capital in a disciplined manner, returning $1.2 billion to shareholders through dividends and share buybacks, and on the acquisition of Schroders Indonesia. Core ROE was 16.5% for the quarter, an increase of 90 basis points compared with 1Q25, and our expense efficiency ratio of 46% remained in-line year over year.”
Colin Simpson, Manulife Chief Financial Officer
Historical Performance
| Category | Q1 2026 | Q1 2025 | Change (%) |
| Core Earnings | $1.836 billion | $1.767 billion | 3.90% |
| Net Income (Shareholders) | $1.147 billion | $485 million | 136.50% |
| Core EPS | $1.06 | $0.99 | 7.10% |
| Book Value per Share | $26.30 | $25.88 | 1.60% |
| APE Sales | $2.821 billion | $2.689 billion | 4.90% |
| New Business CSM | $1.019 billion | $907 million | 12.30% |
| Asia Core Earnings | C$820 million | C$705 million | 16.30% |
| Canada Core Earnings | $352 million | $374 million | -5.90% |
| U.S. Core Earnings | C$331 million | C$361 million | -8.30% |
| Global WAM Core Earnings | $448 million | $454 million | -1.30% |
Competitor Performance Comparison
| Company | Q1 2026 Net Income | Q1 2025 Net Income | Change (%) |
| Manulife Financial | $1.147 billion (Reported) / $1.836 billion (Core) | $485 million (Reported) / $1.767 billion (Core) | +136.5% (Reported) / +3.9% (Core) |
| Sun Life Financial | $465 million (Reported) / $1.05 billion (Underlying) | $930 million (Reported) / $1.04 billion (Underlying) | -50% (Reported) / +1% (Underlying) |
| Prudential Financial | Data not available for detailed comparison | Data not available | N/A |
Market Reaction
Stock movement data was not included in the earnings release. Manulife’s Q1 2026 results demonstrate strong operational performance with double-digit core EPS growth and robust new business momentum across insurance segments. The company’s Asia segment delivered exceptional results with 22% core earnings growth and 15% new business value increase, driven by strong performance in Hong Kong, Japan, and Singapore.
However, Global Wealth and Asset Management experienced headwinds with $4.4 billion in net outflows, primarily from retail mutual funds in North America, contrasting with the $0.5 billion net inflows in Q1 2025. The company maintained a strong capital position with a LICAT ratio of 136% and returned $1.2 billion to shareholders, signaling management’s confidence in sustainable value creation.
