


Amazon posted Q4 2025 EPS of $1.95 (in line with the $1.96 consensus) on revenue of $213.4 billion (+14% YoY), beating estimates by ~$2 billion. AWS surged 24% to $35.6B. Shares plunged ~8% in after-hours trading after the company unveiled an aggressive $200 billion 2026 capex plan focused on AI infrastructure, spooking investors despite solid top-line performance.
About Amazon.com
Amazon.com, Inc. (NASDAQ: AMZN) is the world’s largest e-commerce and cloud computing company, headquartered in Seattle, Washington. Founded by Jeff Bezos in 1994, Amazon has evolved from an online bookstore into a diversified technology conglomerate spanning e-commerce, cloud infrastructure (AWS), digital advertising, streaming media, consumer electronics, groceries, healthcare, and satellite internet (Project Kuiper/Leo).
As of mid-February 2026, Amazon’s market capitalization stands at approximately $2.13 trillion, with a trailing P/E ratio of ~27.7 and a forward P/E of ~25.8. The company employs approximately 1,576,000 full-time and part-time workers globally (excluding contractors and temporary personnel).
Amazon is guided by four principles: customer obsession, passion for invention, commitment to operational excellence, and long-term thinking. It was ranked No. 3 on Fortune’s World’s Most Admired Companies list for the tenth consecutive year in the top three. Its return on equity (ROE) is 22.29%, and return on invested capital (ROIC) is 14.23%.
Top Financial Highlights
Fourth Quarter 2025
- Total Revenue: $213.4 billion, up 14% YoY (12% ex-FX), beating the consensus estimate of ~$211.3B
- Net Income: $21.2 billion, up 6% YoY from $20.0B in Q4 2024
- Diluted EPS: $1.95, up from $1.86 in Q4 2024, roughly in line with the $1.96 analyst consensus
- Operating Income: $25.0 billion, up 18% YoY from $21.2B; would have been $27.4B excluding $2.4B in special charges
- Operating Margin: 11.7%, consistent with Q4 2024
- North America Revenue: $127.1 billion (+10% YoY), operating income of $11.5B (9.0% margin, up from 8.0%)
- International Revenue: $50.7 billion (+17% YoY; +11% ex-FX), operating income of $1.0B
- AWS Revenue: $35.6 billion (+24% YoY – fastest growth in 13 quarters), operating income of $12.5B (35.0% margin)
- Advertising Revenue: $21.3 billion, up 22% YoY
- Subscription Services Revenue: $13.1 billion, up 14% YoY
- Third-Party Seller Services Revenue: $52.8 billion, up 11% YoY
- Operating Cash Flow (TTM): $139.5 billion, up 20% YoY
- Free Cash Flow (TTM): $11.2 billion, down 71% YoY due to $128.3B in net property/equipment purchases
- Cash & Equivalents: $86.8 billion (plus $36.2B in marketable securities = ~$123B in liquid assets)
- AWS Backlog: $244 billion, up 40% YoY and 22% sequentially
Full Year 2025
- Total Revenue: $716.9 billion, up 12% YoY
- Operating Income: $80.0 billion, up from $68.6B in 2024
- Net Income: $77.7 billion ($7.17 diluted EPS), up from $59.2B ($5.53 EPS) in 2024
Q1 2026 Guidance
- Net Sales: $173.5B–$178.5B (11%–15% YoY growth)
- Operating Income: $16.5B–$21.5B (includes ~$1B higher YoY Amazon Leo satellite costs)
- 2026 Capital Expenditure Plan: ~$200 billion, a >50% increase over 2025, driven by AI infrastructure investment.
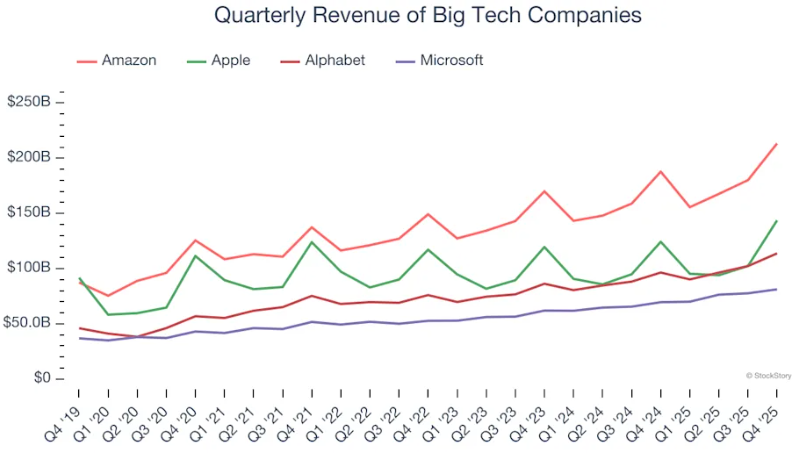
Revenue Growth
Amazon shows that fast growth and massive scale can coexist despite conventional wisdom. The company’s revenue base of $386.1 billion five years ago has increased to $716.9 billion in the last year, translating into an excellent 13.2% annualized growth rate.
Over the same period, Amazon’s big tech peers Alphabet, Microsoft, and Apple put up annualized growth rates of 17.2%, 14.8%, and 8.2%, respectively. This is an important consideration because investors often use the comparisons as a starting point for their valuations. When adjusting for these benchmarks, we think Amazon’s price is fair.
Beat or Miss?
| Metric | Reported | Analyst Estimate | Difference |
| Revenue | $213.4B | ~$211.3B | +$2.1B (+0.9% beat) |
| EPS (Diluted) | $1.95 | $1.96 | -$0.01 (slight miss) |
| Operating Income | $25.0B | ~$25.1B | -$0.1B (slight miss) |
| North America Revenue | $127.1B | ~$127.0B | +$0.1B (in line) |
| AWS Revenue | $35.6B | ~$34.9B | +$0.7B (+2.1% beat) |
| North America Op. Income | $11.5B | ~$10.8B | +$0.7B (+6% beat) |
| AWS Op. Income | $12.5B | ~$12.0B | +$0.5B beat |
| Q1 2026 Revenue Guidance | $173.5B–$178.5B | ~$176B | In line |
| Q1 2026 Op. Income Guidance | $16.5B–$21.5B (midpoint ~$19B) | Higher expected | Below expectations |
Amazon beat on revenue (driven by AWS strength) but slightly missed on EPS and operating profit. The Q1 2026 operating income guidance and the massive $200B capex plan were the primary disappointments for investors.
What Leadership Is Saying?
“Amazon continues to see strong growth, with AWS up 24%, advertising up 22%, and triple digit expansion in its chips business, alongside steady store performance globally. Supported by innovation across AI, semiconductors, robotics, and low earth orbit satellites, the company plans to invest about $200 billion in capital expenditures in 2026 to drive long term returns”. By CEO Andy Jassy
Worldwide revenue of $213.4 billion, marking a 12% year over year increase excluding a 150 basis point favorable foreign exchange impact, while operating income reached $25 billion, including $2.4 billion in special charges. According to CFO Brian Olsavsky, new capacity is being deployed directly to customers with immediate utilization, and the company continues to see strong backlog and commitment levels, particularly for artificial intelligence services, supporting long term revenue visibility.
Historical Performance
Amazon Q4 2025 vs. Q4 2024 (YoY Comparison)
| Category | Q4 2025 | Q4 2024 | Change (%) |
| Total Revenue | $213.4B | $187.8B | +14% |
| Net Income | $21.2B | $20.0B | +6% |
| Diluted EPS | $1.95 | $1.86 | +5% |
| Operating Income | $25.0B | $21.2B | +18% |
| Operating Margin | 11.70% | 11.30% | +40 bps |
| North America Revenue | $127.1B | $115.6B | +10% |
| International Revenue | $50.7B | $43.4B | +17% |
| AWS Revenue | $35.6B | $28.8B | +24% |
| Advertising Revenue | $21.3B | $17.3B | +23% |
| Operating Cash Flow (TTM) | $139.5B | $115.9B | +20% |
| Free Cash Flow (TTM) | $11.2B | $38.2B | -71% |
Amazon Full Year 2025 vs. Full Year 2024
| Category | FY 2025 | FY 2024 | Change (%) |
| Total Revenue | $716.9B | $638.0B | +12% |
| Operating Income | $80.0B | $68.6B | +17% |
| Net Income | $77.7B | $59.2B | +31% |
| Diluted EPS | $7.17 | $5.53 | +30% |
| AWS Revenue | $128.7B | $107.6B | +20% |
| North America Revenue | $426.3B | $387.5B | +10% |
| International Revenue | $161.9B | $142.9B | 13% |
Competitor Comparison
| Category | Amazon (AMZN) | Microsoft (MSFT) – FQ2 2026 | Alphabet (GOOGL) |
| Total Revenue | $213.4B (+14% YoY) | $81.3B (+17% YoY) | $113.8B (+18% YoY) |
| Operating Income | $25.0B (+18% YoY) | $38.3B (+21% YoY) | $35.9B (+16% YoY) |
| Net Income | $21.2B (+6% YoY) | $38.5B (+60% YoY, GAAP) | $34.5B (+30% YoY) |
| Cloud Revenue | AWS: $35.6B (+24% YoY) | Intelligent Cloud: $32.9B (+29% YoY); Azure +39% | Google Cloud: $17.7B (+48% YoY) |
| Cloud Operating Income | $12.5B | $13.9B | $5.3B |
| Operating Margin | 11.7% | ~47% | 31.6% |
| 2026 CapEx Guidance | ~$200B | ~$150B (est. annualized) | $175B–$185B |
| EPS | $1.95 | $4.14 (adj.) / $5.16 (GAAP) | $2.82 |
AWS remains the largest cloud provider by revenue ($35.6B quarterly / $142B ARR), but Google Cloud posted the fastest growth at 48% YoY, followed by Microsoft’s Intelligent Cloud segment at 29% YoY. All three hyperscalers have announced massive AI-driven capex plans for 2026, collectively exceeding $500 billion.
How the Market Reacted?
Amazon shares experienced a sharp selloff following the earnings release on February 5, 2026. In regular trading on Thursday, shares had already declined 4%, and they dropped an additional 7-8% in after-hours trading, bringing the stock to approximately $210.70 immediately post-announcement. The stock has continued to slide, trading at approximately $198.95 as of February 17, 2026 well below its late-2025 levels in the low $230s.
The negative reaction was not driven by the Q4 results themselves, which were broadly solid with a revenue beat and in-line EPS. Rather, investors were spooked by two factors: (1) the $200 billion 2026 capex plan, which exceeded analyst expectations by over $55 billion, and (2) the softer-than-expected Q1 2026 operating income guidance of $16.5B-$21.5B, which includes approximately $1 billion in additional Amazon Leo satellite costs.
