


Applied Materials posted Q4 FY2025 revenue of $6.8 billion, edging past expectations, with GAAP EPS of $2.38 and non-GAAP EPS of $2.17 as the company delivered record full-year results despite a modest Q4 revenue decline year over year and a slightly negative after-hours stock reaction
About Applied Materials
Applied Materials, Inc. (NASDAQ: AMAT) is a leading semiconductor equipment and materials engineering company headquartered in Santa Clara, California, serving chipmakers, display manufacturers, and related industries worldwide. Founded in 1967, the company provides tools and services used to fabricate semiconductor chips, flat panel displays, and other advanced electronics.
As of early 2026, Applied Materials carries a market capitalization of roughly $290-300 billion, anchored by a P/E ratio around 38x, reflecting strong investor confidence in semiconductor capital spending and AI-driven demand. The company generated trailing twelve‑month revenue of about $28.2 billion and net income of roughly $7.8 billion, with EPS near $9.8, and it returns capital through a modest dividend (about 0.5% yield) and share repurchases.
Top Financial Highlights
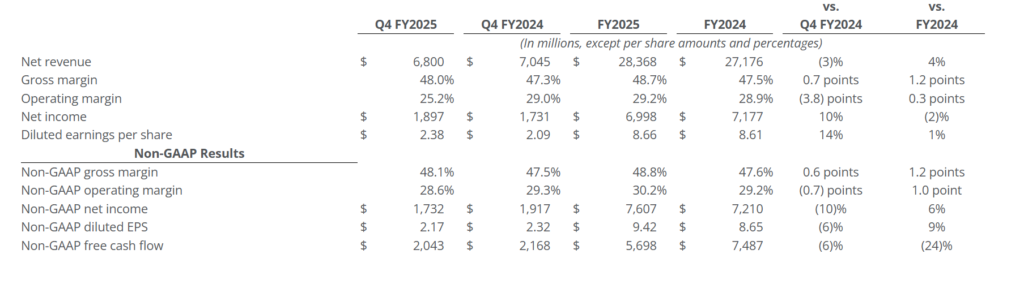
- Q4 FY2025 net revenue totaled USD 6.80 billion, declining 3% year over year while remaining slightly above consensus expectations.
- Full year FY2025 revenue reached a record USD 28.37 billion, representing 4% growth compared to FY2024.
- Q4 GAAP earnings per share were USD 2.38, increasing 14% from USD 2.09 in the prior year quarter.
- Q4 non GAAP earnings per share stood at USD 2.17, declining 6% from USD 2.32 in Q4 FY2024 but exceeding market forecasts of approximately USD 2.11.
- Full year GAAP earnings per share reached USD 8.66, rising 1% year over year, while non GAAP earnings per share increased to USD 9.42, reflecting 9% growth.
- Q4 gross margin improved to 48.0% from 47.3% in the prior year quarter, while full year gross margin reached 48.7%, the highest level recorded in 25 years.
- Q4 operating margin declined to 25.2% from 29.0% in Q4 FY2024, reflecting higher operating expenditures and product mix shifts.
- Q4 GAAP net income increased to USD 1.897 billion, compared to USD 1.731 billion in the previous year period.
- Q4 non-GAAP net income totaled USD 1.732 billion, compared to USD 1.917 billion in Q4 FY2024.
- Full year FY2025 cash flow from operations approached USD 8 billion, supporting capital returns and reinvestment.
- Full year free cash flow amounted to approximately USD 5 billion, after significant capital expenditures.
- Total shareholder returns during FY2025 reached USD 6.3 billion, including around USD 1.4 billion in dividends and USD 4.9 billion in share repurchases.
- Semiconductor Systems revenue for FY2025 grew approximately 4% year over year, supported by record performance in foundry and DRAM markets outside China.
- Applied Global Services revenue reached a record USD 6.4 billion, increasing 3% year over year.
- Display business revenue expanded by roughly 20% year over year, contributing to revenue diversification.
- Q4 revenue contribution from China declined to approximately 29% of total revenue, reflecting a more balanced geographic mix.
- Q1 FY2026 guidance indicates expected revenue of approximately USD 6.85 billion plus or minus USD 0.5 billion, with GAAP earnings per share projected around USD 2.18 plus or minus USD 0.20.
Results Summary
Business Outlook
The outlook for non GAAP diluted EPS excludes known charges of $0.01 per share associated with completed acquisitions. It also includes a net income tax benefit of $0.04 per share related to intra entity intangible asset transfers.
This guidance does not incorporate any items that are currently unknown, including potential additional acquisition related charges, other non operational or unusual items, or further tax related adjustments. These elements cannot be reasonably estimated at this time due to their inherent uncertainty.
- Applied’s total net revenue and non GAAP diluted earnings per share for the first quarter of fiscal year 2026 are expected to be as follows.
- Total net revenue is projected to be $6,850 million, with a possible variation of plus or minus $500 million.
- Non GAAP diluted earnings per share are expected to be $2.18, with a potential variation of plus or minus $0.20.
Beat or Miss?
| Metric | Reported (Q4 FY2025) | Estimated / Expected | Difference / Analysis |
| Revenue | $6.80 billion | ~$6.68 billion | Beat by ~ $0.12 billion as demand for semiconductor systems and services remained solid. |
| GAAP EPS | $2.38 | N/A | Strong year‑on‑year growth of 14%, benefiting from higher margins and mix. |
| Non‑GAAP EPS | $2.17 | ~$2.11 | Beat by about $0.06, though down 6% year over year due to increased operating expenses. |
| Gross Margin | 48.00% | N/A | Expanded versus 47.3% a year earlier, marking structurally stronger profitability. |
| Operating Margin | 25.20% | N/A | Compressed from 29.0% as the company invested in R&D and absorbed higher costs. |
| Full‑Year Revenue | $28.37 billion | N/A | Record level, up 4% year over year despite macro and regulatory headwinds. |
| Full‑Year Non‑GAAP EPS | $9.42 | N/A | Record EPS, up 9% year over year, underlining earnings leverage on growing AI demand. |
What Leadership Is Saying?
“Applied Materials delivered record annual revenue and earnings while enabling our customers to ramp critical technologies that power AI, cloud, and edge computing,” said the company’s CEO, emphasizing a strategy focused on AI‑optimized wafer fab equipment, services, and long‑term collaborations with leading chipmakers.
“We achieved our highest gross margins in 25 years and generated nearly $8 billion in operating cash flow this year, which allowed us to invest in R&D and return more than $6 billion to shareholders, even as we manage through a slower quarter and evolving export regulations,” the CFO noted, highlighting disciplined cost control and capital allocation.
Historical Performance
YoY Comparison: Q4 FY2025 vs Q4 FY2024
| Category | Q4 FY2025 | Q4 FY2024 | Change (%) |
| Revenue | $6.80 billion | $7.05 billion | -3% (modest top‑line decline as some segments normalized from peak levels). |
| Net Income (GAAP) | $1.897 billion | $1.731 billion | +10% (benefiting from higher gross margins and mix). |
| Non‑GAAP Net Income | $1.732 billion | $1.917 billion | -10% (reflecting higher operating expenses and investments). |
| Diluted GAAP EPS | $2.38 | $2.09 | +14% (EPS growth outpaced revenue on improved profitability). |
| Diluted non‑GAAP EPS | $2.17 | $2.32 | -6% (near‑term pressure from spending and product mix). |
| Gross Margin | 48.00% | 47.30% | +0.7 pts (structural margin improvement). |
| Operating Margin | 25.20% | 29.00% | -3.8 pts (higher opex and restructuring). |
YoY Comparison: Key Competitors
| Company / Category | Latest Period (FY2025/TTM) | Previous Year | Change (%) |
| Applied Materials – Revenue | ~$28.4 billion | ~$27.2 billion | +4% (record sales driven by AI and services). |
| Applied Materials – Net Income | ~$7.0–7.6 billion | ~$7.2 billion | Roughly flat as higher margins offset modest revenue growth. |
| Applied Materials – Operating Expenses / Non‑GAAP opex | Up mid‑single digits | Prior year level | About +5% on higher R&D investment. |
| Peer WFE Vendors (industry trend) – Revenue | Generally low‑ to mid‑single‑digit growth | Prior year | Industry growing modestly as AI offsets cyclical pockets. |
| Peer WFE Vendors – Margins | Stable to slightly higher | Prior year | Benefiting from richer AI and services mix. |
How the Market Reacted?
Despite beating expectations on both revenue and non‑GAAP EPS, Applied Materials’ shares slipped in after‑hours trading around the Q4 FY2025 release, with the stock reportedly down roughly 2% after the announcement as investors digested softer year‑over‑year quarterly trends and cautious export‑related commentary.
The reaction suggests a mixed but generally constructive sentiment: the market acknowledges strong full‑year execution, record margins, and robust AI‑driven positioning, yet some investors appear focused on near‑term deceleration in certain segments and lower China exposure.
With a rich valuation and a P/E near 38x as of February 2026, the stock’s long‑term trajectory will likely hinge on how effectively Applied Materials converts its AI and services pipeline into sustained double‑digit earnings growth.
