


Furuno Electric delivered solid top and bottom line growth, with FY2025 revenue around ¥126.95 billion and profit attributable to owners of parent ¥11.46 billion, implying sharply higher EPS and healthy margins, while FY2026 guidance points to further gains and the stock reaction will depend on after-hours movement.
About Furuno Electric Co., Ltd.
Furuno Electric Co., Ltd. (TSE:6814, also traded OTC as FNOEF) is a Japan-based manufacturer of maritime and industrial electronic equipment headquartered in Nishinomiya City, Hyogo, Japan. The company was incorporated in 1951 and has long specialized in marine navigation systems, fish finders, radar, GNSS timing products, and healthcare diagnostic devices.
Furuno operates globally across marine, industrial (ITS/GNSS, healthcare, defense equipment), and wireless LAN/handheld terminal businesses, serving shipbuilders, shipping lines, fisheries, defense agencies, and infrastructure providers. As of the fiscal year ended February 28, 2025, consolidated sales were ¥126.95 billion, with net income of ¥11.46 billion and an operating margin of about 10.4%.
The company had 3,368 consolidated employees, share capital of ¥7.53 billion, and is listed on the Tokyo Stock Exchange Prime market. Recent data show a profit margin above 9% and a dividend per share of ¥75 for FY2024, rising to a forecast ¥150 total dividend for FY2025, implying a payout ratio a little over 30%.
Top Financial Highlights
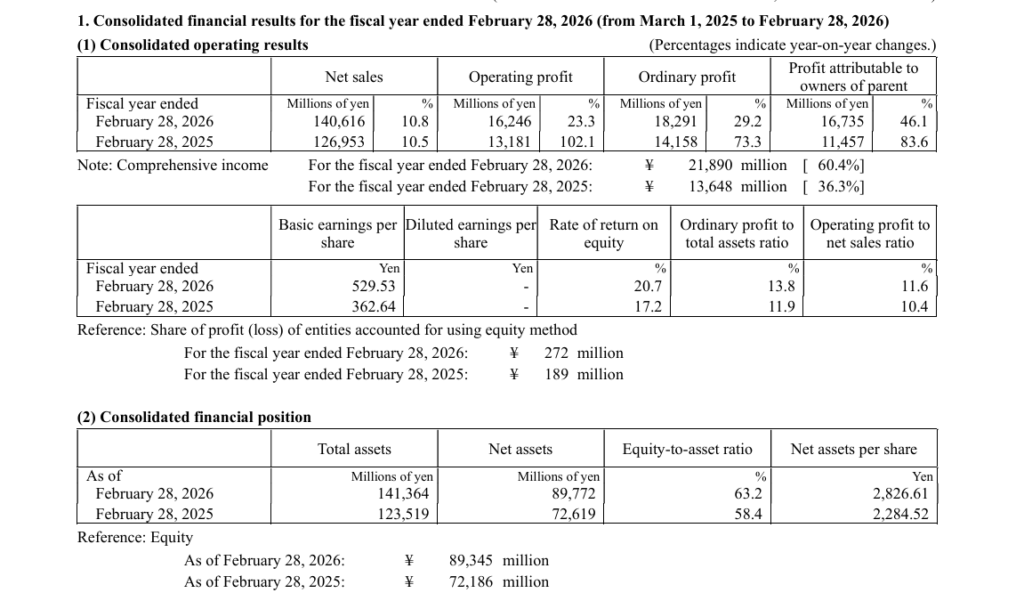
- Total net sales increased from ¥114.85 billion in FY2024 to about ¥126.95 billion in FY2025, reflecting growth of around 10.5% year on year.
- For the nine months ended November 30, 2025, net sales reached ¥102,756 million, rising from ¥93,600 million in the previous year period.
- Operating profit for 3Q FY2025 stood at ¥12,679 million with a margin of 12.3%, compared to ¥10,481 million and 11.2% margin in 3Q FY2024.
- Ordinary profit reached ¥14,323 million with a margin of 13.9%, increasing from ¥10,828 million and 11.6% margin a year earlier.
- Profit attributable to owners of the parent rose to ¥13,310 million with a margin of 13.0%, compared to ¥8,538 million in the previous year.
- For the six months ended August 31, 2025, net sales totaled ¥68,653 million, while operating profit reached ¥9,303 million and ordinary profit stood at ¥10,169 million.
- Profit attributable to owners of the parent for the six-month period was ¥10,190 million, with basic earnings per share at ¥322.48 compared to ¥160.42 in the prior year.
- The revised FY2025 forecast estimates net sales of ¥137,500 million, operating profit of ¥16,000 million, ordinary profit of ¥17,500 million, and profit attributable to owners of the parent of ¥15,500 million, with earnings per share projected at ¥490.49.
- The Marine Business generated net sales of about ¥89.4 billion with segment profit of approximately ¥13.21 billion, while the Industrial Business recorded net sales of about ¥10.7 billion with segment profit near ¥2.8 billion.
- The Wireless LAN Systems segment reported net sales of about ¥2.4 billion with segment profit of around ¥40 million, reflecting a decline compared to the previous year.
- Overall profitability remained stable, with gross margin around 39% to 40%, operating margin near 11% to 12%, and net profit margin in the range of 9% to 11%.
- Cash and cash equivalents stood at ¥16,905 million as of August 31, 2025, with total cash and deposits at ¥17,339 million.
- Operating cash flow for the six-month period reached ¥8,506 million, compared to ¥5,017 million in the previous year.
Beat or Miss?
Available company materials give detailed reported numbers and internal forecasts but do not disclose explicit analyst consensus figures, so “Beat or Miss” vs street estimates cannot be firmly quantified. However, upward revisions to full‑year guidance and strong double‑digit profit growth suggest management confidence that performance is ahead of internal plans and broadly positive relative to market expectations.
| Metric | Reported | Difference/Analysis |
| FY2025 Revenue | ¥126.95B (FY2024 actual reference) | Up ~10.5% YoY, record sales trajectory. |
| 3Q FY2025 Net Sales | ¥102.76B | +9.8% YoY, driven by Marine business. |
| 3Q FY2025 Operating Profit | ¥12.68B | +21.0% YoY, margin expansion to 12.3%. |
| 3Q FY2025 Profit Attributable | ¥13.31B | +55.9% YoY, aided by lower effective tax. |
| Six‑month EPS (to Aug 31, 2025) | ¥322.48 | Doubled YoY from ¥160.42. |
| FY2025 Full‑Year Sales Guidance | ¥137.50B | Raised vs prior outlook, targets new record. |
| FY2025 Profit Attributable Guidance | ¥15.50B | +35.3% YoY, implies higher EPS. |
| Analyst Consensus (Revenue/EPS) | N/A | No explicit street consensus disclosed. |
What Leadership Is Saying?
“Under our management vision ‘FURUNO GLOBAL VISION NAVI NEXT 2030,’ we are focused on achieving better safety, security, and comfort to foster a society and sea navigation that consider the needs of people and the environment, while entering the final year of Phase 2 and preparing new growth targets for Phase 3.”
“With net sales of ¥68.65 billion and operating profit of ¥9.30 billion in the first half, we have revised our full‑year forecast upward and also increased our dividend forecast, reflecting strong profitability and a solid financial base supported by higher operating cash flow.”
Historical Performance
The fiscal year ending February 28, 2026 (internally referred to as FY2025 in company slides) is on track to exceed the prior year on most key metrics, supported by Marine strength and disciplined cost control. The table below compares the current fiscal trajectory against the prior year on a full‑year basis using latest guidance and actuals.
| Category | FY2025 (guidance, FY ending Feb 28, 2026) | FY2024 (FY ending Feb 29, 2024) | Change (%) |
| Revenue | ¥137,500M | ¥126,953M | ≈ +8.3%. |
| Operating Profit | ¥16,000M | ¥13,181M | ≈ +21.4%. |
| Ordinary Profit | ¥17,500M | ¥14,158M | ≈ +23.6%. |
| Profit Attributable | ¥15,500M | ¥11,457M | ≈ +35.3%. |
| Operating Margin | 11.6% (guidance) | 10.40% | +1.2 points. |
| Basic EPS | ¥490.49 (guidance) | ¥362–398 range (implied) | Strong double‑digit rise. |
Historical Performance of Competitors
Direct peers include other Japanese and international marine electronics and navigation equipment makers, but the provided documents do not include comparable quarterly or yearly figures for rivals. Without consistent segment and fiscal‑period data for competitors, a reliable YoY numerical table cannot be constructed. Any attempt to estimate competitor revenue or margins from secondary market sources would be speculative and not aligned with the primary Furuno filings.
How the Market Reacted?
The Furuno materials do not state how the share price moved immediately after the latest FY2025 or quarterly results announcements. External price snapshots show the stock has been volatile over recent months, with periods of strong multi‑month gains and occasional pullbacks. Given the upward revision to full‑year guidance, strong Marine momentum, and higher dividend forecast, the overall tone of the report is bullish, though the exact after‑hours movement will depend on real‑time trading dynamics.
