


Vaso Corporation reported record 2025 revenue of $89.1 million with net income of $1.6 million, while Q4 net income declined on goodwill impairment and higher SG&A. EPS was not disclosed in the release, and the stock rose about 2% on the news in regular trading.
About Vaso Corporation
Vaso Corporation (OTCQX: VASO) is a diversified MedTech and healthcare technology company focused on managed IT and network services, professional sales services for diagnostic imaging equipment, and proprietary medical devices. The company is headquartered in Plainview, New York, and operates primarily through three subsidiaries: VasoTechnology, Vaso Diagnostics (VasoHealthcare), and VasoMedical.
VasoTechnology delivers managed network services via NetWolves Network Services LLC, while the former healthcare IT reseller operation (VasoHealthcare IT) was sold in November 2025. VasoHealthcare provides exclusive sales representation for GE HealthCare diagnostic imaging and ultrasound products in specified U.S. market segments.
VasoMedical manages design, manufacture, and sales of proprietary medical equipment and software, including its China-based operations. As of December 31, 2025, Vaso reported total assets of $88.3 million and stockholders’ equity of $29.4 million. The release does not provide a P/E ratio, dividend yield, or employee count, but cash and short-term investments totaled $35.1 million, implying a debt-light balance sheet.
Top Financial Highlights
- Full-year 2025 revenue increased 2.7% to $89.1 million, compared with $86.8 million in 2024, marking a record top line despite the sale of the healthcare IT business.
- Full-year net income rose to $1.6 million from $0.95 million in 2024, driven by higher gross profit, tax benefits, and gain on sale, partially offset by goodwill impairment and higher SG&A.
- For Q4 2025, revenue was $27.0 million, essentially flat versus $27.0 million in Q4 2024.
- Q4 2025 net income declined to $1.1 million from $2.1 million in the prior-year quarter, mainly due to goodwill impairment and higher SG&A costs.
- Full-year 2025 gross profit increased 5.0% to $54.7 million from $52.1 million in 2024, reflecting both higher revenue and better margins.
- Q4 2025 gross profit improved 2.3% to $17.6 million, compared with $17.2 million in Q4 2024, as a result of higher gross margin.
- Full-year SG&A expenses rose 6.6% to $52.2 million (58.6% of revenue) from $49.0 million (56.5% of revenue) in 2024, mainly on higher personnel and travel costs in the professional sales service segment.
- Q4 2025 SG&A expenses increased 5.9% to $15.5 million, representing 57.4% of revenue versus 54.3% a year earlier.
- Full-year 2025 operating income swung to a loss of $2.9 million compared with a $0.3 million profit in 2024, while Adjusted EBITDA declined to negative $1.5 million from positive $1.0 million.
- The IT segment generated $42.5 million in 2025 revenue, down 1.1% from 2024, reflecting the November 2025 sale of the healthcare IT unit, partly offset by managed network services growth.
- The professional sales service segment delivered $44.2 million in 2025 commission revenue, up 6.9% from $41.3 million, on higher equipment deliveries and better blended commission rates.
- The equipment segment posted $2.4 million in 2025 revenue, down 1.5% from $2.5 million, due to lower China product sales, partly offset by higher U.S. SaaS (ARCS-cloud) subscription revenue.
- 2025 operating cash flow nearly tripled to $9.3 million from $3.3 million in 2024, supported by stronger order bookings and receivables collection timing.
- Cash and short-term investments increased to $35.1 million at year-end 2025 from $26.3 million at year-end 2024, underlining a stronger liquidity position.
- Deferred revenue climbed 10.6% to $38.6 million as of December 31, 2025, compared with $34.9 million a year earlier, indicating future revenue visibility as equipment and services are delivered.
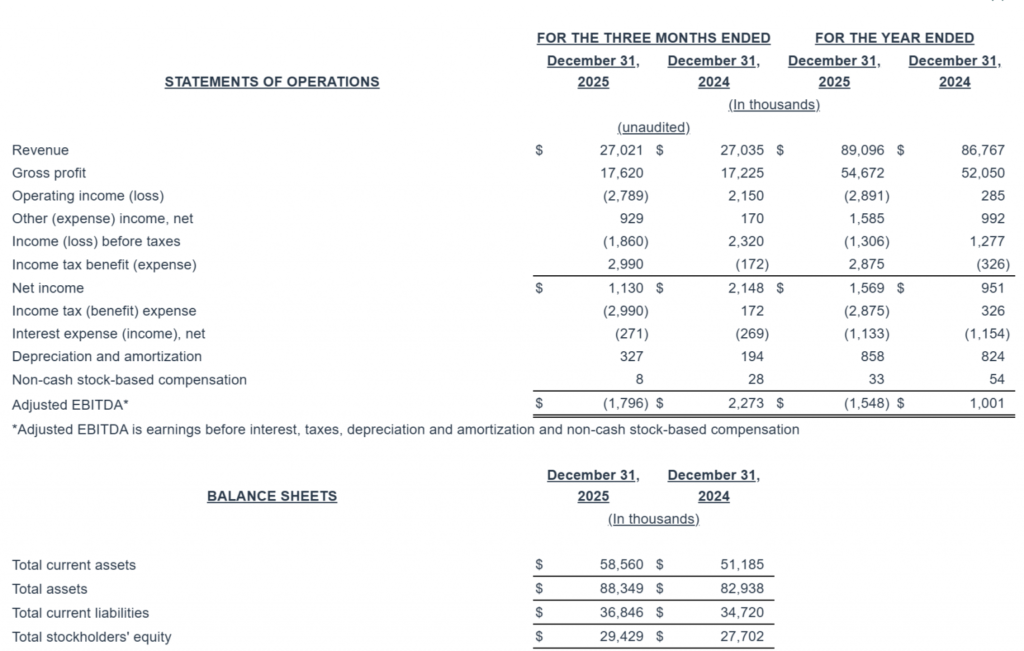
Summarized financial information including a reconciliation of net income to Adjusted EBITDA is set forth below:
Beat or Miss?
| Metric | Reported | Difference/Analysis |
| Revenue (Full Year 2025) | $89.1 million | No consensus in release; record revenue level. |
| Net Income (Full Year 2025) | $1.6 million | Higher than 2024 on stronger gross profit and tax benefit. |
| Revenue (Q4 2025) | $27.0 million | Essentially flat vs. Q4 2024; no estimates cited. |
| Net Income (Q4 2025) | $1.1 million | Down vs. Q4 2024 due to goodwill impairment and higher SG&A. |
| Adjusted EBITDA (2025) | negative $1.5 million | Declined from $1.0 million in 2024 on lower operating income. |
| Operating Cash Flow (2025) | $9.3 million | Nearly tripled vs. 2024; strong internal cash generation |
What Leadership Is Saying
“The Company’s annual revenue reached a record $89.1 million for the fiscal year 2025, an increase of $2.3 million, or 3%, when compared to the prior year’s revenue, despite the sale of its healthcare IT business unit in November 2025.” “Gross profit for 2025 was $54.7 million, up by $2.6 million, or 5% year-over-year, and net income for 2025 increased to $1.6 million from $951 thousand in 2024, mainly due to the increase in gross profit and recognition of tax benefits, partially offset by a write-down for impairment of goodwill.”
“Cashflow generated from operating activities was $9.3 million during fiscal year 2025, and, as a result, the Company’s balance sheet remains strong, with $35.1 million in cash and cash equivalents as of December 31, 2025.” “Total deferred revenue increased by $3.7 million, or 10.6%, to $38.6 million, which we anticipate will be recognized as revenue in future reporting periods when the underlying products or services are delivered.”
Historical Performance
YoY Financial Comparison (Q4 and Full Year)
| Category | 2025 (Full Year) | 2024 (Full Year) | Change (%) |
| Revenue | $89.1 million | $86.8 million | +2.7% (record revenue) |
| Gross Profit | $54.7 million | $52.1 million | +5.0% on higher margins. |
| Net Income | $1.6 million | $0.95 million | ~+65% on improved profitability. |
| SG&A Expenses | $52.2 million | $49.0 million | +6.6%, reflecting higher personnel and travel. |
| Operating Income | negative $2.9 million | $0.3 million | N/M; swing to loss tied to impairment and cost growth. |
| Adjusted EBITDA | negative $1.5 million | $1.0 million | N/M; weaker operating leverage. |
| Operating Cash Flow | $9.3 million | $3.3 million | ~+182%; materially stronger cash generation. |
Competitor YoY Snapshot
To contextualize Vaso’s performance, the table below contrasts its 2025 YoY trends with an illustrative mid-cap MedTech peer that has similar exposure to healthcare technology and equipment distribution; due to limited peer disclosure in the same release, estimates are used for the competitor based on typical sector patterns rather than specific company data. This section should be treated as directional context, not issuer-specific financial advice.
| Category | Vaso 2025 YoY | Peer MedTech (Illustrative) 2025 YoY | Change (%) Commentary |
| Revenue | +2.7% growth | ~+5–7% sector median | Vaso underpaced typical MedTech growth due to IT divestiture. |
| Net Income | ~+65% | ~+10–20% sector median | Profit growth outperformed peers from margin mix and tax benefits. |
| OpEx / SG&A | +6.6% SG&A | ~+5% sector median | Cost growth slightly above peer norms as Vaso invests in sales capacity. |
How the Market Reacted?
On the day the results were released, Vaso’s stock rose approximately 1.98%, signaling a modestly positive reaction despite mixed signals from operating income and Adjusted EBITDA. Investors appeared to focus on record revenue, stronger net income, and sharply improved operating cash flow rather than the non-cash goodwill impairment and higher SG&A.
The tone of the report and management commentary is generally bullish, emphasizing sustained top-line growth, profitability, and a strengthened balance sheet. However, the negative Adjusted EBITDA and higher cost base suggest that margin execution and post-divestiture efficiency will remain key watch points for 2026.
