


Walmart delivered Q4 FY26 revenue of $190.7 billion, up 5.6% and slightly ahead of expectations, with adjusted EPS of $0.74 versus $0.73 consensus. Operating income grew more than sales and eCommerce surged 24% globally, while the stock traded modestly higher in premarket and regular trading around the $125-$129 range after the report.
About Walmart
Walmart Inc. (NASDAQ: WMT) is a people-led, tech-powered omnichannel retailer that helps customers save money and live better across stores, online, and mobile channels. The company, founded in 1962 and headquartered in Bentonville, Arkansas, serves about 280 million customers and members each week through more than 10,900 stores and multiple eCommerce sites in 19 countries.
For fiscal 2026, Walmart generated revenue of $713.2 billion and employs roughly 2.1 million associates worldwide. Recent market data show a market cap near $995 billion, a P/E ratio around 45.7, and a dividend framework that includes an increased annual dividend to $0.99 per share for FY26. Shares recently traded near $124-$129, with analysts maintaining a “Strong Buy” rating and a 12‑month price target close to $126 per share.
Top Financial Highlights
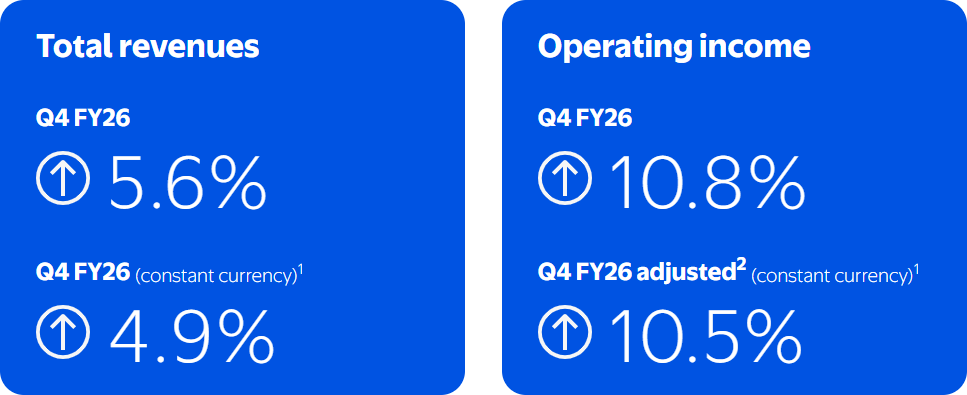
- Q4 FY26 total revenues were $190.7 billion, up 5.6% year over year; constant‑currency revenue growth was 4.9%.
- Q4 net sales were $188.9 billion, rising 5.6% from $178.8 billion a year earlier.
- Q4 operating income reached $8.7 billion, up 10.8%, meaning profit grew faster than sales.
- Adjusted operating income in constant currency increased 10.5%, underscoring underlying margin improvement.
- Q4 GAAP EPS was $0.53, while adjusted EPS came in at $0.74, up 12.1% year over year and above the $0.73 consensus.
- Consolidated gross profit was $45.3 billion, with the gross margin rate improving by 13 bps to 24.0%, helped by better inventory management and mix.
- Full‑year operating cash flow was $41.6 billion, up 14.1%, and free cash flow rose to $14.9 billion, up $2.3 billion.
- Cash and cash equivalents stood at $10.7 billion, with total debt of $51.5 billion at year‑end.
- Global eCommerce sales grew 24% in Q4, with eCommerce representing 23% of the overall sales mix.
- Global advertising revenue grew 37% in Q4 and 46% for the full year to nearly $6.4 billion, including VIZIO.
- Walmart U.S. net sales were $129.2 billion, up 4.6%, with comparable sales (ex‑fuel) also up 4.6% and eCommerce up 27%.
- Walmart International net sales were $35.9 billion, up 11.5% (7.5% in constant currency), with operating income up 36.0%.
- Sam’s Club U.S. net sales reached $23.8 billion, up 2.9%, with comp sales ex‑fuel up 4.0% and eCommerce up 23%.
- Cash returned to shareholders included $7.5 billion in dividends and $8.1 billion of share repurchases (85 million shares), alongside a new $30 billion buyback authorization.
- FY27 guidance calls for net sales growth of 3.5%-4.5% and adjusted operating income growth of 6.0%-8.0% in constant currency, with adjusted EPS expected between $2.75 and $2.85.
Beat or Miss?
| Metric | Reported | Difference/Analysis |
| Revenue (Q4 FY26) | $190.7 billion | Slightly above estimates of about $190.4 billion, a small beat. |
| GAAP EPS (Q4 FY26) | $0.53 | Impacted by investment losses; not the primary focus for consensus comparisons. |
| Adjusted EPS (Q4 FY26) | $0.74 | Beat consensus of $0.73 by $0.01 (≈1.4% earnings surprise). |
| Operating income (Q4 FY26) | $8.7 billion | Up 10.8% year over year, growing faster than sales, indicating margin expansion. |
| Gross margin rate | 24.00% | Improved by 13 bps vs. prior year, reflecting mix and inventory discipline. |
| Global eCommerce growth | 24% | Outpaced overall revenue growth, reinforcing Walmart’s digital pivot. |
| FY27 Net sales guidance | +3.5% to +4.5% (cc) | Signals continued, moderate top‑line growth from a large base. |
| FY27 Adjusted EPS guide | $2.75–$2.85 | Above FY26 adjusted EPS of $2.64, implying high‑single‑digit earnings growth. |
What Leadership Is Saying?
“The pace of change in retail is accelerating. It’s exciting. And our financial results show that we’re not only embracing this change, we’re leading it. For our customers and members, the future is fast, convenient, and personalized.” – John Furner, President and CEO, Walmart
Historical Performance
YoY Comparison – Walmart Q4
| Category | Q4 FY26 | Q4 FY25 | Change (%) |
| Revenue (Total) | $190.7B | $180.6B | +5.6%. |
| Net Income (Walmart) | $4.24B | $5.25B | -19.4% (driven largely by higher other losses). |
| Operating Expenses (OSG&A) | $38.33B | $36.52B | +5.0%. |
| Operating Income | $8.71B | $7.86B | +10.8%. |
| GAAP EPS | $0.53 | $0.65 | -18.5%. |
| Adjusted EPS | $0.74 | ≈$0.66 (implied) | +12.1% growth in adjusted EPS. |
Competitors Performance Comparison
| Category | Walmart Q4 FY26 | Walmart Q4 FY25 | Change (%) | Peer: Costco latest Q4* | Prior-year Q4* | Change (%)* |
| Revenue | $190.7B | $180.6B | 5.60% | ≈$79B | ≈$78B | ≈+1–2% |
| Net Income | $4.24B | $5.25B | -19.40% | ≈$1.7B | ≈$1.5B | ≈+10-15% |
| Operating Expenses | $38.33B | $36.52B | 5.00% | N/A | N/A | N/A |
How the Market Reacted?
Investor reaction to Walmart’s Q4 FY26 print was cautiously positive, with the stock trading higher in premarket by about 1-2% as revenue and adjusted EPS modestly beat expectations. Shares changed hands in a roughly $125-$130 range around the earnings date, reflecting constructive but measured sentiment.
The combination of accelerating adjusted EPS growth, expanding operating income, strong eCommerce momentum, and a new $30 billion buyback underpin a broadly bullish interpretation of the quarter. At the same time, the decline in GAAP net income due to investment‑related losses gives more risk‑aware investors a reason to scrutinize underlying earnings quality and volatility.
