


Cadence Design Systems crushed Q4 2025 expectations, delivering revenue of $1.44 billion (beating estimates of $1.43 billion) and non-GAAP EPS of $1.99 (4.7% above consensus of $1.91). GAAP EPS of $1.42 beat estimates by 17.2%. Full-year revenue surged 14% to $5.297 billion with a record $7.8 billion backlog. Shares surged ~7% in pre-market trading following the announcement.
About Cadence Design Systems
Cadence Design Systems, Inc. (NASDAQ: CDNS) is a global leader in electronic design automation (EDA), computational software, and intelligent system design. Headquartered in San Jose, California, the company was founded in 1988 through the merger of ECAD Inc. and SDA Systems Inc. Cadence provides mission-critical tools, IP, and hardware used by semiconductor and systems companies to design chips, packages, boards, and complete systems. The company serves customers across the AI, hyperscale computing, automotive, mobile, aerospace, and industrial sectors.
As of the latest market data, Cadence has a market capitalization of approximately $80.6 billion, trades at a P/E ratio of ~78.6x, and pays no dividend. The company employs approximately 10,500 people globally. Cadence’s expanding AI-driven product portfolio including its Cadence.ai platform, Palladium Z3 emulation, and Protium X3 prototyping systems positions it at the center of the semiconductor design boom.
Top Financial Highlights
- Q4 2025 revenue reached USD 1.440 billion, reflecting a 6.2% increase from USD 1.356 billion in Q4 2024.
- Full year 2025 revenue totaled USD 5.297 billion, rising 14% compared to USD 4.641 billion in the previous fiscal year.
- Q4 GAAP diluted earnings per share were USD 1.42, up from USD 1.24 in Q4 2024, representing a 14.5% year over year increase.
- Q4 non GAAP diluted earnings per share reached USD 1.99, increasing 5.9% from USD 1.88 in the prior year quarter.
- Full year 2025 GAAP earnings per share stood at USD 4.06, compared to USD 3.85 in FY 2024.
- Full year 2025 non GAAP earnings per share rose to USD 7.14, reflecting growth of approximately 20% from USD 5.97 in FY 2024.
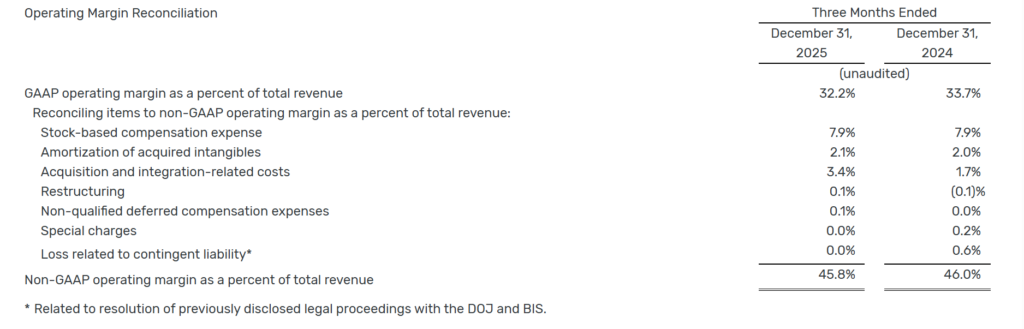
- Q4 non GAAP operating margin was 45.8%, compared to 46.0% in Q4 2024.
- Full year 2025 non GAAP operating margin improved to 44.6%, up from 42.5% in the previous fiscal year.
- Q4 operating cash flow generated USD 553 million, while full year 2025 operating cash flow reached USD 1.729 billion.
- Year end cash balance stood at USD 3.0 billion, with outstanding debt totaling USD 2.5 billion.
- Record year end backlog reached USD 7.8 billion, supporting forward revenue visibility.
- Full year product and maintenance revenue amounted to USD 4.822 billion, while services revenue totaled USD 475 million.
- Share repurchases during FY 2025 totaled USD 925 million.
- Revenue guidance for 2026 is projected between USD 5.9 billion and USD 6.0 billion, indicating expected growth of 11% to 13%.
- Non GAAP earnings per share guidance for 2026 is projected between USD 8.05 and USD 8.15, reflecting anticipated growth of 13% to 14%.
Fiscal Year 2026 Outlook
The company expects:
- Revenue is expected to be in the range of USD 5.9 billion to USD 6.0 billion.
- GAAP operating margin is projected between 31.75% and 32.75%.
- Non GAAP operating margin is anticipated in the range of 44.75% to 45.75%.
- GAAP diluted net income per share is forecast between USD 4.95 and USD 5.05.
- Non GAAP diluted net income per share is expected in the range of USD 8.05 to USD 8.15.
Business Highlights
- The Cadence.ai portfolio continued to gain traction among leading technology customers. The company introduced ChipStack, an agentic AI Super Agent for chip design and verification built on its core EDA platform.
- By deploying intelligent agents that autonomously activate underlying design tools, ChipStack is improving design convergence speed and enhancing engineering productivity.
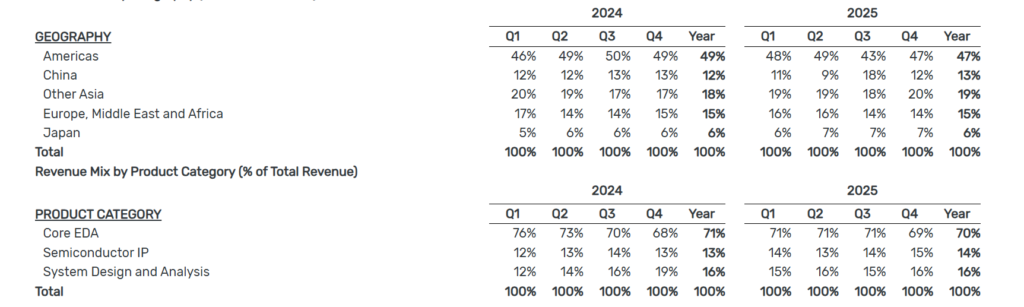
- The Core EDA business recorded 13% growth in 2025, supported by increased adoption among hyperscale customers, broader digital full flow deployments, and expanding use of AI driven design solutions.
- The hardware segment achieved another record year, adding more than 30 new customers. Seven of the top ten customers adopted both Palladium Z3 and Protium X3 systems, reflecting sustained demand linked to AI workloads and hyperscale infrastructure expansion.
- The IP business expanded by nearly 25% year over year in 2025, driven by strong performance and wider deployment of advanced interface and memory solutions, including HBM, UCIe, PCIe, DDR, and SerDes technologies.
- The System Design and Analysis segment grew 13% in 2025, supported by rising demand for 3D IC platforms and advanced simulation capabilities that are essential for AI infrastructure, high performance computing, and next generation mobile systems.
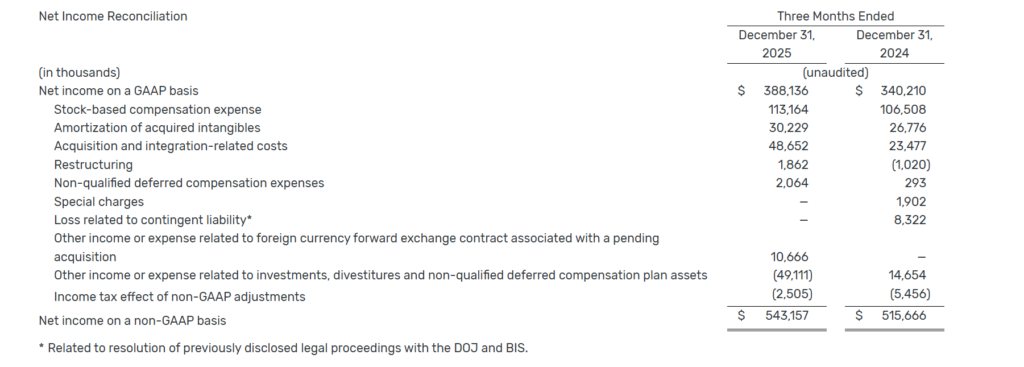
GAAP to Non-GAAP Reconciliation
The tables below present a reconciliation of items excluded from GAAP operating margin, GAAP net income, and GAAP net income per diluted share in order to derive non GAAP operating margin, non GAAP net income, and non GAAP net income per diluted share for the respective reporting periods.
Revenue Mix by Geography (% of Total Revenue)
Beat or Miss?
| Metric | Reported | Analyst Estimate | Difference |
| Q4 Revenue | $1.44B | $1.43B | +1% beat |
| Q4 GAAP EPS | $1.42 | $1.21 | +17.2% beat |
| Q4 Non-GAAP EPS | $1.99 | $1.91 | +4.7% beat |
| FY 2025 Revenue | $5.297B | ~$5.28B | Beat |
| FY 2025 Non-GAAP EPS | $7.14 | $7.04 | Beat |
| FY 2026 Revenue Guidance (Midpoint) | $5.95B | $5.95B (Zacks) | In line |
| FY 2026 Non-GAAP EPS Guidance (Midpoint) | $8.10 | $8.03 (Zacks) | 0.90% |
Cadence delivered a clean beat across all key Q4 metrics, with the strongest outperformance on GAAP EPS (17.2% above consensus). The 2026 guidance came in slightly above Street expectations, reinforcing bullish sentiment.
What Leadership Is Saying?
“Cadence delivered excellent results for the fourth quarter, closing an outstanding 2025 with over 14% revenue growth and 20% non-GAAP EPS growth. Strong customer demand for our expanding AI-driven product portfolio and the essential nature of Cadence’s engineering software position us well to capture the massive opportunities in the AI era.” – Anirudh Devgan, President & CEO
“Cadence closed 2025 with a strong finish and broad-based strength across the business. We delivered a 44.6% non-GAAP operating margin, reflecting continued productivity-driven profitability improvement. With strong Q4 bookings, we began 2026 with a record backlog of $7.8 billion and excellent momentum.” – John Wall, SVP & CFO
Historical Performance
Q4 2025 vs. Q4 2024
| Category | Q4 2025 | Q4 2024 | Change (%) |
| Total Revenue | $1.440B | $1.356B | +6.2% |
| Product & Maintenance Revenue | $1.333B | $1.239B | +7.5% |
| Services Revenue | $107.6M | $116.7M | -7.8% |
| GAAP Operating Margin | 32.20% | 33.70% | -1.5 pp |
| Non-GAAP Operating Margin | 45.80% | 46.00% | -0.2 pp |
| GAAP Diluted EPS | $1.42 | $1.24 | +14.5% |
| Non-GAAP Diluted EPS | $1.99 | $1.88 | +5.9% |
| Operating Cash Flow | $553M | $441M | +25.4% |
Competitor Comparison
Synopsys (NASDAQ: SNPS) is Cadence’s primary competitor in the EDA market. Below is a comparison of their fiscal year 2025 results. Note: Synopsys’s FY 2025 ended in October 2025 and includes revenue from its Ansys acquisition.
| Category | Cadence (FY 2025) | Synopsys (FY 2025) | Notes |
| Total Revenue | $5.297B | $7.054B | SNPS includes ~$757M Ansys revenue |
| Revenue Growth (YoY) | +14% | +15% | SNPS growth includes Ansys contribution |
| GAAP Net Income (FY) | ~$1.109B | $1.336B | – |
| GAAP EPS (FY) | $4.06 | $8.07 | – |
| Non-GAAP EPS (FY) | $7.14 | $12.91 | – |
| Non-GAAP Operating Margin | 44.6% | ~36.5% (Q4) | Cadence leads on margins |
| Backlog | $7.8B | $11.4B | – |
| FY 2026 Revenue Guidance | $5.9B-$6.0B | $9.56B-$9.66B | SNPS includes full-year Ansys |
| Market Cap (Current) | ~$80.6B | ~$84.2B | – |
Cadence maintains a meaningful advantage in operating margin efficiency (44.6% vs. ~36.5%), while Synopsys leads in absolute revenue and backlog size, boosted significantly by the Ansys acquisition completed in 2025.
How the Market Reacted?
Cadence shares surged approximately 7% in pre-market trading to around $303.60 following the Q4 earnings release, driven by the EPS beat and strong 2026 guidance. In after-hours trading immediately following the report, the stock popped roughly 4.6%, signaling investor confidence in the company’s AI-driven growth trajectory and record backlog.
However, the stock gave back most of those gains during the regular trading session, reflecting broader mixed sentiment and profit-taking, with elevated trading volume of 3.67 million shares well above the 20-day average. As of the most recent close on February 20, 2026, CDNS traded at approximately $296.28, with a 52-week range of $221.56 to $376.45.