


WSP Global posted a strong Q4 2025, with adjusted EPS of C$2.65 (beating consensus of C$2.61) and net revenues of C$3.67 billion (above the forecasted C$3.63 billion). Net earnings surged 53.6% YoY to C$256.3 million. Full-year free cash flow hit a record C$1.7 billion. Following the earnings release, WSP shares rose approximately 4.8% to US$172.35, reflecting positive investor sentiment toward the company’s execution and its ambitious 2026 guidance.
About WSP Global
WSP Global Inc. (TSX: WSP, OTC: WSPOF) is one of the world’s leading professional services and engineering consulting firms. Headquartered in Montreal, Canada, WSP traces its roots to 1959 through predecessor firm Genivar Inc. and the British-origin Williams Sale Partnership (founded 1969). The company was created in its current form in 2012 following Genivar’s takeover of WSP Group plc.
WSP provides advisory, planning, design, and project management services across transportation, infrastructure, environment, building, energy, water, and mining sectors. The firm operates in over 50 countries and employs approximately 83,000 professionals (including recent acquisitions), known internally as “Visioneers.”
As of the latest trading session, WSP carries a market capitalization of approximately US$23.2B (approximately C$33B), with a trailing P/E ratio of 35.32 and a dividend yield of 0.63%. The company is led by President and CEO Alexandre L’Heureux and CFO Alain Michaud. As of December 31, 2025, WSP reported approximately 74,400 employees (before the TRC Companies acquisition closed in February 2026) and total assets of C$20.84 billion.
Top Financial Highlights
Key data points from WSP Global’s Q4 2025 and full-year 2025 results:
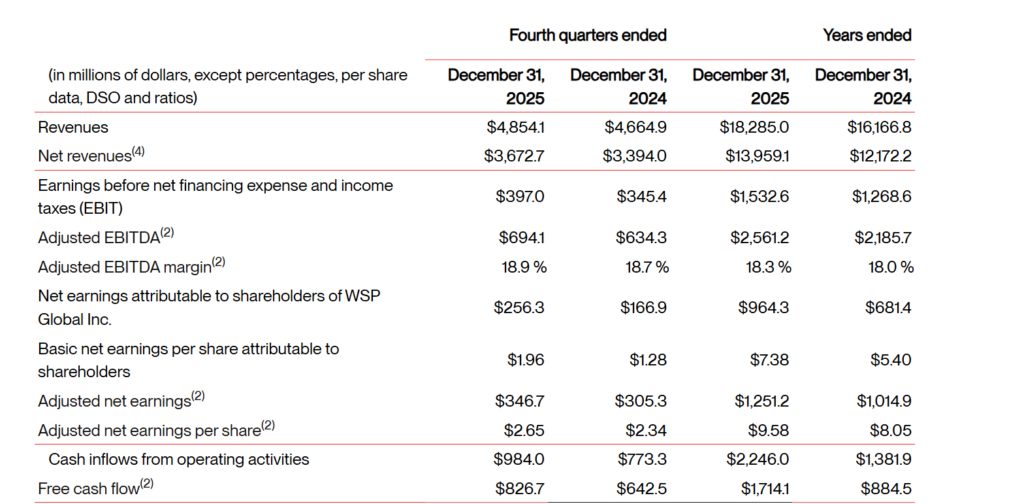
- Q4 revenue reached C$4.854 billion, reflecting a 4.1% year over year increase from C$4.66 billion in Q4 2024, indicating steady top line expansion despite a complex operating environment.
- Q4 net revenue rose to C$3.673 billion, up 8.2% year over year, supported by organic growth of approximately 5.9%, excluding the impact of emergency response activities and contract revisions.
- Q4 net income improved significantly to C$256.3 million or C$1.96 per share, marking a 53.6% increase compared to C$166.9 million or C$1.28 per share in the prior year period.
- Adjusted EBITDA for Q4 totaled C$694.1 million, representing a 9.4% increase from C$634.3 million in Q4 2024, with the adjusted EBITDA margin expanding slightly to 18.9% from 18.7%.
- Adjusted net earnings per share in Q4 increased to C$2.65, reflecting a 13.2% year over year rise and demonstrating improved operational efficiency and earnings quality.
- Operating cash flow for Q4 reached C$984.0 million, while free cash flow totaled C$826.7 million, highlighting strong cash conversion during the quarter.
- Full year revenue amounted to C$18.29 billion, up 13.1% year over year, reflecting broad based growth across business segments.
- Full year net revenue increased to C$13.96 billion, rising 14.7% year over year and reaching the upper end of management’s revised guidance range.
- Full year adjusted EBITDA totaled C$2.561 billion, up 17.2% year over year, exceeding the high end of the company’s outlook and demonstrating disciplined cost management.
- Free cash flow for the full year reached a record C$1.71 billion, equivalent to 1.8x net earnings attributable to shareholders, compared to C$884.5 million in 2024.
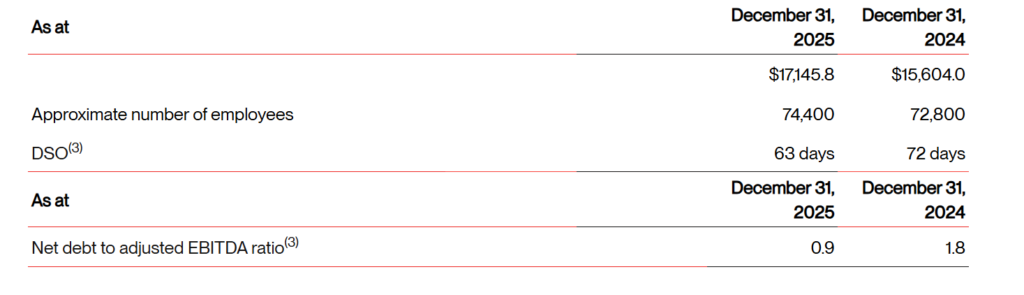
- Backlog stood at a record C$17.1 billion as of December 31, 2025, representing 11.0 months of revenues and reflecting a 9.9% year over year increase, which provides strong revenue visibility.
- Days sales outstanding improved to a record low of 63 days, compared to 72 days in December 2024, outperforming management’s outlook range of 67 to 73 days.
- Net debt to adjusted EBITDA was reduced to 0.9x, remaining below the company’s stated target range of 1.0x to 2.0x, indicating a conservative balance sheet position.
- The quarterly dividend was maintained at C$0.375 per share, resulting in a full year dividend of C$1.50 per share, underscoring continued commitment to shareholder returns.
Beat or Miss?
WSP beat analyst consensus estimates on both adjusted EPS and net revenue for Q4 2025.
| Metric | Reported | Consensus Estimate | Difference |
| Net Revenue (Q4) | C$3.673 billion | C$3.63 billion | +1.1% beat |
| Adjusted EPS (Q4) | C$2.65 | C$2.61 | +1.5% beat |
| Full-Year Adj. EBITDA | C$2.561 billion | C$2.540B-C$2.560B (outlook high end) | Exceeded high end |
| Full-Year Net Revenue | C$13.96 billion | C$13.80B-C$14.00B (outlook range) | At the high end |
| DSO | 63 days | 67-73 days (outlook range) | Significantly below low end |
What Leadership Is Saying?
CEO Alexandre L’Heureux on Strategy and Vision
“The first year of the 2025 to 2027 strategic cycle was completed with strong operational performance, supported by disciplined execution, productivity gains, and solid cash flow generation that strengthened the company’s foundation. Sustained demand across a diversified platform and a strong finish to 2025 provide clear visibility into the 2026 outlook. The integration of Ricardo and TRC has expanded strategic capabilities and created additional value opportunities. The company enters 2026 with confidence and a clear focus on long term stakeholder value creation.”
CFO Alain Michaud on Financial Performance
“I’m very, very pleased with our cash flow generation in 2025. Cash inflow from operating activities increased to C$2.25 billion in 2025, an improvement of C$865 million versus 2024. Full-year free cash flow totaled C$1.7 billion, representing 180% of our net earnings attributable to shareholders. This strong outcome reflects our ongoing focus on working capital management and optimization under our new ERP platform. DSO stood at 63 days as of December 31st, 9 days lower than at the same time last year, marking a record low level.”
Historical Performance
Q4 2025 vs. Q4 2024 YoY Comparison
| Category | Q4 2025 | Q4 2024 | Change (%) |
| Revenue | C$4,854.1M | C$4,662.6M | +4.1% |
| Net Revenue | C$3,672.7M | C$3,393.3M | +8.2% |
| Adjusted EBITDA | C$694.1M | C$634.3M | +9.4% |
| Adjusted EBITDA Margin | 18.90% | 18.70% | +20 bps |
| EBIT | C$397.0M | C$345.4M | +14.9% |
| Net Earnings (to Shareholders) | C$256.3M | C$166.9M | 53.60% |
| Basic EPS | C$1.96 | C$1.28 | +53.1% |
| Adjusted Net Earnings | C$346.7M | C$305.3M | +13.6% |
| Adjusted Net EPS | C$2.65 | C$2.34 | +13.2% |
| Operating Cash Flow | C$984.0M | N/A | N/A |
| Free Cash Flow | C$826.7M | N/A | N/A |
Full-Year 2025 vs. Full-Year 2024
| Category | FY 2025 | FY 2024 | Change (%) |
| Revenue | C$18,285M | C$16,164M | +13.1% |
| Net Revenue | C$13,959M | C$12,171M | +14.7% |
| Adjusted EBITDA | C$2,561M | C$2,186M | +17.2% |
| Adjusted EBITDA Margin | 18.30% | 17.90% | +39 bps |
| EBIT | C$1,533M | C$1,269M | +20.8% |
| Net Earnings | C$964.3M | C$681.4M | +41.5% |
| Basic EPS | C$7.38 | C$5.40 | +36.7% |
| Adjusted Net Earnings | C$1,251M | C$1,015M | +23.3% |
| Free Cash Flow | C$1,714M | C$884.5M | +93.8% |
| Backlog | C$17,146M | C$15,603M | 9.90% |
2026 Financial Outlook
WSP issued an ambitious 2026 guidance, which includes the anticipated contribution from the TRC Companies acquisition (closed February 24, 2026 for US$4.5 billion in cash).
| Category | FY 2025 | FY 2024 | Change (%) |
| Revenue | C$18,285M | C$16,164M | +13.1% |
| Net Revenue | C$13,959M | C$12,171M | +14.7% |
| Adjusted EBITDA | C$2,561M | C$2,186M | +17.2% |
| Adjusted EBITDA Margin | 18.30% | 17.90% | +39 bps |
| EBIT | C$1,533M | C$1,269M | +20.8% |
| Net Earnings | C$964.3M | C$681.4M | +41.5% |
| Basic EPS | C$7.38 | C$5.40 | +36.7% |
| Adjusted Net Earnings | C$1,251M | C$1,015M | +23.3% |
| Free Cash Flow | C$1,714M | C$884.5M | +93.8% |
| Backlog | C$17,146M | C$15,603M | 9.90% |
Key Assumptions for 2026
- Mid- to high-single-digit organic growth in Canada and the Americas; mid-single-digit growth in EMEIA; stable net revenues in APAC
- Q1 2026 net revenue expected between C$3.575B and C$3.775B; adjusted EBITDA between C$590M and C$630M
- Q1 2026 will have fewer billable days, impacting organic growth by approximately 1.5%, with offsets in Q2 and Q4
- At midpoint, management expects to deliver 40 basis points of margin improvement in 2026
- TRC Companies contribution included; the US$4.5B acquisition closed on February 24, 2026
- Acquisition, integration, and reorganization costs of C$210M-C$230M
- ERP implementation costs of C$50M-C$65M
Competitor YoY Comparison: Q4 Results
The table below compares Q4 performance of WSP Global’s key professional services competitors. Note that AECOM and Jacobs report on a fiscal year ending in September/October, so their “Q4 FY2025” refers to the July-September 2025 period. Arcadis reports on a calendar year basis.
| Company | Q4 Revenue | Q4 Revenue YoY Change | Q4 Net Income | Q4 EPS | Key Highlights |
| WSP Global (Q4 CY2025) | C$4.85B | +4.1% | C$256.3M | C$1.96 | Record backlog C$17.1B; adj. EBITDA +9.4% |
| AECOM (Q4 FY2025) | US$4.18B | +1.6% | US$137.7M | US$0.91 (GAAP) | Record Q4 net income (20-yr high); adj. EPS US$1.36 |
| Jacobs Solutions (Q4 FY2025) | US$3.15B | +6.6% | US$138M (GAAP) | US$1.05 (GAAP) | Adj. EPS US$1.75 (+27.7%); record backlog US$23.1B |
| Jacobs Solutions (Q4 CY2025) | US$3.29B | +12.3% | N/A | US$1.53 (adj.) | Beat estimates by 6.5% on revenue; backlog US$26.3B |
| Arcadis (Q4 CY2025) | EUR 887M (net) | -2.9% organic | N/A | EUR 2.33 (FY) | Property weakness; record FCF EUR 344M; headcount cut 1,100 |
Competitor Fiscal Year Comparison
| Company | FY Revenue | FY Revenue YoY | FY Adj. EBITDA | Backlog | 2026 Guidance |
| WSP Global | C$18.29B | +13.1% | C$2.561B (+17.2%) | C$17.1B | Net Rev C$16-17B; EBITDA C$3.0-3.18B |
| AECOM | US$16.1B | ~Flat | N/A | Record high | Adj. EPS US$5.65-5.85 (+9%); 20%+ margin by 2028 |
| Jacobs Solutions | US$12.0B | +4.6% | US$1.2B (+13.9%) | US$23.1B | Adj. EPS +16% growth at midpoint |
| Arcadis | EUR 3.76B | -0.5% organic | EUR 523M op. EBITDA (-6%) | EUR 3.6B | Organic growth: flat; EBITA margin 11.7-12.0% |
WSP Global outperformed all three peers on revenue growth and margin expansion. Arcadis stands out negatively with organic revenue contraction and margin compression driven by weakness in its Property and Investment segment. Jacobs delivered strong adjusted earnings growth and backlog expansion. AECOM showed modest revenue growth but set long-term margin targets of 20%+ by 2028.
How the Market Reacted?
Following the Q4 2025 earnings release after market close on February 25, 2026, WSP Global’s stock reacted positively. The shares rose approximately 4.78%, trading at approximately US$172.35 (the OTC listing) on the following trading day.
On the TSX, the stock opened at C$218.73 on February 25 and closed at C$224.92, before moving further on February 26 as investors digested the strong results. Investing.com reported the stock rose 2.01% to C$229.45 intraday on February 26, characterizing the movement as a reflection of “investor confidence in the firm’s strategic execution.”