


Southwest Airlines reported Q1 2026 EPS of $0.45 on record revenue of $7.25 billion, returning to solid profitability after a loss a year ago. Net income reached $227 million as margin expansion from its transformation plan offset higher fuel costs. Shares fell nearly 5% after hours as investors digested a cautious outlook and higher fuel guidance.
About Southwest Airlines Co.
Southwest Airlines Co. (NYSE: LUV) is a major U.S. low-fare carrier headquartered in Dallas, Texas, operating a large domestic and near‑international network with a single‑fleet Boeing 737 model strategy. Founded in 1967 and commencing operations in 1971, it is known for point‑to‑point scheduling and a focus on customer-friendly policies such as no change fees.
As of April 2026, Southwest has an estimated market cap of about $21.7 billion, placing it among the larger U.S. airlines by equity value. The company ended 2025 with roughly 72,790 employees, reflecting modest year‑over‑year headcount growth as it supports network expansion and new product initiatives. Southwest operates at 118 airports across 11 countries, emphasizing short‑ to medium‑haul routes and high aircraft utilization.
Its business model combines low‑cost operations with a growing mix of upsell products such as assigned seating, extra legroom, and loyalty‑driven credit‑card revenue. First‑quarter 2026 results show how this transformation is now translating into higher unit revenues, improved margins, and strong operating cash flow despite fuel headwinds.
Top Financial Highlights
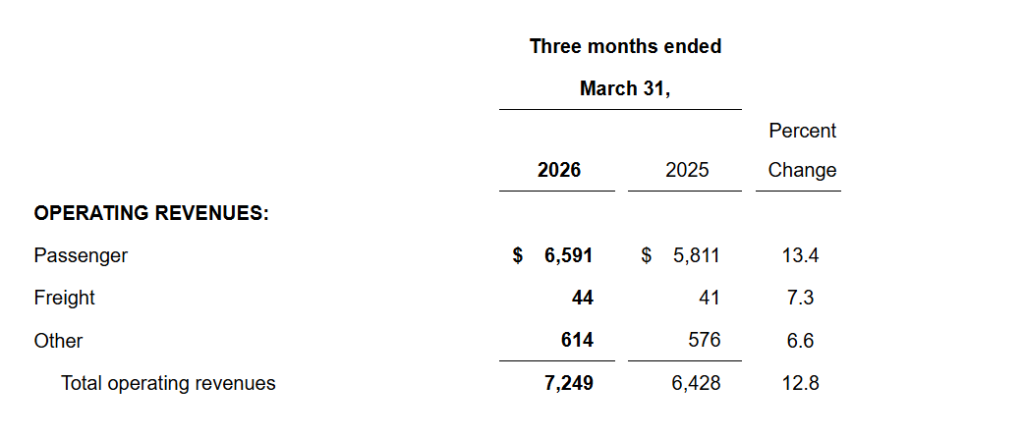
- Total operating revenue reached $7.25 billion, a 12.8% year‑over‑year increase and a first‑quarter record for the company.
- Passenger revenue rose to $6.59 billion, up 13.4% year‑over‑year, driven by new products and stronger yields.
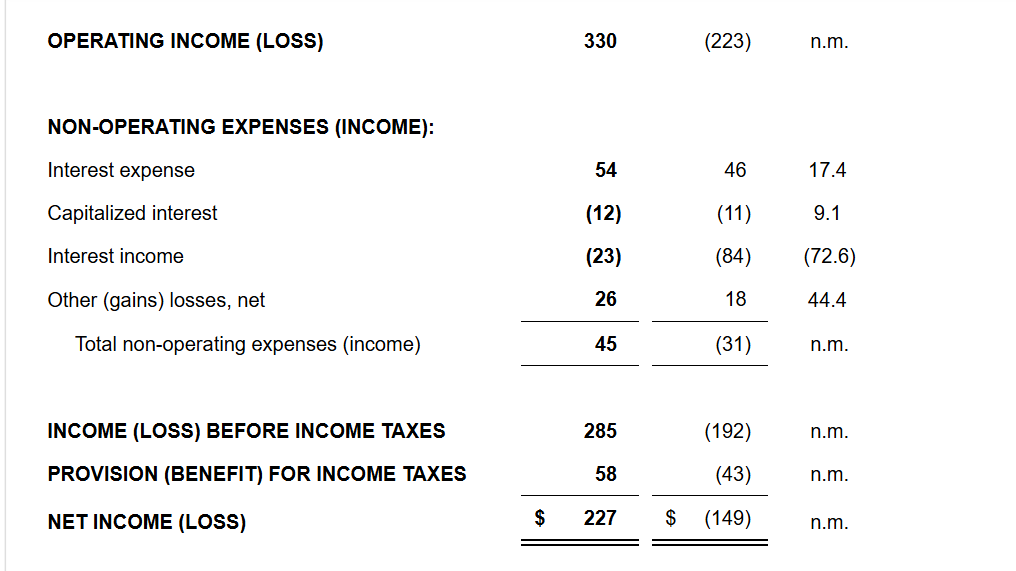
- Net income came in at $227 million, versus a $149 million net loss in Q1 2025, marking a return to profitability.
- Diluted EPS was $0.45, in line with company guidance and broadly matching Wall Street expectations.
- Operating margin was 4.6%, improving by 8.1 percentage points from a negative 3.5% a year ago.
- Operating cash flow totaled $1.4 billion, up 65% versus Q1 2025, reflecting higher earnings and strong advance bookings.
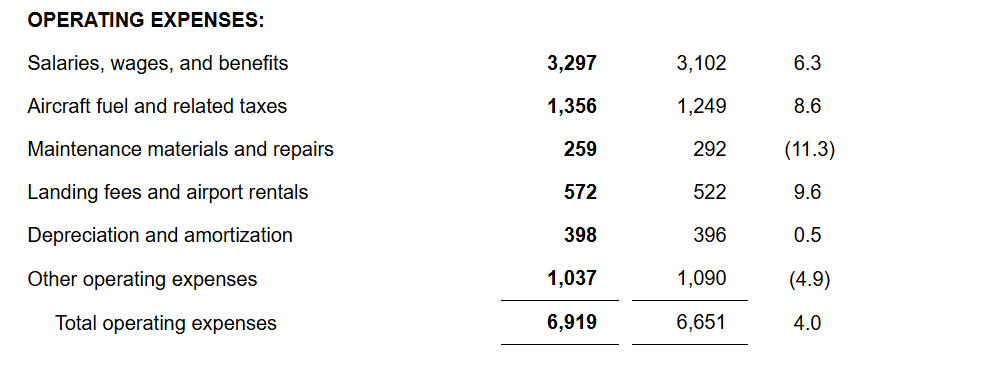
- Operating expenses were $6.92 billion, up just 4.0% year‑over‑year, with non‑fuel CASM‑X up 2.3%, showing continued cost discipline.
- Fuel cost per gallon was $2.73, above prior guidance of about $2.40, adding an estimated $164 million to fuel expense and about $0.22 headwind to EPS.
- Record unit revenues: RASM increased 11.2% year‑over‑year on 1.5% capacity growth, reflecting successful pricing and product initiatives.
- Segment / product performance: managed business revenue set March and quarterly records, rising 25% in March and 16% for the quarter versus last year.
- Customer upsell: roughly 60% of customers upgraded from the base product in Q1 2026, up from about 20% in 2025, supporting higher yields.
- Cash and liquidity: cash and cash equivalents stood at $3.3 billion, plus a $1.5 billion revolver, with leverage of 2.2x and $16.5 billion of unencumbered assets.
- Capital return: over $1.3 billion returned to shareholders in Q1 2026, including $1.25 billion of share repurchases and $93 million in dividends.
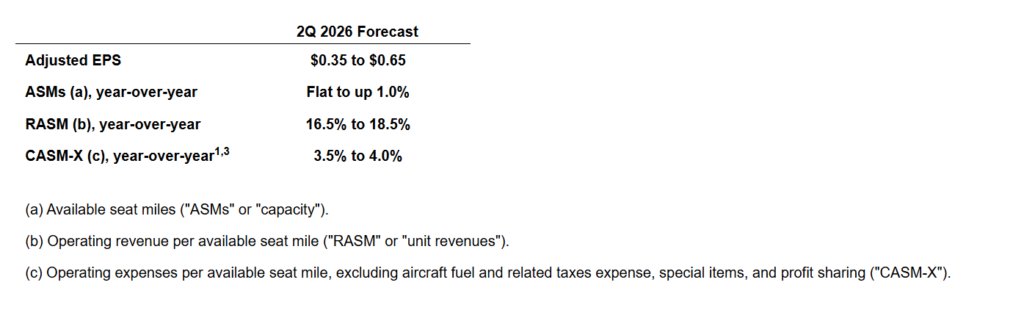
- Guidance (Q2 2026): adjusted EPS guided to $0.35–$0.65, with RASM expected to rise 16.5–18.5% year‑over‑year and CASM‑X to increase 3.5–4.0%.
- Fleet / capacity: capacity grew 1.5% year‑over‑year; Southwest ended the quarter with 800 aircraft and now expects about 2% full‑year 2026 capacity growth.
Southwest Airlines Co. Condensed Consolidated Statement of Income (Loss) (in millions, except per share amounts) (unaudited)
Guidance and Outlook
Beat or Miss?
| Metric | Reported | Estimated / Expected | Difference / Analysis |
| Revenue | $7.25 billion | Around $7.22–$7.25 billion consensus (varied by source) | Slight beat versus some Street models; broadly in line overall. |
| GAAP EPS | $0.45 | $0.45–$0.46 consensus | Essentially in line; a few sources note a $0.01–$0.02 miss versus high end. |
| Net income | $227 million | N/A | Represents a large swing from prior‑year loss; management framed it as on‑guidance. |
| Operating margin | 4.60% | N/A | Strong improvement from negative prior‑year margin, aided by revenue initiatives. |
| Q2 2026 adjusted EPS guide | $0.35–$0.65 | Consensus around $0.62 | Mid‑point a bit below consensus, contributing to cautious investor reaction. |
Overall, Q1 results were operationally strong with revenue and profit recovery, but guidance and fuel commentary read slightly conservative relative to some expectations.
What Leadership Is Saying?
“First quarter 2026 marked a turning point for Southwest, as our broad set of commercial, operational, and cost initiatives is now translating into terrific results. Demand for our new product offerings drove record first quarter revenues, double‑digit unit revenue growth, and significant improvement in earnings and margins despite significantly higher fuel costs.” – Bob Jordan, President & Chief Executive Officer
“Our transformation is showing through in stronger margins, cash generation, and balance sheet health. We generated $1.4 billion of operating cash flow in the quarter, expanded operating margin to 4.6%, and ended with $3.3 billion in cash plus a $1.5 billion revolver, while returning over $1.3 billion to shareholders.”
Historical Performance
YoY: Q1 2026 vs Q1 2025
| Category | Q1 2026 | Q1 2025 | Change (%) |
| Revenue | $7.25 billion | $6.43 billion | 12.80% |
| Net income (loss) | $227 million | –$149 million | n.m. (swing to profit) |
| Operating expenses | $6.92 billion | $6.65 billion | 4.00% |
| Operating margin | 4.60% | –3.5% | +8.1 % points |
| Operating cash flow | $1.4 billion | ~$0.85 billion (implied) | +65% (per company disclosure) |
| CASM‑X | 13.11 cents | 12.81 cents | 2.30% |
Competitors (YoY)
Q1 2026 vs Q1 2025 – Illustrative Context
| Category | Southwest Q1 2026 vs Q1 2025 | Delta Air Lines* Q1 2026 vs Q1 2025 | United Airlines* Q1 2026 vs Q1 2025 |
| Revenue | +12.8% year‑over‑year | High‑single to low‑double‑digit growth guided (preview) | High‑single‑digit growth guided (preview) |
| Net income | Loss of $149m to profit of $227m (n.m.) | Expected YoY earnings improvement (preview) | Expected YoY improvement but still volatile (preview) |
| Operating expenses | +4.0% year‑over‑year | Rising on fuel and labor; detailed Q1 yet to be reported | Rising on fuel and capacity; detailed Q1 yet to be reported |
How the Market Reacted?
Despite strong year‑over‑year improvement and record Q1 revenues, investors focused on higher fuel costs and a cautious Q2 earnings range. Several outlets report that Southwest’s stock fell nearly 5% after hours following the release, reflecting concern that elevated fuel prices and conservative guidance could limit upside in 2026.
Commentary also highlights that while EPS met internal guidance, it sat only in line or slightly below some analyst expectations, which may have tempered enthusiasm. Overall sentiment around the quarter is operationally bullish but market reaction is more guarded, as investors wait to see if revenue strength can continue to offset fuel headwinds and macro uncertainty