


Citigroup posted Q1 2026 EPS of $3.06 on revenue of $24.63 billion, beating consensus of $2.64 EPS and $23.53 billion in revenue. Net income jumped 42% year-over-year to $5.8 billion. Shares closed up 1.5% at $131.42, a 20-year high, after the beat.
About Citigroup Inc.
Citigroup Inc. (NYSE: C) is a leading global financial services holding company founded in 1812 and headquartered in New York City. The bank operates in more than 180 countries and jurisdictions, serving corporations, governments, institutions, investors, and individuals with banking, markets, wealth management, and consumer services. Citi is the third-largest bank in the United States by assets and is currently led by Chair and CEO Jane Fraser, who is executing a multi-year transformation and divestiture strategy.
Following the Q1 2026 print, the stock traded around $131.42, near a 20-year high, reflecting renewed investor confidence in the restructuring story. Book value per share stood at $112.22 and tangible book value per share at $99.01 at quarter end. Citi’s five interconnected businesses are Services, Markets, Banking, Wealth, and U.S. Consumer Cards, supplemented by Legacy Franchises inside All Other.
Top Financial Highlights
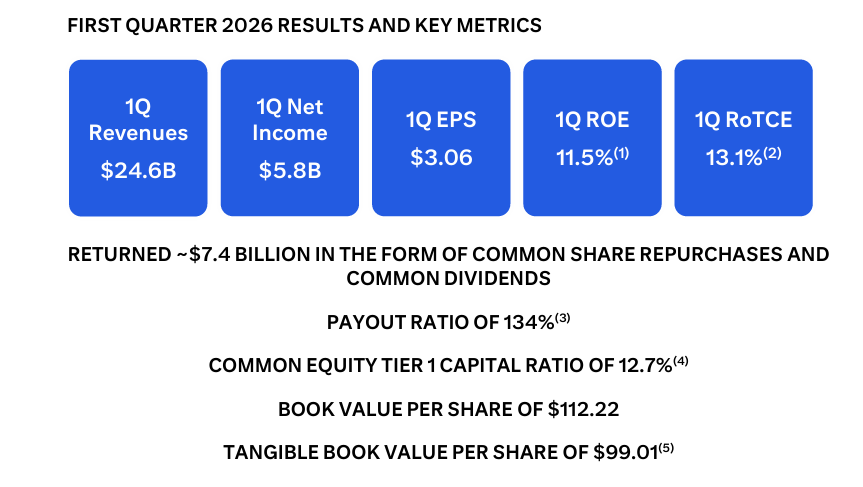
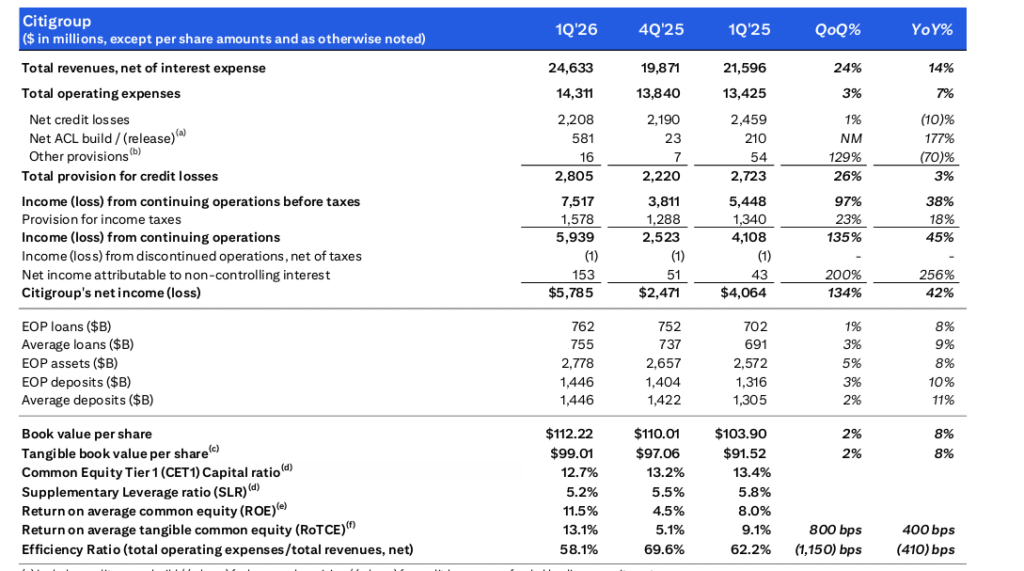
- Total Revenue of $24.63 Billion, up 14% year-over-year, the highest quarterly revenue in a decade
- Net Income of $5.8 Billion, up 42% from $4.1 billion a year earlier
- Diluted EPS of $3.06, up from $1.96, a 56% year-over-year surge
- Return on Tangible Common Equity (RoTCE) of 13.1% versus 9.1% in Q1 2025
- Efficiency Ratio improved to 58.1% from 62.2% a year earlier
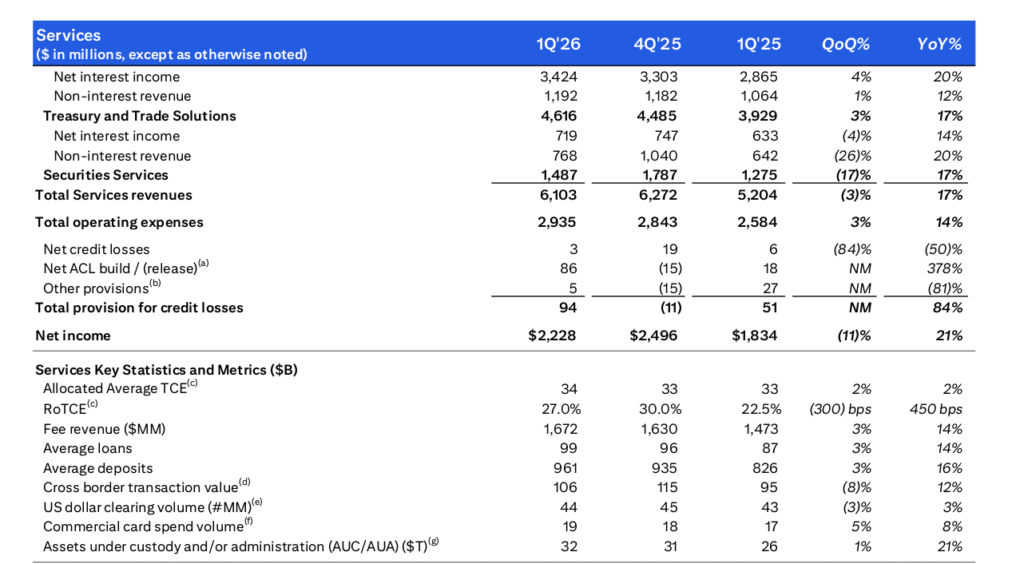
- Services segment revenue of $6.1 Billion, up 17%, with Treasury and Trade Solutions at $4.6 billion
- Markets segment revenue of $7.2 Billion, up 19%, including Equity markets at $2.1 billion (up 39%)
- Banking segment revenue of $1.8 Billion, up 15%, with Investment Banking fees up 12%
- Wealth revenue of $3.1 Billion, up 11%, with client investment assets up 14%
- U.S. Consumer Cards revenue of $4.8 Billion, up 4%, with RoTCE of nearly 20%
- Operating expenses of $14.3 Billion, up 7%
- Provision for credit losses of $2.8 Billion versus $2.7 billion a year earlier
- End-of-period deposits of approximately $1.4 Trillion, up 10%
- Capital returned to shareholders of $7.4 Billion via repurchases and dividends, with $6.3 billion in share buybacks
- CET1 Capital Ratio of 12.7% and full-year 2026 RoTCE target reaffirmed at 10% to 11%
Beat or Miss?
| Metric | Reported | Estimated/Expected | Difference/Analysis |
| EPS (Diluted) | $3.06 | $2.64 | Beat by $0.42 or +15.8% |
| Revenue | $24.63 Billion | $23.53 Billion | Beat by ~$1.10 Billion or +4.7% |
| Net Income | $5.8 Billion | N/A | Up 42% YoY |
| RoTCE | 13.10% | 10-11% target | Exceeded full-year target this quarter |
| Markets Revenue | $7.2 Billion | Consensus beat | Up 19% YoY, led by Equities +39% |
What Leadership Is Saying?
“We’re off to an exceptionally strong start in 2026, with revenue up 14% and net income growing 42%. Services had an outstanding quarter with revenue up 17% and Markets crossed $7 billion in revenue. Our diversified business model continues to drive consistent revenue growth and we remain a source of financial strength and trust for our clients during uncertain times.” – Jane Fraser, Chair and CEO
“We’ve entered into the final phase of our divestitures and 90% of our Transformation programs are now at or near our target state. We demonstrated our commitment to returning capital by repurchasing $6.3 billion shares during the quarter. We remain very much on track to deliver the 10-11% RoTCE target this year.” – Jane Fraser, Chair and CEO, on financial strategy and capital returns
Historical Performance
| Category | Q1 2026 | Q1 2025 | Change (%) |
| Total Revenue | $24.63 Billion | $21.60 Billion | 14% |
| Net Income | $5.8 Billion | $4.1 Billion | 42% |
| Operating Expenses | $14.31 Billion | $13.43 Billion | 7% |
| Diluted EPS | $3.06 | $1.96 | 56% |
| Provision for Credit Losses | $2.81 Billion | $2.72 Billion | 3% |
Competitors
| Category | Q1 2026 | Q1 2025 | Change (%) |
| JPMorgan Chase Revenue | $50.5 Billion | $45.9 Billion (implied) | 10% |
| JPMorgan Chase Net Income | $16.5 Billion | $14.6 Billion | 13% |
| JPMorgan Chase Diluted EPS | $5.94 | $5.07 | 17% |
| Bank of America Revenue | $30.43 Billion | $28.39 Billion (implied) | 7.20% |
| Bank of America Net Income | $8.6 Billion | $7.4 Billion (implied) | 17% |
| Bank of America Diluted EPS | $1.11 | $0.89 (implied) | 25% |
How the Market Reacted?
Citigroup shares responded positively to the beat, closing up 1.5% at $131.42 on April 14, 2026, marking a 20-year high as the reorganization thesis gained traction. In post-earnings coverage, the stock touched a new 52-week intraday high of $130.99, reflecting investor enthusiasm over the 15.8% EPS beat, record-decade revenue, and RoTCE of 13.1% exceeding the full-year 10-11% target.
Sentiment turned decisively bullish, with analysts highlighting broad-based strength across all five business segments, disciplined expense control, and the completion of 90% of the transformation program as catalysts. Capital return intensity, including $6.3 billion in buybacks and a 134% payout ratio, further reinforced the constructive view heading into the May Investor Day.