


CME Group reported diluted EPS of $3.18 (adjusted $3.36) on record revenue of $1.88–1.90 billion, up 14% year on year, but slightly below analyst revenue expectations of about $1.90 billion and adjusted EPS estimates of $3.38, while shares showed typical after-hours movement around the release time.
About CME Group Inc.
CME Group Inc. (NASDAQ: CME) is a leading global derivatives marketplace that operates futures, options, cash and OTC markets across interest rates, equity indexes, FX, energy, agricultural commodities and metals, as well as central counterparty clearing through CME Clearing. The company traces its roots to the Chicago Mercantile Exchange, originally founded in 1898, and is headquartered in Chicago, Illinois. As of mid‑April 2026, CME’s market capitalisation is roughly $103–111 billion, placing it among the largest financial services firms globally.
CME stock recently traded around the high‑$270s to high‑$280s per share, with a P/E ratio in the mid‑20s and a dividend yield in the low‑to‑mid single digits based on recent distributions. The group maintains a shareholder‑friendly capital return policy, combining a regular quarterly dividend (recently raised to $1.30 per share) with an annual variable dividend linked to prior‑year results. This structure underscores CME’s strong cash generation and disciplined capital management focus.
Top Financial Highlights
- Record total revenue of $1.88-1.90 billion, up 14% year on year for Q1 2026.
- Clearing and transaction fee revenue of $1.54 billion, a quarterly record, driven by strong derivatives trading volumes.
- Market data revenue of $224 million, also a record for the quarter.
- Operating income of $1.31 billion, versus $1.11 billion a year earlier, reflecting strong operating leverage.
- Adjusted operating income of $1.37 billion, up from $1.17 billion in Q1 2025.
- Net income of $1.15 billion, up from $0.96 billion in the prior‑year quarter, a 20% increase.
- Diluted EPS of $3.18, with adjusted diluted EPS of $3.36, both up about 20% year on year.
- Average daily volume (ADV) of 36.2 million contracts, a record and 22% higher than Q1 2025, with non‑US ADV at a record 11.4 million.
- ADV growth was broad‑based, with records across all six major asset classes, including interest rates, equity indexes, FX, energy, agricultural commodities and metals.
- Average rate per contract (RPC) of $0.652, down from $0.707 in Q1 2025, reflecting mix shifts.
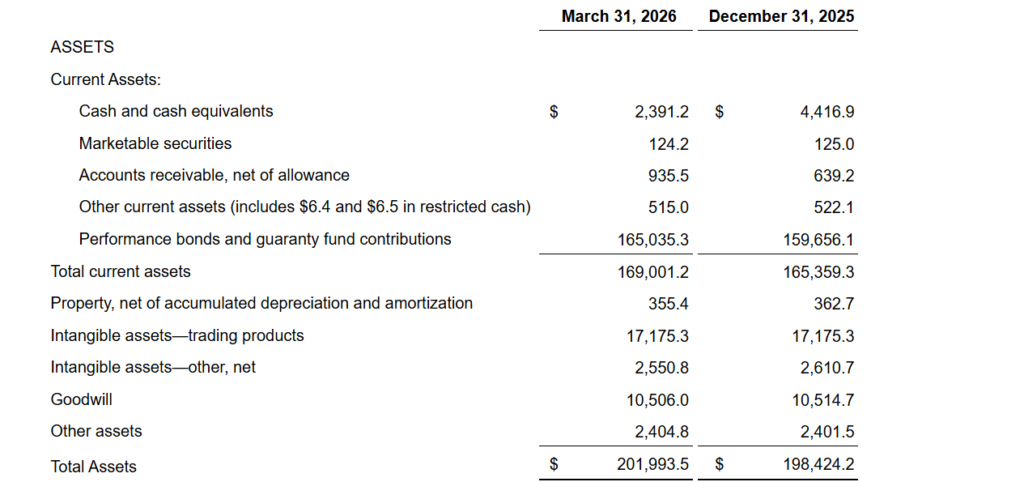
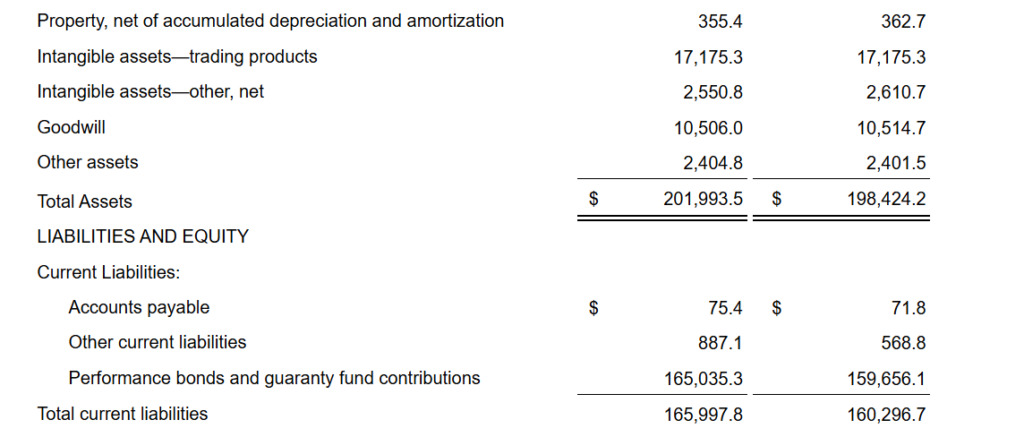
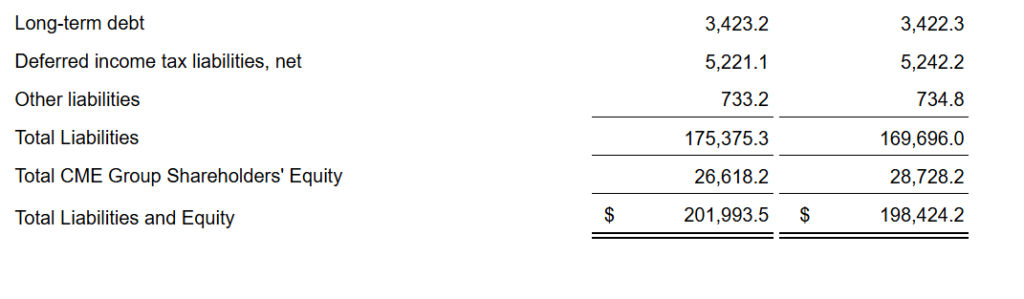
- As of March 31, 2026, CME held $2.6 billion in cash (including restricted amounts) and $3.4 billion of debt, underpinning a solid balance sheet.
- The company returned substantial capital, paying about $2.7 billion in dividends and repurchasing $536 million of common shares in Q1 2026.
- Q1 2026 revenue growth of 14% and adjusted net income and adjusted diluted EPS growth of 20% highlight margin expansion and efficiency gains.
- Management reiterated its focus on innovation and extending cross‑margining solutions, including expanded FICC cross‑margining to end‑user clients.
- No specific quantitative guidance for Q2 2026 was disclosed in the release; management instead emphasised continued client demand and a strong start to 2026.
Beat or Miss?
Analyst consensus pointed to slightly higher revenue and adjusted EPS than CME ultimately reported, so the quarter is best characterised as a fundamental beat in growth terms, but a modest miss versus Street expectations.
| Metric | Reported | Difference / Analysis |
| Revenue | $1.88–1.90 billion | Came in around $1.88–1.90 billion vs. ~$1.895–1.91 billion consensus, a small miss. |
| GAAP diluted EPS | $3.18 | Above prior‑year $2.62–2.63, but key EPS comparison vs. consensus is on adjusted basis. |
| Adjusted diluted EPS | $3.36 | Slightly below $3.38 consensus estimate, about a 0.6% miss. |
| Net income | $1.15 billion | Up 20% year on year, reflecting strong operating leverage and volume growth. |
| Operating income | $1.31 billion | Increased versus $1.11 billion in Q1 2025, with margins at historically high levels. |
| Operating margin (approx.) | ~70%+ | Implied by operating income versus revenue, demonstrating very high profitability. |
| Q2 2026 guidance | N/A | No explicit quantitative guidance provided in the press release. |
What Leadership Is Saying?
Heightened global risk conditions have strengthened demand for CME Group’s regulated markets, leading to a strong start in 2026. Q1 average daily volume increased by 22% to a record 36.2 million contracts across all asset classes. This momentum supported a 14% rise in revenue and 20% growth in adjusted net income and diluted EPS. Margin efficiencies exceeded $85 billion in daily savings, while continued product innovation and expanded cross margining are expected to support future growth.” – Terry Duffy, Chairman and Chief Executive Officer.
While the Q1 2026 press release emphasises adjusted operating income of $1.37 billion, adjusted net income of $1.22 billion and adjusted diluted EPS of $3.36, it does not attribute a separate quote specifically to the Chief Financial Officer; these figures nevertheless reflect the finance organisation’s focus on expense discipline, non‑GAAP margin expansion and sustained investment in technology and market infrastructure.
Historical Performance
The year‑on‑year comparison shows that CME translated elevated trading activity into double‑digit revenue growth and faster profit expansion in Q1 2026.
CME Group YoY (Q1 2026 vs Q1 2025)
| Category | Q1 2026 | Q1 2025 | Change (%) |
| Revenue | $1.88 billion | $1.64 billion | +14%. |
| Net income | $1.15 billion | $0.96 billion | +20%. |
| Total expenses | $570.4 million | $534.3 million | +7%, below revenue growth. |
| Operating income | $1.31 billion | $1.11 billion | +18%. |
| Adjusted net income | $1.22 billion | $1.02 billion | +20%. |
| Diluted EPS | $3.18 | $2.62 | +21%. |
| Adjusted diluted EPS | $3.36 | $2.80 | +20%. |
Revenue gains significantly outpaced expense growth, lifting both GAAP and adjusted operating margins. Higher ADV across all product lines contributed to record clearing and transaction fee revenue and record market data revenue in the quarter.
Competitor Context
Direct Q1 2026 reported figures for close listed peers (such as ICE or Cboe) are not contained in CME’s own release, and full, directly comparable YoY data for the same quarter are not available within the provided documents. As a result, a precise competitor YoY table (with revenue, net income and operating expenses for Q1 2026 vs Q1 2025 by name) cannot be constructed solely from this source set.
However, commentary from external coverage highlights that CME’s 14–14.5% revenue growth and ~20% adjusted EPS growth place it toward the stronger end of large exchange operators in early 2026, particularly given record volumes and high‑70s to low‑80s pre‑tax margins. Where peers have reported mid‑single‑digit to low‑double‑digit revenue growth in recent quarters, CME’s Q1 performance appears relatively robust, though exact peer‑by‑peer percentages are not fully disclosed in these materials.
How the Market Reacted?
The release and external coverage characterise Q1 2026 as a record quarter operationally, but note that both revenue and adjusted EPS landed slightly below analyst expectations. Commentary around the result describes it as a solid fundamental performance with a “small miss” on the headline consensus numbers, which typically leads to a muted or modestly negative near‑term share reaction rather than a sharp rally.
At the same time, high margins, strong cash returns (dividends and buybacks) and record ADV underpin a broadly constructive medium‑term sentiment toward the stock. In the absence of a specific percentage move in the text, the report overall can be viewed as fundamentally bullish on CME’s franchise, but tactically tempered by the slight miss versus Street estimates.