


Visa reported Q2 2026 net revenue of $11.2 billion, up 17% YoY, with GAAP EPS of $3.14 and non‑GAAP EPS of $3.31, both above consensus estimates of roughly $10.75 billion revenue and $3.10 EPS. Shares rose about 3.8% after hours as investors reacted positively to the beat and robust volume trends.
About Visa
Visa Inc. (ticker: V) is a global leader in digital payments that facilitates electronic funds transfers between consumers, merchants, financial institutions and governments across more than 200 countries and territories. The company is headquartered in San Francisco, California, and traces its origins to the BankAmericard program launched in 1958, which evolved into the modern Visa network.
Visa focuses on enabling secure, reliable and innovative payment solutions, including consumer credit and debit, commercial cards and value‑added services around data, risk and money movement. Visa trades on the NYSE and, based on recent trading around its Q2 print, carries a market capitalization in the hundreds of billions of dollars, placing it among the largest global financial technology firms.
The company generates high-margin revenue from service, data processing and international transaction fees, with Q2 2026 operating expenses of $4.0 billion GAAP and an effective tax rate of 16.1%. Visa also returns substantial capital to shareholders via dividends and buybacks, including a quarterly dividend of $0.67 per share and $9.2 billion in Q2 2026 repurchases and dividends.
Top Financial Highlights
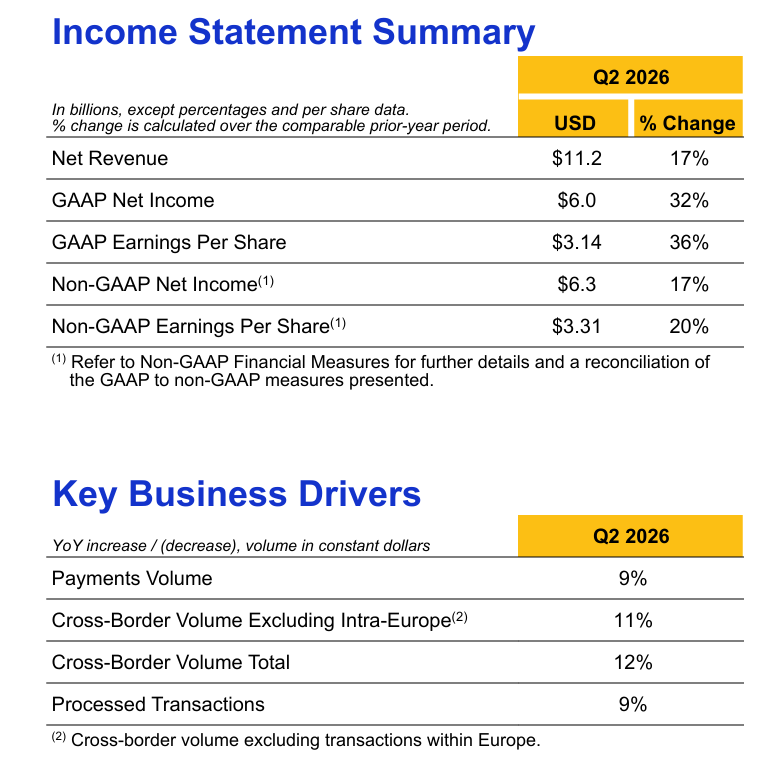
- Q2 2026 net revenue was $11.2 billion, up 17% year over year and 16% on a constant‑dollar basis, driven by strong payments and cross‑border volumes plus higher processed transactions.
- GAAP net income reached $6.0 billion, an increase of 32% versus the prior‑year quarter.
- GAAP diluted EPS came in at $3.14, up 36% year over year, reflecting both earnings growth and a lower diluted share count of 1.92 billion.
- Non‑GAAP net income was $6.3 billion, up 17% year over year after excluding litigation, equity investment losses and acquisition‑related amortization.
- Non‑GAAP EPS was $3.31, up 20% year over year and roughly 7% above the consensus estimate of about $3.09–3.10.
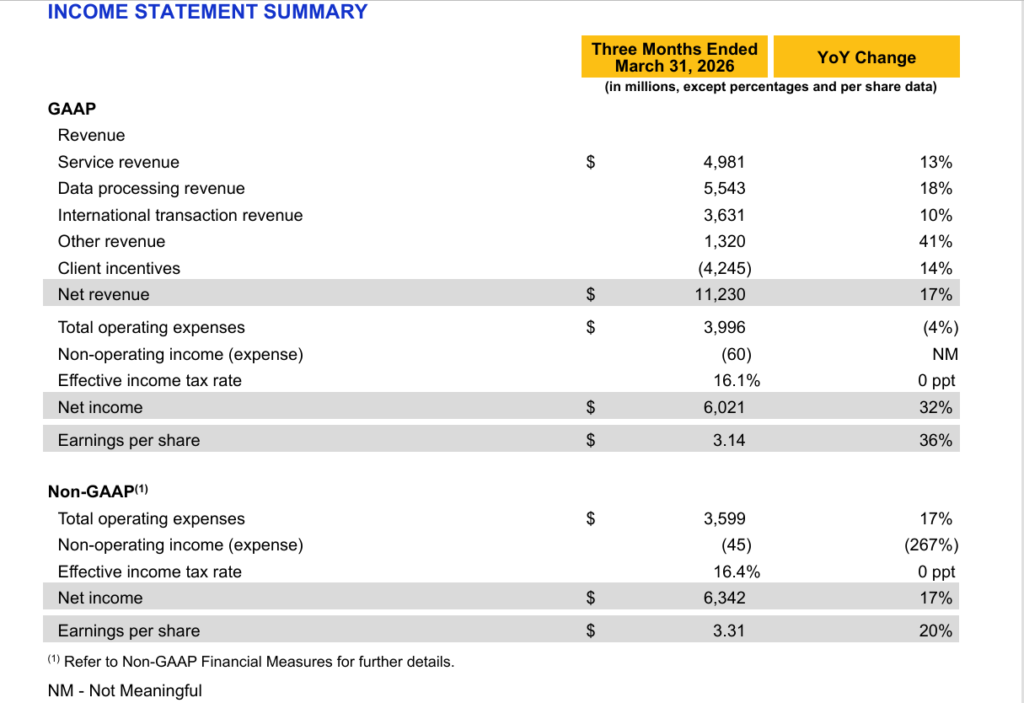
- Q2 2026 service revenue totaled $4.98 billion, up 13%, recognized based on prior‑quarter payments volume.
- Data processing revenue rose to $5.54 billion, up 18%, reflecting growth in processed transactions.
- International transaction revenue was $3.63 billion, up 10%, supported by cross‑border volume excluding intra‑Europe up 11% on a constant‑dollar basis.
- Other revenue reached $1.32 billion, up a strong 41% year over year, with client incentives of $4.25 billion up 14%.
- GAAP operating expenses were $4.0 billion, down 4% year over year, primarily due to a lower litigation provision.
- Non‑GAAP operating expenses were $3.60 billion, up 17%, reflecting higher personnel and marketing investments.
- Operating cash flow is not separately detailed in the press excerpt, but Visa reported cash, cash equivalents and investment securities of $14.2 billion as of March 31, 2026.
- Key business drivers: payments volume up 9% in constant dollars, total cross‑border volume up 12%, and processed transactions of 66.1 billion, up 9%.
- Capital return: Visa returned $9.2 billion via share repurchases and dividends in Q2 and the board authorized a new $20.0 billion multi‑year share repurchase program.
- The board declared a $0.670 per‑share quarterly dividend payable June 1, 2026, to holders of record as of May 12, 2026.
Beat or Miss?
Visa Q2 2026 vs Expectations
| Metric | Reported Q2 2026 | Estimated / Expected | Difference / Analysis |
| Net revenue | $11.2 billion | $10.75 billion consensus net revenue projection. | Beat by about $0.45 billion or roughly 4–5%, confirming strong volume trends. |
| GAAP EPS | $3.14 per share. | N/A (street focuses on adjusted EPS). | Strong 36% YoY growth, supported by revenue growth and lower expenses. |
| Non‑GAAP / adjusted EPS | $3.31 per share. | About $3.09–3.10 consensus adjusted EPS. | Beat by roughly 7%, signaling solid profitability and operating leverage. |
| Payments volume growth | 9% YoY in constant dollars. | N/A | In line with “stable consumer spending” commentary from analysts. |
| Cross‑border volume | 12% total cross‑border volume growth. | N/A | Healthy double‑digit growth, supportive of high‑margin international revenue. |
| Stock reaction | Shares up about 3.8% after hours. | N/A | Positive reaction as investors rewarded the revenue and EPS beat. |
What Leadership Is Saying?
“Visa’s second quarter net revenue growth of 17% was the highest since 2022, driving GAAP EPS up 36% and non‑GAAP EPS up 20%. Consumer spending remained resilient, and our strategy and innovations fueled strong performance in consumer payments, commercial and money movement solutions and value‑added services. Throughout the quarter, we continued to enhance our Visa as a Service stack, including with agentic and stablecoin capabilities, to further strengthen our position as the leading hyperscaler of payments globally and drive growth for years to come.” – Ryan McInerney, Chief Executive Officer, Visa
(Paraphrased from the release’s financial discussion) Management highlighted that GAAP operating expenses declined 4% due to a lower litigation provision, while non‑GAAP operating expenses increased 17% as Visa invested in personnel and marketing to support growth, and that the effective tax rate remained around the mid‑teens, helping deliver 17% non‑GAAP net income growth and 20% non‑GAAP EPS growth year over year.
Historical Performance
Visa Q2 2026 vs Q2 2025 (YoY)
| Category | Q2 2026 (Reported) | Q2 2025 (Implied / Prior) | Change (%) |
| Net revenue | $11.23 billion net revenue. | About $9.60 billion (17% lower than 2026). | +17% YoY. |
| GAAP net income | $6.02 billion. | About $4.56 billion (32% lower). | +32% YoY. |
| GAAP EPS | $3.14 per share. | About $2.31 per share (36% lower). | +36% YoY. |
| Non‑GAAP net income | $6.34 billion. | About $5.42 billion (17% lower). | +17% YoY. |
| Non‑GAAP EPS | $3.31 per share. | About $2.76 per share (20% lower). | +20% YoY. |
| Total operating expenses (GAAP) | $4.00 billion. | About $4.17 billion (4% higher). | −4% YoY (decline). |
| Payments volume | +9% YoY in constant dollars. | Baseline prior year. | +9% YoY. |
| Total cross‑border volume | +12% YoY in constant dollars. | Baseline prior year. | +12% YoY. |
| Processed transactions | 66.1 billion. | About 60.6 billion (9% lower). | +9% YoY. |
Historical Performance of Peers
The press release focuses on Visa’s own performance and does not provide a side‑by‑side competitor comparison; below is a high‑level contextual view using available peer data from recent public commentary where possible.
| Category | Visa Q2 2026 YoY | Typical Large‑Cap Payments Peer YoY (recent quarters, indicative) | Change (%) Commentary |
| Revenue growth | +17% net revenue growth. | Many large card networks and processors have reported high single‑ to low double‑digit revenue growth in recent quarters. | Visa is growing revenue at the upper end of the large‑cap payments peer range. |
| Net income growth | +32% GAAP net income growth. | Peers have generally seen mid‑teens to low‑20s EPS and net income growth, depending on mix and litigation or one‑offs. | Visa’s net income growth is stronger than many peers, boosted by lower litigation provisions. |
| Operating expenses | −4% GAAP operating expenses. | Many peers are seeing mid‑single‑digit opex growth as they invest in tech and marketing. | Visa’s GAAP opex decline reflects a litigation step‑down; on a non‑GAAP basis, expenses are +17% |
How the Market Reacted?
Visa’s Q2 2026 report was received positively by investors, with shares rising about 3.8% in after‑hours trading following the release. The combination of a 17% revenue increase, 20% non‑GAAP EPS growth and clear beats versus consensus on both the top and bottom line supported a constructive, bullish tone.
Investors also appeared to welcome the new $20 billion buyback authorization and continued dividend payments as signs of confidence in sustained cash generation. Overall sentiment around the quarter is favorable, with the company demonstrating strong transaction growth and disciplined capital returns despite ongoing macro and regulatory uncertainties.
