


LendingClub delivered strong Q1 2026 results with diluted EPS of $0.44 and total net revenue of $252.3 million, both rising sharply year over year, while pre‑tax profit reached a record $67.3 million and net income came in at $51.6 million;
About LendingClub Corporation
LendingClub Corporation (NYSE: LC) is the parent of LendingClub Bank, a digital marketplace bank that primarily serves high‑FICO, higher‑income, digitally savvy consumers in the United States. Headquartered in San Francisco, California, the company has evolved from a pioneering online lender into a diversified digital‑first bank that combines deposits, lending, and a capital‑light loan marketplace model. LendingClub is preparing to rebrand its banking business as Happen Bank in summer 2026 to reflect its broader capabilities and focus on “clearing the way” for members’ financial goals.
The company serves more than five million members and uses advanced credit underwriting, proprietary technology, and a marketplace structure to deliver consumer loans and deposit products. It emphasizes credit discipline, efficiency, and scalable technology, including over 60 active AI initiatives deployed across marketing, product, operations, and compliance to support margin expansion over time. Market cap, P/E ratio, dividend yield, and employee count were not disclosed in the Q1 2026 press release and are therefore not included here.
Top Financial Highlights
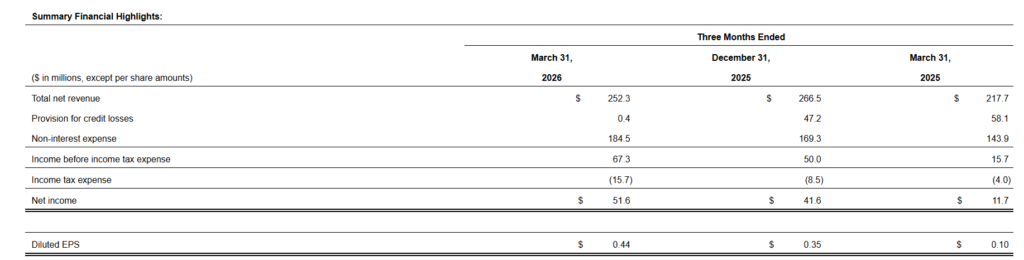
- Total net revenue rose 16% year over year to $252.3 million in Q1 2026, compared with $217.7 million in Q1 2025.
- Net income more than quadrupled to $51.6 million, versus $11.7 million in the prior‑year quarter.
- Diluted EPS reached $0.44, up from $0.10 a year ago, representing approximately 340% growth.
- Income before income tax expense was a record $67.3 million, up from $15.7 million in Q1 2025, driving a pre‑tax profit margin of 26.7%.
- Loan originations increased 31% year over year to $2.7 billion, compared with $2.0 billion in the same quarter last year.
- Net interest income grew to $176.2 million, an 18% year‑over‑year increase from $150.0 million.
- Non‑interest income was $76.0 million, up from $67.8 million in Q1 2025, supported by higher loan sales and improved loan sale pricing.
- Provision for credit losses declined sharply to $0.4 million, compared with $58.1 million in the prior‑year quarter, reflecting strong credit performance and the move to fair value accounting.
- Net charge‑offs on total loans and leases held for investment improved to $42.5 million, down from $76.1 million a year earlier.
- Total assets reached $11.9 billion, up 14% year over year, driven by growth in loans and securities.
- Deposits climbed to $10.2 billion, also up 14% year over year, with approximately 88% of deposits FDIC‑insured.
- Available liquidity stood at $3.7 billion, while the Common Equity Tier 1 capital ratio was 17.0% and the Tier 1 leverage ratio was 11.9%.
- Return on equity (ROE) was 13.7%, and return on tangible common equity (ROTCE) was 14.5% in the quarter.
- Management executed $26 million of the $100 million Stock Repurchase and Acquisition Program during Q1, bringing total utilization to $38 million through March.
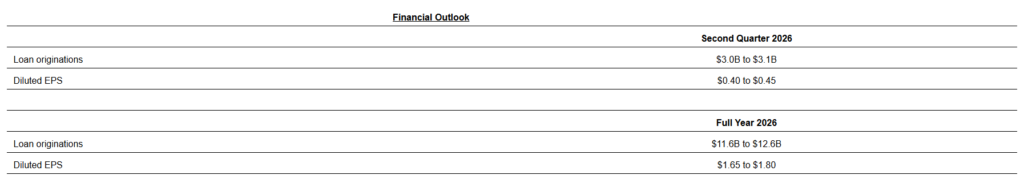
- For Q2 2026, the company guided to loan originations of $3.0 billion to $3.1 billion and diluted EPS of $0.40 to $0.45.
Beat or Miss?
| Metric | Reported Q1 2026 | Difference/Analysis |
| Total net revenue | $252.3 million | Up 16% year over year; strong growth from higher loan sales, better pricing, and higher net interest margin on a larger balance sheet. |
| Net income | $51.6 million | More than quadrupled versus $11.7 million in Q1 2025, reflecting lower credit provisions and improved profitability. |
| Diluted EPS | $0.44 | Increased from $0.10 a year ago; management highlights EPS as more than four times prior‑year level. |
| Pre‑tax income | $67.3 million | Record level, up sharply from $15.7 million in Q1 2025; driven by revenue growth and much lower provision expense. |
| Loan originations | $2.7 billion | Up 31% year over year, supported by product and marketing initiatives and new home improvement loan activity. |
| Provision for credit losses | $0.4 million | Down from $58.1 million in the prior year, primarily due to adoption of fair value option accounting and strong credit performance. |
| Net interest margin | 6.28% | Improved versus 5.97% a year ago, reflecting better deposit funding costs. |
| Q2 2026 EPS guidance | $0.40–$0.45 | Forward‑looking range; specific consensus comparisons not disclosed in the press release. |
| Q2 2026 originations guidance | $3.0–$3.1 billion | Implies continued sequential growth in originations; consensus figures not provided. |
What Leadership Is Saying?
“We’re starting 2026 with exceptional momentum, delivering 31% year‑over‑year growth in originations while achieving record pre‑tax earnings of $67 million and ROTCE of 14.5%. At the same time, we advanced key strategic priorities, including the upcoming rebrand to Happen Bank, expanding into the $500 billion home improvement loan category, and maintaining our credit outperformance. Our focused, proven strategy is successfully attracting and retaining high‑quality members as we continue generating consistent, durable returns.”
– Scott Sanborn, Chief Executive Officer
“First-quarter originations of $2.7 billion came in above the high end of our guidance range, and all consumer businesses grew. Our industry-leading credit performance remains a key differentiator. Net interest income of $176 million was up 18% year-over-year and reached another all-time high. Pre-tax profit margin of 27% represents a new high, with pre-tax net income of $67 million having more than quadrupled compared to a year ago.”
– Andrew LaBenne, CFO, LendingClub
Historical Performance
These figures show that revenue growth, much lower credit provisions, and operating leverage combined to drive a sharp increase in profitability despite higher non‑interest expenses.
LendingClub Q1 2026 vs Q1 2025
| Category | Q1 2026 | Q1 2025 | Change (%) |
| Revenue (Total net revenue) | $252.3 million | $217.7 million | +16% year over year. |
| Net income | $51.6 million | $11.7 million | +342% year over year. |
| Operating expenses (Non‑interest expense) | $184.5 million | $143.9 million | +28% year over year, reflecting higher marketing and growth investments. |
Historical Performance of Competitors
The provided press release focuses exclusively on LendingClub’s results and does not present directly comparable quarterly figures for specific competitors such as other digital lenders or marketplace banks. Because competitor revenue, net income, and operating expense data for the same periods are not included, a precise year‑over‑year comparison table cannot be constructed from this document alone.
| Company | Q1 2025 Revenue | Latest Reported Revenue | Change (YoY) | Q1 2025 Net Income | Latest Net Income | Notes |
| LendingClub (LC) | $217.7M | $252.3M (Q1 2026) | +16% | $11.7M | $51.6M (Q1 2026) | +342% net income |
| SoFi Technologies (SOFI) | $770.7M | ~$1.01B (Q4 2025) | +31% (Q4 YoY) | N/A | $174M (Q4 2025, full year basis) | Q1 2026 est: ~$1.04B revenue |
| Upstart Holdings (UPST) | $213M | $296M (Q4 2025) | +39% (Q4 YoY) | ($2.4M) loss | $18.6M (Q4 2025) | FY2026 guidance: ~$1.4B revenue |
LendingClub’s 342% net income growth sharply outpaces its peers on a profitability trajectory basis, even as SoFi operates at a much larger revenue scale. SoFi reported over 37% stock growth over the past year but trades at nearly 34x earnings, while LendingClub’s P/E of ~15x represents a more conservative valuation. Upstart, having only recently returned to profitability with Q4 2025 net income of $18.6 million, is targeting $1.4 billion in full-year 2026 revenue representing approximately 40% growth.
How the Market Reacted
The Q1 2026 earnings press release itself does not state how LendingClub’s stock traded immediately after the announcement, so specific percentage or price moves are not available here. Based on the financials, the tone of the release is clearly positive, highlighting record pre‑tax income, strong ROE and ROTCE, and robust originations growth.
Management also emphasizes strategic progress on the Happen Bank rebrand, home improvement lending, and AI‑driven efficiency, which collectively signal a constructive, growth‑oriented outlook. In the absence of explicit stock‑price commentary, the overall sentiment of the report can be characterized as bullish, underpinned by strong profitability and capital ratios.