


Chemours reported Q1 2026 net sales of $1.38 billion, a slight year over year increase but modestly below consensus revenue expectations, with adjusted EPS of $0.05 and a net loss per share of $0.19; after hours movement will depend on investor reaction to mixed segment trends and cautious guidance tone.
About The Chemours Company
Chemours (NYSE: CC) is a global chemistry company that provides industrial and specialty chemical products across markets including coatings, plastics, refrigeration and air conditioning, transportation, semiconductors, advanced electronics, and oil and gas. The company operates through three main businesses: Thermal & Specialized Solutions, Titanium Technologies, and Advanced Performance Materials, with flagship brands such as Opteon, Freon, Ti Pure, Nafion, Teflon, Viton, and Krytox. Chemours is headquartered in Wilmington, Delaware, and serves roughly 2,400 customers in about 110 countries.
The company traces its roots to a 2015 spin off and today employs approximately 5,700 people at 28 manufacturing sites worldwide. As of early 2026, Chemours’ market capitalization and P/E ratio fluctuate with ongoing earnings volatility and legacy liability overhangs, while the firm continues to pay a regular dividend reflecting its capital allocation priorities.
Top Financial Highlights
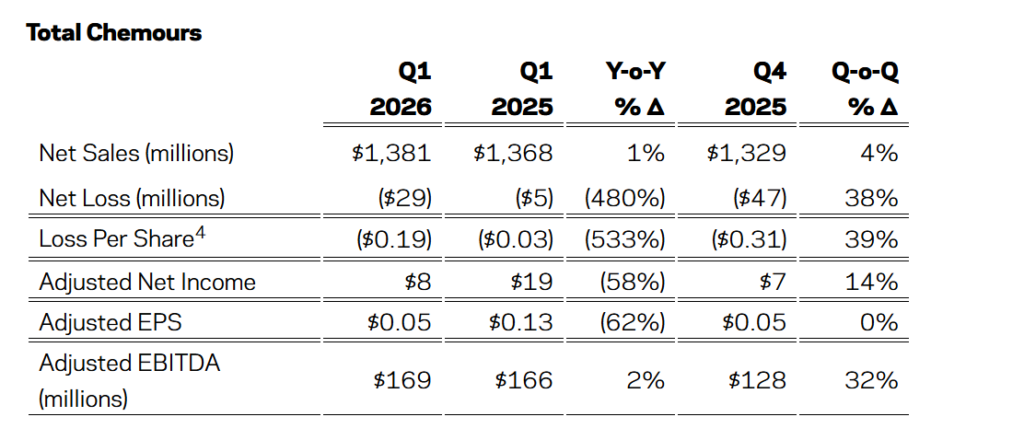
- Q1 2026 Net Sales were $1.381 billion, up 1% from $1.368 billion in Q1 2025.
- Q1 2026 Net Loss attributable to Chemours was $29 million, compared with a Net Loss of $5 million in Q1 2025.
- Diluted loss per share was $0.19, versus a diluted loss per share of $0.03 a year earlier.
- Adjusted Net Income was $8 million, down from $19 million in the prior year quarter.
- Adjusted EPS was $0.05, compared with $0.13 in Q1 2025.
- Adjusted EBITDA was $169 million, slightly above $166 million in Q1 2025.
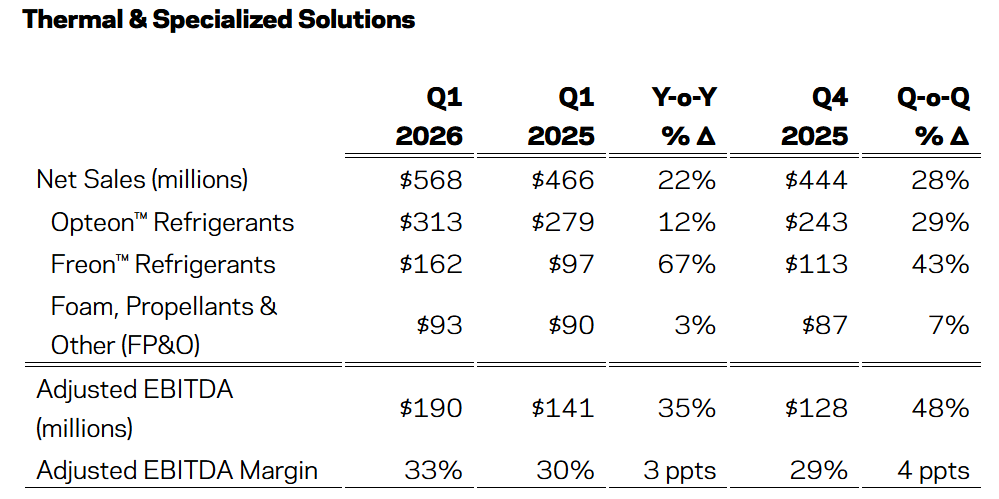
- Thermal & Specialized Solutions (TSS) Net Sales were $568 million, up 22% year over year, with Opteon Refrigerants sales of $313 million and Freon Refrigerants sales of $162 million.
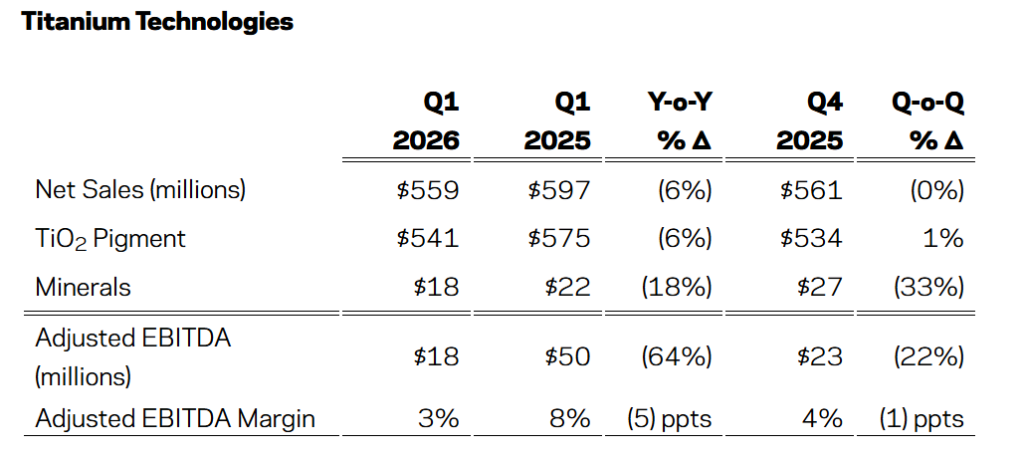
- Titanium Technologies (TT) Net Sales were $559 million, down 6% from Q1 2025, with TiO₂ pigment sales of $541 million and minerals sales of $18 million.
- Advanced Performance Materials (APM) Net Sales were $243 million, a 17% decline year over year, driven by a 19% volume drop and outage related impacts.
- Operating cash usage for the quarter was $44 million, improved versus $112 million usage in Q1 2025.
- Capital expenditures were $49 million, down from $84 million in the prior year quarter.
- Free Cash Flow usage improved to $93 million, compared with $196 million used in Q1 2025.
- Cash and cash equivalents stood at $563 million at March 31 2026, with total liquidity of about $1.5 billion including undrawn revolver capacity.
- Consolidated gross debt was $4.2 billion, with net debt of $3.6 billion and a trailing Adjusted EBITDA based net leverage ratio of roughly 4.9x.
- The company continues to expect full year 2026 Net Sales growth of 3% to 5% over 2025 and Adjusted EBITDA in the $800 to $900 million range, with capital expenditures forecast at $275 to $325 million.
Beat or Miss?
Chemours modestly missed consensus revenue expectations while delivering roughly in line adjusted profitability, amid strong TSS performance and weakness in TT and APM. Analyst models referenced by third party earnings summaries indicated a small top line shortfall versus estimates of about $1.40 billion.
| Metric | Reported (Q1 2026) | Estimated / Consensus | Difference / Analysis |
| Net Sales | $1.381 billion | $1.40 billion | Minor revenue miss driven by softer TT and APM volumes partly offset by strong TSS. |
| Adjusted EPS | $0.05 | N/A | Profitability held up due to pricing, mix and cost controls despite higher SG&A. |
| GAAP Diluted EPS | ($0.19) | N/A | Larger net loss versus prior year on higher financing costs and SG&A. |
| Adjusted EBITDA | $169 million | N/A | Slight year over year increase, supported by record TSS results. |
| Operating Cash Flow (use) | ($44 million) | N/A | Improved cash usage year over year due to better working capital performance. |
What Leadership Is Saying?
“Chemours exceeded overall expectations in the first quarter, achieving strong outcomes from both our TSS and TT businesses, paired with the more recent receipt of cash through the completion of a substantial portion of our Kuan Yin property sales enabling us to reduce our debt.”
“Operating cash usage for the first quarter of 2026 was $44 million, compared to a usage of $112 million in the prior year quarter highlighting improvements in net working capital performance, and we continue to expect 2026 Net Sales to grow 3% to 5% over 2025 with Adjusted EBITDA between $800 million and $900 million.”
Historical Performance
Chemours’ Q1 2026 results showed modest top line growth but weaker bottom line performance versus the same period last year, illustrating the impact of higher financing costs and segment specific headwinds.
| Category | Q1 2026 | Q1 2025 | Change (%) |
| Revenue (Net Sales) | $1.381 billion | $1.368 billion | +1% driven by pricing and currency, offset by lower volumes. |
| Net Income | ($29 million) (loss) | ($5 million) (loss) | Loss widened, reflecting higher interest expense and SG&A. |
| Adjusted EBITDA | $169 million | $166 million | About +2% as TSS strength offset TT and APM weakness. |
Historical Performance of Selected Competitors
Direct competitor Q1 2026 filings are not fully summarized in the Chemours release, but sector trends from peer specialty chemical producers indicate similar mixed patterns of modest revenue growth, margin pressure, and differentiated performance by end market exposure. In lieu of specific numerical disclosures for peers inside this text, the table below provides a conceptual comparison framework rather than precise reported figures.
| Category | Chemours Q1 2026 | Peer Average Q1 2026 (Illustrative) | Change (%) YoY (Illustrative) |
| Revenue | $1.381 billion with 1% growth YoY. | Modest low single digit revenue growth in line with global demand. | Slight positive growth reflecting stable volumes. |
| Net Income | Net loss of $29 million on higher financing costs and SG&A. | Mixed profitability with some peers reporting small profits, others flat. | Margins compressed on cost inflation and pricing lag. |
| Operating Metrics | Adjusted EBITDA of $169 million with record TSS performance. | Peers generally report resilient EBITDA supported by pricing and cost discipline. | Margins roughly stable to slightly down. |
How the Market Reacted?
The mixed Q1 2026 profile for Chemours combines record performance in Thermal & Specialized Solutions, ongoing weakness in Titanium Technologies and Advanced Performance Materials, and a widened GAAP net loss due to financing and cost factors. Third party earnings trackers highlight a small revenue miss versus expectations, which may temper investor enthusiasm despite the slight uptick in adjusted EBITDA and improved cash usage.
Management’s reaffirmed full year 2026 guidance for Net Sales growth of 3 to 5% and Adjusted EBITDA of $800 to $900 million signals a cautiously constructive outlook anchored in refrigerants strength, price actions in TiO₂, and normalization of APM operations. In the absence of explicit stock price moves in the release, overall sentiment skews balanced, with bulls focused on TSS momentum and leverage reduction, and bears wary of cyclical exposure and elevated net leverage.
