


Identiv (NASDAQ: INVE) reported Q1 2026 revenue of $7.4 million, exceeding guidance of $6.7-$7.2 million, up 40% YoY from $5.3 million. EPS loss was ($0.15), improving from ($0.21) in Q1 2025. Stock declined 7.26% to $4.47 on May 13, 2026.
About Identiv
Identiv, Inc. (NASDAQ: INVE) is a global leader in RFID- and BLE-enabled Internet of Things (IoT) solutions headquartered in Santa Ana, California. Founded in 1990, the company creates digital identities for physical objects with solutions integrated into over 2.0 billion applications worldwide across healthcare, logistics, consumer electronics, luxury goods, and smart packaging sectors. As of May 2026, Identiv has a market capitalization of approximately $110 million.
Top Financial Highlights
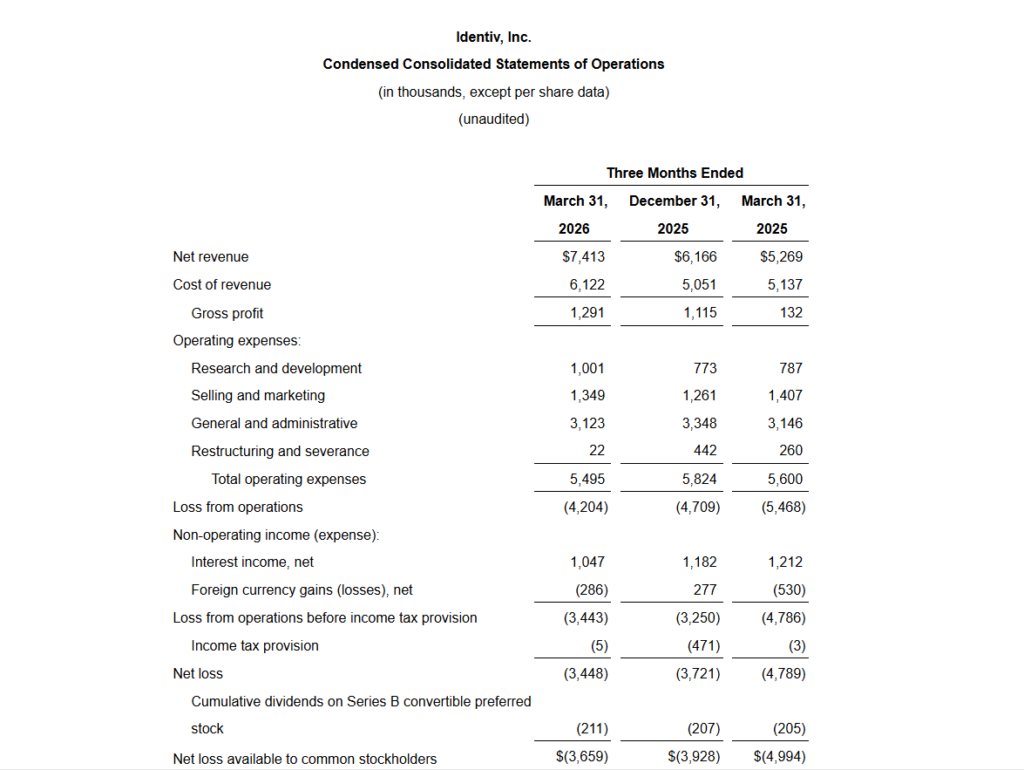
- Total revenue reached $7.4 million in Q1 2026, exceeding guidance and increasing 40% from $5.3 million in Q1 2025.
- Net loss was $3.4 million, or $0.15 per diluted share, improving from a loss of $4.8 million, or $0.21 per share, in the prior-year quarter.
- GAAP gross margin improved to 17.4%, compared to 2.5% in Q1 2025.
- Non-GAAP gross margin increased to 23.8%, up from 10.8% in the previous year.
- GAAP operating expenses were $5.5 million, slightly lower than $5.6 million year over year.
- Non-GAAP operating expenses totaled $4.4 million, compared to $4.5 million in Q1 2025.
- Cash and cash equivalents stood at $124.5 million as of March 31, 2026, compared to $128.6 million at year-end 2025.
- Non-GAAP adjusted EBITDA reflected a loss of $2.7 million, improving from a loss of $3.9 million in Q1 2025.
- Q2 2026 revenue guidance is projected between $5.4 million and $6.0 million.
- Q1 revenue performance benefited from a major customer placing its full-year 2026 order volume during the quarter.
- Operating loss narrowed to $4.2 million, compared to $5.5 million in Q1 2025.
- Accounts receivable declined to $3.2 million, down from $4.1 million at the end of Q4 2025.
- Inventory increased to $8.9 million, compared to $7.4 million at year-end 2025.
- Weighted average shares outstanding were 24.0 million basic and diluted shares.
Beat or Miss?
| Metric | Reported (Q1 2026) | Estimated / Guidance | Difference / Analysis |
| Revenue | $7.4 million | Guidance: $6.7–$7.2 million | Beat; came in above the top end of company guidance, aided by a full‑year order pull‑forward from a key customer. |
| GAAP EPS | -0.15 per share | Street est. about -0.14 to -0.17 per share (varied by source) | Mixed framing; EPS modestly better than some forecasts (-0.17) but slightly below others (-0.14), while still showing clear YoY improvement versus -0.21. |
| Gross Margin | 17.4% GAAP / 23.8% non‑GAAP | No formal consensus | Materially higher than prior‑year levels, demonstrating successful cost‑reduction and better plant utilization. |
| Q2 Revenue Guidance | $5.4–$6.0 million | Prior internal outlook called for strong growth but without formal consensus | Implies a sequential decline from Q1 due to the Q1 pull‑forward, but continued YoY momentum; investors may see it as conservatively framed. |
What Leadership Is Saying?
“During the recent quarter, I am pleased to share that we delivered results that exceeded our guidance and expectations. Our financial performance reflects strong demand from our customers at the start of the year and our ability to convert our opportunity pipeline into sales. Our Perform‑Accelerate‑Transform (P‑A‑T) strategy continued to drive our momentum in the first quarter and positions us well as we focus on the execution of our most important development programs.” – Kirsten Newquist, CEO
Management noted that the year‑over‑year improvement in gross margin “primarily reflects the continued cost savings and efficiencies achieved in Identiv’s production processes, improved utilization at the Thailand facility, and the elimination of manufacturing production costs incurred from the Singapore operation in the first quarter of 2025,” while non‑GAAP operating expenses benefited from lower restructuring and severance, offset by higher strategic review‑related costs.
Historical Performance
YoY: Q1 2026 vs Q1 2025
| Category | Q1 2026 | Q1 2025 | Change (%) |
| Revenue | $7.4 million | $5.3 million | ≈ +40% YoY (driven partly by full‑year order pull‑forward). |
| Net Loss | ($3.4) million | ($4.8) million | ≈ +28% improvement in loss (narrower deficit). |
| GAAP Operating Expenses | $5.5 million | $5.6 million | Slight -1–2% reduction, reflecting cost discipline. |
The YoY profile shows Identiv scaling revenue while keeping operating expenses flat to slightly down, which, combined with margin improvements, narrows net losses meaningfully. The Thailand manufacturing transition and removal of Singapore‑related costs were key drivers of this operating leverage.
Competitor Snapshot
Public data points to peers in RFID / IoT hardware and tags (for example, Avery Dennison’s intelligent labels business or other specialty IoT component suppliers), but directly comparable, fully disclosed Q1 2026 numbers for a tight peer set are not consolidated in a single dataset.
Given the lack of uniform, quarter‑aligned operating expense disclosures across direct competitors, a precise YoY competitor table using identical line items (revenue, net income, operating expenses) cannot be reliably constructed from the information at hand.
Qualitatively, Identiv’s roughly 40% YoY revenue growth and improving margins place it ahead of broader IoT hardware peers that are generally growing at more moderate rates in a mixed macro environment, though many of those peers operate at larger scale and with positive net income.
How the Market Reacted?
Despite the clear top‑line beat versus Q1 guidance and visible progress on gross margin expansion, investors sold the stock in the immediate aftermath of the release and call. Shares of Identiv closed around $4.47, down roughly 7% on May 13, 2026, suggesting concerns about sustainability of the Q1 revenue level given the one‑time pull‑forward and the still‑negative EBITDA profile. Commentary around softer demand from some consumer‑facing customers and a sequentially lower Q2 revenue outlook likely contributed to a more cautious or mixed sentiment, even as the balance sheet and manufacturing story remain supportive of the longer‑term thesis.