


Costco delivered a strong Q2 FY2026, posting EPS of $4.58 (beating the $4.55 consensus by 0.66%) on total revenue of $69.6 billion (+9.2% YoY). Net income surged nearly 14% to $2.035 billion, fueled by robust comparable sales growth of 7.4% and explosive 22.6% digital sales growth. Shares fell approximately 2.4% in after-hours trading to $995.53, as investors appeared to have already priced in the strong results.
About Costco Wholesale Corporation
Costco Wholesale Corporation (NASDAQ: COST) is the world’s third-largest retailer and the leading membership-only warehouse club, operating 924 warehouses across the globe as of Q2 FY2026. Headquartered in Issaquah, Washington, the company was founded in 1983 by Jim Sinegal and Jeffrey Brotman, who opened the first Costco warehouse in Seattle. The company’s business model revolves around selling a curated selection of merchandise at razor-thin margins to fee-paying members, generating the majority of its operating profit from membership fees rather than product markup.
As of early March 2026, Costco commands a market capitalization of approximately $437 billion and employs roughly 341,000 people worldwide. The company trades at a trailing P/E ratio of approximately 53.8, reflecting its premium valuation driven by consistent growth and investor confidence in its durable competitive advantages. Costco pays a quarterly dividend of $1.30 per share ($5.20 annualized), yielding approximately 0.52%. Under CEO Ron Vachris and CFO Gary Millerchip, Costco continues to expand its global footprint, with plans for 28 net new warehouse openings in fiscal 2026 and a longer-term target of 30+ annually.
Top Financial Highlights
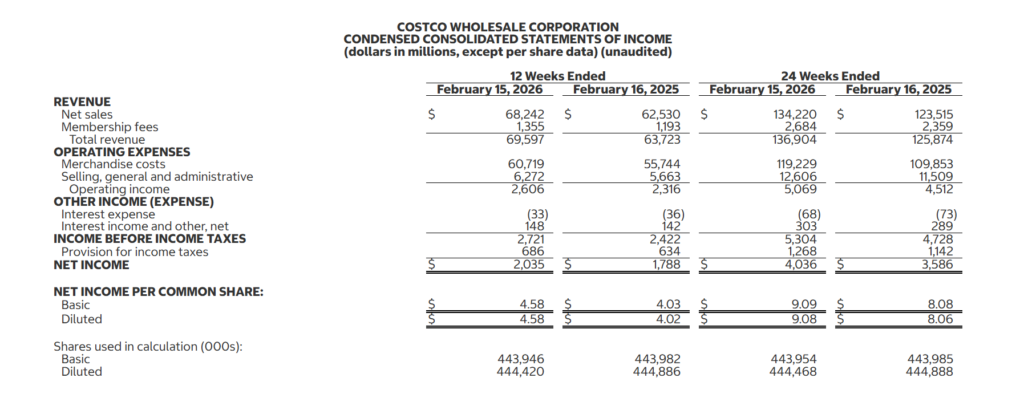
- Total revenue for the quarter was $69.60 billion, marking a 9.2% increase from $63.72 billion in Q2 FY2025, reflecting strong business growth.
- Net sales amounted to $68.24 billion, up 9.1% year-over-year from $62.53 billion, driven by solid sales performance across key segments.
- Net income reached $2.035 billion, a 13.8% increase from $1.788 billion in the prior year quarter, reflecting improved profitability.
- Diluted EPS was $4.58, up 13.9% from $4.02 in Q2 FY2025, demonstrating strong earnings growth.
- Membership fee income totaled $1.355 billion, up 13.6% year-over-year. Excluding the September 2024 fee hike and foreign exchange effects, underlying growth was 7.5%.
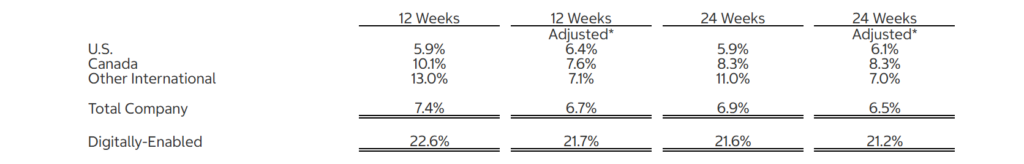
- Comparable sales grew by 7.4% company-wide, with a 6.7% increase after adjusting for gas deflation and FX, showing strong performance across markets.
- Digitally-enabled comparable sales increased by 22.6%, or 21.7% after adjusting for FX, reflecting strong demand for digital services.
- Gross margin stood at 11.02%, an improvement of 17 basis points year-over-year, with core-on-core margins expanding by 22 basis points.
- Operating income was $2.606 billion, up 12.5% from $2.316 billion, demonstrating operational leverage and efficiency.
- Operating cash flow for the 24-week period was $7.684 billion, up from $6.008 billion a year ago, reflecting strong cash generation.
- Cash and cash equivalents totaled $17.383 billion, a substantial 40.7% increase from $12.356 billion, providing strong liquidity.
- Capital expenditures for Q2 were $1.29 billion, with full-year projections at approximately $6.5 billion, highlighting continued investment in infrastructure and expansion.
- The company now has a total of 924 warehouses globally, following the opening of 4 new locations in Q2.
- Paid memberships reached 40.4 million, reflecting a 9.5% year-over-year increase, while total paid members grew by 4.8% to 82.1 million. The company also recorded 147.2 million cardholders, up 4.7%.
- February net sales were $21.69 billion, up 9.5% from $19.81 billion in the same month last year, continuing strong momentum.
Comparable sales for the second quarter and first 24 weeks of fiscal 2026 were as follows:
Beat or Miss?
| Metric | Reported | Consensus Estimate | Difference |
| Diluted EPS | $4.58 | $4.55 | +$0.03 / +0.66% Beat |
| Total Revenue | $69.60B | ~$69.32B | +$0.28B / +0.4% Beat |
| Net Sales | $68.24B | ~$68.2B (est.) | In line / slight beat |
| Comparable Sales (Adj.) | 6.70% | ~+6.5% (est.) | Slight beat |
Revenue surpassed expectations by approximately $310 million, representing a 0.51% positive surprise. While the beat was moderate relative to prior quarters, the consistent trend of outperformance underscores the strength and predictability of Costco’s membership-driven model. Analysts had been revising EPS estimates upward heading into the quarter, which made the beat narrower than usual.
What Leadership Is Saying?
CEO Ron Vachris – Strategy & Pricing Vision
“At Costco, we always want to be the first to lower prices and the last to raise them. During the second quarter, we lowered prices on key items such as eggs, cheese, coffee, and some paper products as we saw lower inflation in these commodities. We will continue to be a pricing authority, and as some tariffs have been reduced, we are lowering prices on affected items such as certain textiles, bedding, and cookware SKUs.”
CFO Gary Millerchip – Financials & Margins
“Net income for the second quarter came in at $2,035,000,000, or $4.58 per diluted share, up nearly 14% from $1,788,000,000, or $4.02 per diluted share, in the second quarter last year… Our core-on-core margins were higher by 22 basis points. The increase in core-on-core margins was broad-based, with nonfoods, food and sundries, and fresh all higher year over year.”
Historical Performance
Costco Q2 FY2026 vs. Q2 FY2025
The year-over-year comparison demonstrates accelerating growth across all major financial metrics, with net income growth outpacing revenue growth and reflecting improved operational leverage.
| Category | Q2 FY2026 (12 Weeks Ended Feb 15, 2026) | Q2 FY2025 (12 Weeks Ended Feb 16, 2025) | Change (%) |
| Net Sales | $68.24B | $62.53B | +9.1% |
| Total Revenue | $69.60B | $63.72B | +9.2% |
| Membership Fee Income | $1.355B | $1.193B | +13.6% |
| Net Income | $2.035B | $1.788B | +13.8% |
| Diluted EPS | $4.58 | $4.02 | +13.9% |
| Operating Income | $2.606B | $2.316B | +12.5% |
| Merchandise Costs (COGS) | $60.72B | $55.74B | +8.9% |
| SG&A Expenses | $6.272B | $5.663B | +10.8% |
| Gross Margin | 11.02% | 10.85% | +17 bps |
Year-to-Date Performance (24 Weeks)
| Category | 24 Weeks FY2026 | 24 Weeks FY2025 | Change (%) |
| Net Sales | $134.22B | $123.52B | +8.7% |
| Net Income | $4.036B | $3.586B | +12.6% |
| Diluted EPS | $9.08 | $8.06 | +12.7% |
| Membership Fee Income | $2.684B | $2.359B | +13.8% |
| Operating Cash Flow | $7.684B | $6.008B | 27.90% |
Competitor Comparison
Warehouse Club & Retail Peers
The wholesale/warehouse club industry continues to outperform traditional retail. Below is a comparison of the most recently reported quarterly results for Costco’s primary peers.
| Category | Costco Q2 FY2026 (12 Wks Ended Feb 15, 2026) | Walmart Q4 FY2026 (Qtr Ended Jan 31, 2026) | BJ’s Wholesale Q4 FY2025 (13 Wks Ended Jan 31, 2026) |
| Net Sales / Revenue | $69.60B (total revenue) | $190.7B (total revenue) | $5.58B (total revenue) |
| Net Sales Growth (YoY) | +9.1% | +5.6% | +5.5% |
| Net Income | $2.035B | ~$5.6B (adj. operating income $8.7B) | $125.9M |
| Diluted EPS | $4.58 | $0.74 (adj.) | $0.96 |
| Comparable Sales Growth | +7.4% (+6.7% adj.) | +4.6% (U.S., ex-fuel) | +2.6% (ex-fuel) |
| Digital Sales Growth | +22.6% | +24% (global eCommerce) | +26% (digitally enabled) |
| Membership Fee Income | $1.355B (+13.6%) | $4.3B+ (full year, incl. Walmart+) | $129.8M (+10.9%) |
Key Observations
- Costco leads in comp sales growth at 7.4% (6.7% adjusted), significantly outpacing both Walmart U.S. at 4.6% and BJ’s at 2.6%.
- Digital sales acceleration is a shared theme across all three retailers, with BJ’s posting 26% digital comp growth, Walmart at 24%, and Costco at 22.6%.
- Membership fee income growth is strongest at Costco (+13.6%), partly boosted by the September 2024 fee increase, but underlying growth of 7.5% (ex-fee hike and FX) still outpaces BJ’s 10.9%.
- BJ’s issued weaker-than-expected FY2026 guidance of adjusted EPS $4.40-$4.60, with the midpoint below the $4.66 analyst consensus, sending its stock lower.
- Walmart reported strong full-year revenue of $713.2 billion with operating income growing faster than sales, and projected FY2027 adjusted EPS of $2.75-$2.85.
How the Market Reacted?
Despite beating consensus estimates on both EPS and revenue, Costco shares declined approximately 2.4% in after-hours trading to $995.53 following the March 5, 2026 earnings release. The stock had closed the regular session at $982.57, with an intraday range of $978.81–$999.25. The muted reaction likely reflects Costco’s premium valuation (P/E of ~53.8) and the fact that the earnings beat, while positive, was relatively narrow at just 0.66% above consensus.
Investor sentiment appears mixed – the strong operational results are offset by concerns about evolving tariff impacts, geopolitical risks in the Middle East, and a slight 10-basis-point decline in U.S./Canada membership renewal rates driven by lower-renewing online sign-ups. Analyst price targets following the report ranged from $950 (Wells Fargo) to $1,115 (BTIG), with the consensus at approximately $1,016, implying roughly 3% upside from current levels.
