


Gates Industrial (NYSE: GTES) reported Q1 2026 adjusted EPS of $0.35, beating the $0.33 consensus estimate by 6.5%, while net sales of $851.1M missed analyst expectations of $862.7M by 1.3%. Free cash flow improved sharply to $13.5M versus negative $18.9M a year ago. Shares fell roughly 6% on earnings day before stabilizing around $24.06.
About Gates Industrial Corporation
Gates Industrial Corporation plc (NYSE: GTES) is a leading global provider of application-specific fluid power and power transmission solutions. The company designs, manufactures, and markets engineered products including elastomer drive belts, hydraulic hoses, tubing, and fittings used across a broad range of industrial and consumer applications. Headquartered at 1144 Fifteenth Street, Denver, CO 80202, Gates was incorporated in 2017 and completed its NYSE IPO on January 25, 2018.
As of May 2026, the company carries a market capitalization of approximately $6.13 billion and employs approximately 13,000 people globally. The company reported full-year 2025 revenue of $3.44 billion, with a trailing twelve-month P/E ratio of approximately 26.62. Gates commands an estimated 17.8% share of U.S. Hose and Belt Manufacturing industry revenue.
Top Financial Highlights
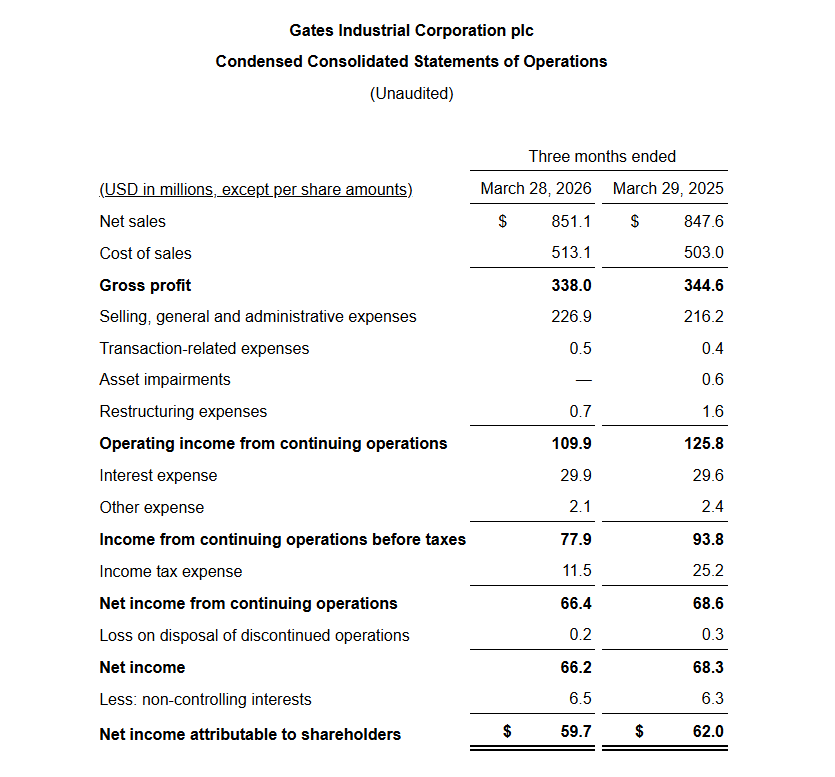
- Net sales reached $851.1 million, increasing 0.4% year over year.
- Core revenue declined 2.9%, impacted by approximately 600 basis points headwind from ERP transition and fewer working days.
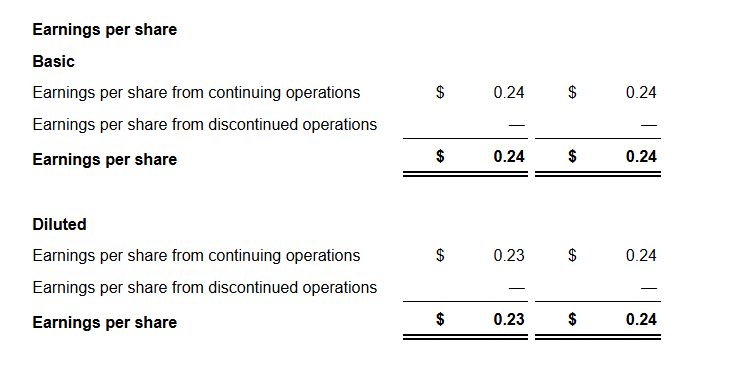
- Net income attributable to shareholders was $59.7 million, or $0.23 per diluted share.
- Adjusted EPS stood at $0.35, exceeding consensus estimates by 6.5%.
- Adjusted EBITDA totaled $177.4 million, with a margin of 20.8%, declining by 130 basis points year over year.
- Gross profit was $338.0 million, with a gross margin of 39.7% and an adjusted gross margin of 40.5%.
- Power transmission revenue reached $533.2 million, growing 1.1%, with adjusted EBITDA of $112.0 million and a 21.0% margin.
- Fluid power revenue totaled $317.9 million, declining 0.8%, with adjusted EBITDA of $65.4 million and a 20.6% margin.
- Free cash flow was $13.5 million, improving from negative $18.9 million in Q1 2025.
- Cash and cash equivalents stood at $785.3 million, with net leverage at 1.9x.
- Q2 2026 revenue guidance is set between $905 million and $945 million, implying core growth of approximately 3.5% at the midpoint.
- Full-year 2026 guidance has been reiterated, with expected core sales growth of 1% to 4%, adjusted EBITDA in the range of $775 million to $835 million, adjusted EPS between $1.52 and $1.68, and capital expenditure of around $120 million.
Beat or Miss?
| Metric | Reported | Estimated | Difference/Analysis |
| Net Revenue | $851.1M | $862.7M | -1.3% miss |
| Adjusted EPS | $0.35 | $0.33 | +6.5% beat |
| Adjusted EBITDA | $177.4M | $177.9M | In line |
| GAAP Diluted EPS | $0.23 | N/A | Reported only |
| Net Income | $59.7M | N/A | vs. $62.0M prior year |
| Free Cash Flow | $13.5M | N/A | vs. -$18.9M prior year |
The revenue miss was directly attributed to the European ERP system rollout and two fewer working days in the quarter. Excluding these transitory factors, core sales growth would have been approximately 300 basis points higher, broadly in line with full-year guidance expectations.
What Leadership Is Saying?
CEO Ivo Jurek on strategy and the ERP transition:
“Our team executed well on our business priorities during the first quarter, navigating successfully through a fair level of business transition. In particular, our Europe team successfully implemented a new ERP system and achieved higher efficiency rates as the quarter progressed. Exiting the quarter, our Europe business has stabilized, was delivering revenues on par with prior pre-ERP implementation periods.”
CFO L. Brooks Mallard on free cash flow and the balance sheet:
“Over the last 12 months, we delivered free cash flow conversion of approximately 101%. Stronger operating cash flow drove positive free cash flow for the quarter. We continue to strengthen the balance sheet, exiting the quarter with net leverage at 1.9x, representing an improvement of approximately 0.4 turns compared to the first quarter of 2025. In late February, we received a credit rating upgrade from Moody’s to Ba2 from Ba3.”
Historical Performance
| Category | Q1 2026 | Q1 2025 | Change (%) |
| Net Revenue | $851.1M | $847.6M | 0.40% |
| Net Income (Shareholders) | $59.7M | $62.0M | -3.70% |
| Adjusted EBITDA | $177.4M | $187.3M | -5.30% |
| Adjusted EBITDA Margin | 20.8% | 22.0% | -130 bps |
| Adjusted EPS | $0.35 | $0.36 | -2.80% |
| Power Transmission Revenue | $533.2M | $527.2M | 1.10% |
| Fluid Power Revenue | $317.9M | $320.4M | -0.80% |
| Free Cash Flow | $13.5M | -$18.9M | Significant improvement |
| Net Leverage | 1.9x | ~2.3x | ~-0.4 turns |
Competitor Historical Performance
Eaton Corporation (NYSE: ETN) results for Q1 2026 are due May 5, 2026 and were not yet available at press time. Parker Hannifin’s fiscal Q3 2026 ended March 31, 2026, making it the closest calendar period comparable
| Category | Gates Industrial Q1 2026 | Parker Hannifin Q3 FY2026 | Parker Hannifin Q3 FY2025 | PH Change YoY |
| Revenue | $851.1M | $5.5B (record) | ~$4.96B | 11% |
| Net Income | $59.7M | ~$0.9B | ~$0.96B | -6% |
| Adjusted EPS | $0.35 | $8.17 (record) | ~$6.93 | 18% |
| Core/Organic Revenue Growth | -2.90% | 6.50% | N/A | Divergence |
| Adj. Operating Margin | 20.80% | ~26.7% | ~26.3% | +40 bps |
How the Market Reacted?
Gates Industrial shares fell approximately 6.05% on May 1, 2026, closing at $24.06, with an intraday range of $23.87 to $26.11. The selling pressure reflected the revenue miss versus analyst expectations, even though the company beat EPS estimates and reiterated full-year guidance. Despite the single-session decline, Gates shares had still gained approximately 19.3% year-to-date through earnings day, far outpacing the S&P 500’s roughly 5.3% gain over the same period.
The broader tone around the report leaned cautiously constructive given the strong April order momentum, a book-to-bill solidly above 1, the announced Timken industrial belt acquisition expected to close in Q3 2026, and management confidence in achieving an adjusted EBITDA margin approaching 23.5% in H2 2026.