


Health In Tech (NASDAQ: HIT) delivered full-year 2025 revenue of $33.3 million, up 71% year-over-year, and net income of $1.3 million, up 91% YoY. Full-year EPS came in at $0.02, while Q4 EPS was a loss of -$0.01, missing the $0.01 forecast. The stock closed at $1.81 on March 25, 2026, and slipped roughly 16% in after-hours trading to $1.52.
About Health In Tech
Health In Tech, Inc. (NASDAQ: HIT) is an AI-enabled InsurTech platform company headquartered in Stuart, Florida. Founded in 2014 by CEO Tim Johnson, the company operates a marketplace that streamlines underwriting, sales, and service processes for insurance companies, licensed brokers, Managing General Underwriters (MGUs), and third-party administrators (TPAs).
The platform connects brokers, TPAs, MGUs, and carriers to access self-funded health insurance for small and medium-sized employers, offering functions including customized self-funded health plans, bindable stop-loss quotes, AI-enabled underwriting, and claims administration. As of March 2026, Health In Tech carries a market capitalization of approximately $108.5 million and employs around 80 people, generating revenue per employee of roughly $416,594.
The stock trades with a P/E ratio of 90.50x on full-year 2025 earnings, reflecting the company’s high-growth profile. Health In Tech targets the approximately $300 billion U.S. claims administration market, with the broader U.S. health insurance market estimated at $1.7 trillion.
Top Financial Highlights
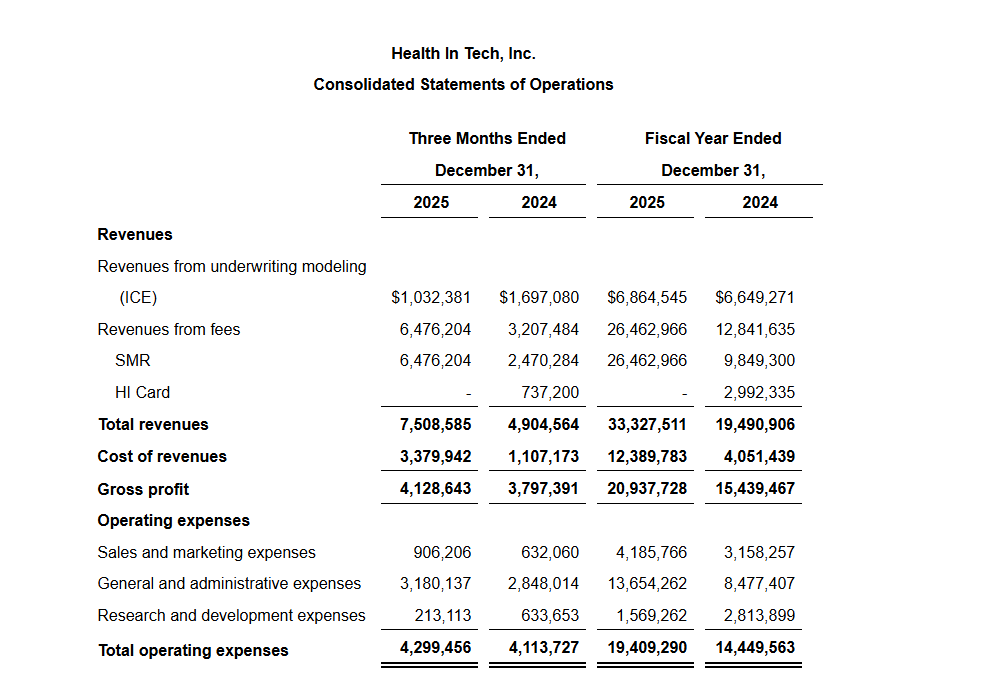
- Total Full Year Revenue was $33.3 million, up 71% year-over-year
- Q4 2025 Revenue was $7.5 million, up 53% year-over-year
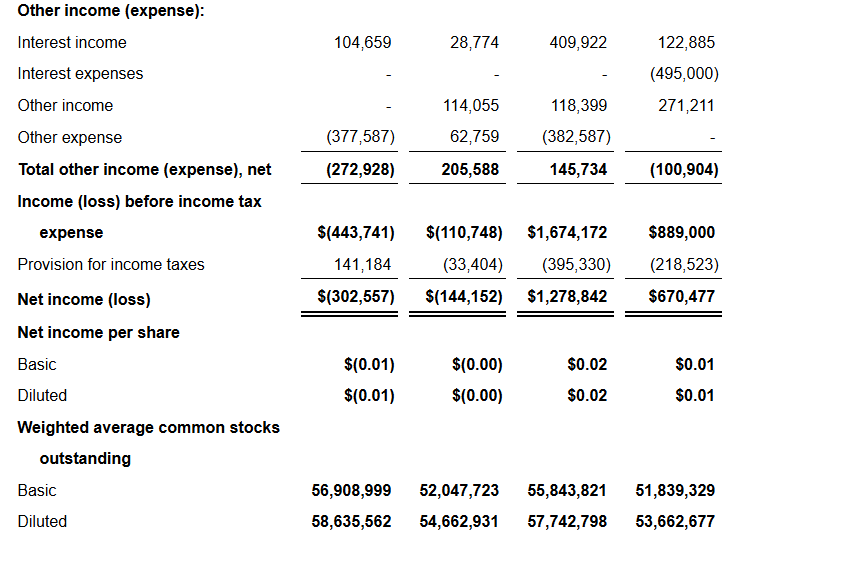
- Full Year Net Income was $1.3 million (approximately $1,278,842), up 91% YoY
- Q4 2025 Net Loss was -$0.3 million, compared to a net loss of -$0.1 million in Q4 2024
- Full Year Adjusted EBITDA was $4.1 million, up 81% year-over-year
- Q4 Adjusted EBITDA was $0.3 million, down from $0.5 million in Q4 2024
- Full Year Gross Profit was $20.9 million (gross margin of approximately 62.8%, down from 79.2% in 2024)
- Q4 Gross Profit was $4.1 million vs. $3.8 million in Q4 2024
- Full Year EPS (Basic/Diluted) was $0.02 vs. $0.01 in 2024
- Q4 EPS was -$0.01, missing the analyst consensus forecast of $0.01
- Operating Cash Flow for full year 2025 was $3.1 million, up from $2.2 million in 2024
- Cash on Hand was $7.7 million as of December 31, 2025
- Billed Enrolled Employees (EEs) reached 22,515, up 23% year-over-year
- Distribution Partners (Brokers, TPAs, Agencies) expanded to 858, up 34% year-over-year
- 2026 Revenue Guidance is $45 million to $50 million, representing 35% to 50% growth
Beat or Miss?
| Metric | Reported | Estimated | Difference / Analysis |
| Full Year Revenue | $33.3M | $32.37M | Beat by ~$930K (~2.9% above consensus) |
| Q4 Revenue | $7.5M | $7.27M | Beat by ~$230K (~3.2% above consensus) |
| Full Year EPS | $0.02 | $0.02 | In line with consensus |
| Q4 EPS | ($0.01) | $0.01 | Missed by $0.02 (200% negative surprise) |
| Full Year Net Income | $1.28M | N/A | Up 91% YoY |
| Adjusted EBITDA (FY) | $4.1M | N/A | Up 81% YoY |
| Q4 Adjusted EBITDA | $0.3M | N/A | Down from $0.5M in Q4 2024 |
The company’s top-line performance was solid, clearing both quarterly and full-year consensus revenue estimates. However, Q4 profitability came in below expectations due to elevated operating expenses, particularly a spike in general and administrative costs of $3.18 million in the quarter, and a $377,587 provision for credit losses that weighed on the bottom line.
What Leadership Is Saying?
CEO Tim Johnson on strategy and platform vision:
“2025 was a defining year of disciplined execution and measurable platform scale for Health In Tech. We strengthened our AI-enabled underwriting marketplace, expanded carrier, broker, and TPA integrations, and further automated core insurance workflows to drive efficiency and margin scalability. We extended underwriting capabilities into larger employer segments and continued enhancing our technology architecture to support enterprise-level throughput across the approximately $300 billion U.S. claims administration market. Most importantly, we translated operational progress into financial performance, delivering 71% year-over-year revenue growth.”
CEO Tim Johnson on 2026 product and market expansion:
“As we enter 2026, our focus is on advancing a fully integrated marketplace model that expands beyond underwriting to include additional services such as claims administration and administrative cost-containment solutions. Building on years of assembling specialized healthcare vendors and service providers essential to self-funded plans, we enhanced our platform in January 2026 to offer more than 100 pre-configured, customized stop-loss programs tailored at the broker-agency level.”
Historical Performance
Health In Tech YoY Comparison (Q4 2025 vs Q4 2024)
| Category | Q4 2025 | Q4 2024 | Change (%) |
| Total Revenue | $7,508,585 | $4,904,564 | 53.10% |
| Gross Profit | $4,128,643 | $3,797,391 | 8.70% |
| Total Operating Expenses | $4,299,456 | $4,113,727 | 4.50% |
| Net Income (Loss) | ($302,557) | ($144,152) | -109.90% |
| Adjusted EBITDA | $316,550 | $464,950 | -31.90% |
Health In Tech Full Year YoY Comparison (FY 2025 vs FY 2024)
| Category | FY 2025 | FY 2024 | Change (%) |
| Total Revenue | $33,327,511 | $19,490,906 | 71.00% |
| Gross Profit | $20,937,728 | $15,439,467 | 35.60% |
| Total Operating Expenses | $19,409,290 | $14,449,563 | 34.30% |
| Net Income | $1,278,842 | $670,477 | 90.70% |
| Operating Cash Flow | $3,133,813 | $2,176,209 | 44.00% |
| Adjusted EBITDA | $4,112,833 | $2,270,745 | 81.10% |
Gross margin compression is a notable trend, declining from 79.2% in FY 2024 to 62.8% in FY 2025, driven primarily by cost of revenues rising from $4.05 million to $12.39 million as the platform scaled its SMR (Stone Mountain Risk) fee-based revenue segment.
Competitor Historical Performance
The table below compares Health In Tech against its primary publicly traded InsurTech / health-tech peer, Oscar Health (OSCR), on key revenue metrics. Direct comparables for private-market InsurTech peers are estimated where public filings are unavailable.
| Category | HIT FY 2025 | HIT FY 2024 | Change (%) | OSCR FY 2025 | OSCR FY 2024 | Change (%) |
| Total Revenue | $33.3M | $19.5M | 71.00% | $11.7B | ~$9.1B | 28.00% |
| Net Income (Loss) | $1.28M | $0.67M | 90.70% | -$443M | N/A | N/A |
| Operating Scale | Micro-cap (~$108.5M mkt cap) | N/A | N/A | Large-cap (~$2B+ mkt cap) | N/A | N/A |
Oscar Health reported $11.7 billion in 2025 revenue, a 28% YoY increase, but posted a net loss of $443 million, driven by a medical loss ratio surging to 87.4%. By contrast, Health In Tech operates in the self-funded B2B marketplace segment, operates profitably at the full-year level, and serves small-to-mid-market employers rather than direct insurance members, making the two companies structurally distinct despite both operating in the AI-driven InsurTech space. Health In Tech’s revenue growth rate of 71% considerably outpaces Oscar’s 28%, reflecting the company’s smaller base and faster-scaling platform business model.
How the Market Reacted?
Health In Tech shares closed at $1.81 on March 25, 2026, and dropped to approximately $1.52 in after-hours trading, a decline of roughly 16%, following the release of Q4 and full-year 2025 results. The Q4 EPS miss of $0.02 versus a $0.01 consensus forecast likely drove the negative after-hours sentiment, representing a 200% negative EPS surprise despite the top-line beat.
Simultaneously, the company announced a $7.0 million private placement on the same day, which may have added dilution concerns for investors in after-hours trading. The analyst consensus for HIT remains “Strong Buy” with a 12-month price target of $2.50, implying roughly 38% upside from the March 25 closing price, supported by the company’s 2026 revenue guidance of $45 million to $50 million.
