


Intel beat revenue expectations with $13.7 billion in Q4 2025 (down 4% YoY) and reported non-GAAP EPS of $0.15, exceeding the $0.08 forecast by 87.5%. Full-year revenue held flat at $52.9 billion with non-GAAP EPS of $0.42 (vs. 2024 loss of $0.13). Despite the earnings beat, Intel’s stock plummeted 16-17% in after-hours trading on January 22-23, 2026, due to weak Q1 2026 guidance ($11.7B-$12.7B revenue, $0.00 non-GAAP EPS) and severe supply chain constraints that limit production capacity through Q1.
About Intel Corporation
Intel Corporation (NASDAQ: INTC) is the world’s leading semiconductor designer and manufacturer, headquartered in Santa Clara, California. Founded in 1968, Intel has defined the global computing industry for over five decades and remains the dominant player in x86 CPUs, data center processors, and advanced memory solutions. As of February 3, 2026, Intel maintains a market capitalization of approximately $243.81 billion, making it the 65th most valuable company globally. The company employs 85,100 people across 14 countries and maintains state-of-the-art manufacturing facilities in the United States (Arizona, Oregon), Ireland, Israel, and Vietnam.
Intel’s recent 111% year-over-year stock appreciation reflects investor enthusiasm for its foundry turnaround strategy and its positioning in artificial intelligence. However, 2025 marked a critical inflection point as the company navigated supply chain challenges, product transitions, and competitive pressure from AMD in CPUs and NVIDIA in AI accelerators. The company’s pivot toward becoming both a chip designer and a foundry service provider (competing with TSMC and Samsung) represents one of the semiconductor industry‘s most ambitious strategic bets, supported by government subsidies under the CHIPS Act.
Top Financial Highlights
Q4 2025 Results
- Total Revenue: $13.7 billion (down 4% YoY, beat forecast of $13.41 billion by $310 million)
- Non-GAAP EPS: $0.15 (beat consensus of $0.08 by 87.5%)
- GAAP EPS (Loss): $(0.12) (larger loss than forecast $(0.03), reflects restructuring charges)
- Gross Margin (Non-GAAP): 37.9% (beat guidance by 140 basis points on higher revenue and lower reserves)
- Operating Margin (Non-GAAP): 8.8% (vs. 9.6% in Q4 2024)
- Operating Cash Flow: $4.3 billion
- Tax Rate: 198.5% (GAAP), impacted by loss position
Full-Year 2025 Results
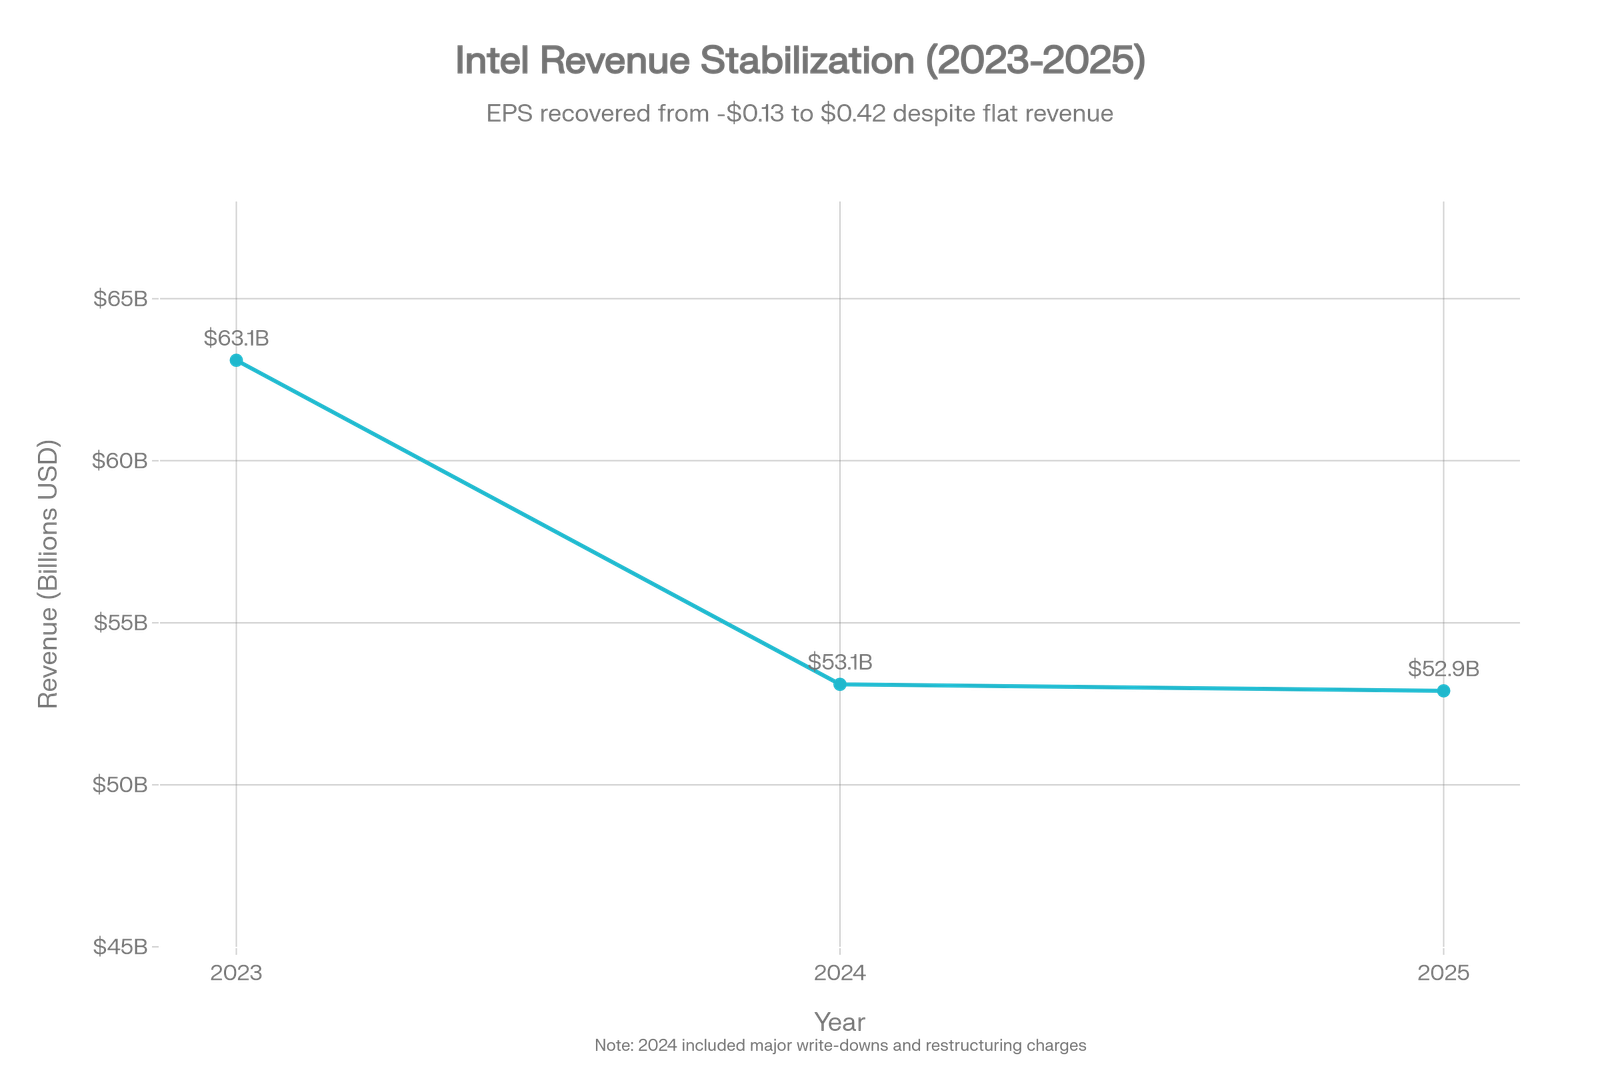
- Total Revenue: $52.9 billion (flat YoY vs. $53.1B in 2024)
- Non-GAAP EPS: $0.42 (massive turnaround from 2024 loss of $(0.13), +423% improvement)
- GAAP EPS (Loss): $(0.06) (vs. $(4.38) loss in 2024; 2024 included $19.2B write-down)
- Gross Margin (GAAP): 34.8% (up 210 basis points YoY to $18.5B absolute profit)
- Gross Margin (Non-GAAP): 36.7% (up 70 basis points YoY)
- Operating Cash Flow: $9.7 billion (down 51.7% from 2024’s $20.1B due to working capital and Altera divestiture)
- Adjusted Free Cash Flow: $9.6 billion (after capex of $11.2B net)
Business Segment Revenue Breakdown
| Segment | Q4 2025 | Q4 2024 | FY 2025 | FY 2024 | Notes |
| Client Computing Group (CCG) | $8.2B (-7%) | $8.8B | $32.2B (-3%) | $33.2B | Consumer/commercial PCs; pressure from mobile competition |
| Data Center & AI (DCAI) | $4.7B (+9%) | $4.3B | $16.9B (+5%) | $16.1B | Key growth segment; AI accelerators ramping |
| Intel Foundry Services | $4.5B (+4%) | $4.3B | $17.8B (+3%) | $17.3B | Contract manufacturing; growth limited by capacity |
| Other & Eliminations | $(4.3B) | $(4.2B) | $(17.7B) | $(16.9B) | Intersegment eliminations |
Capital Position & Cash Management
- Cash & Cash Equivalents: $14.3 billion (up from $8.2B in 2024)
- Short-term Investments: $23.2 billion (up from $13.8B)
- Total Liquidity: $37.5 billion (strong position)
- Capital Expenditures (Gross): $14.6 billion for Q4, $25.1 billion full year
- Government Incentives Received: $1.6 billion (CHIPS Act subsidies)
- Short-term Debt: $2.5 billion (down from $3.7B in 2024)
Q1 2026 Forward Guidance (Most Important)
- Expected Revenue: $11.7 billion to $12.7 billion (midpoint: $12.2 billion)
- Implication: -11% sequential decline from Q4 2025’s $13.7B; below consensus of $12.51B
- Expected Gross Margin (Non-GAAP): 34.5% (compression from Q4’s 37.9%)
- Expected EPS (Non-GAAP): $0.00 (break-even; implies minimal profitability)
- Expected EPS (GAAP): $(0.21) (larger loss, restructuring-related)
- Key Message: “Available supply at lowest level in Q1 before improving in Q2 and beyond”
Beat or Miss?
| Metric | Q4 2025 Reported | Estimate/ Guidance | Result | Variance | Analysis |
| Revenue | $13.7B | $13.41B | BEAT | +2.16% | Exceeded consensus; aligned with high end of prior guidance |
| Non-GAAP EPS | $0.15 | $0.08 | BEAT | +87.50% | Strongest earnings surprise; exceptional operating leverage |
| GAAP EPS | ($0.12) | ($0.03) | MISS | -300% | Larger loss due to $2.2B restructuring charges & tax effects |
| Gross Margin (non-GAAP) | 37.90% | ~37.4% (guided) | BEAT | +140 bps | Higher revenue and lower inventory reserves drove outperformance |
| Operating Expenses | $4.4B | ~$4.6B | BEAT | -4.30% | 14% YoY reduction; ongoing cost discipline from 2024 restructuring |
| FY 2025 Revenue | $52.9B | $53.1B (2024) | MISS | -0.40% | Essentially flat; slightly below historical expectations |
| FY 2025 Non-GAAP EPS | $0.42 | ~$0.35-0.40 | BEAT | +5-20% | Significant profitability recovery from 2024 $(0.13) loss |
| Q1 2026 Revenue Guidance | $11.7-12.7B | $12.51B (consensus) | MISS | -2.4% (midpoint) | Below expectations; reflects supply constraints |
| Q1 2026 Non-GAAP EPS | $0.00 | ~$0.05 (consensus) | MISS | -100% | Break-even guidance vs. profitable expectations |
Intel beat on Q4 EPS and revenue, but provided disappointing Q1 2026 guidance. Wall Street prioritized the weak forward outlook over the strong historical results, triggering the 16-17% stock selloff. The market is pricing in 18-24 months of below-consensus profitability until supply normalizes.
What Leadership Is Saying?
“Our conviction in the essential role of CPUs in the AI era continues to grow. We delivered a solid finish to the year and made progress on our journey to build a new Intel. The introduction of our first products on Intel 18A the most advanced process technology developed and manufactured in the United States marks an important milestone, and we’re working aggressively to grow supply to meet strong customer demand. Our priorities are clear: sharpen execution, reinvigorate engineering excellence, and fully capitalize on the vast opportunity AI presents across all of our businesses.” – CEO Lip-Bu Tan on Strategy & Competitive Position
Tan is asserting that despite competitive challenges, Intel remains essential to the AI revolution. The Intel 18A process node ramp is being positioned as a major achievement and source of future competitive differentiation. This reflects Intel’s bet that advanced process technology + foundry services will be key to regaining ground.
“We exceeded Q4 expectations across revenue, gross margin, and EPS even as we navigated industry-wide supply shortages. We expect our available supply to be at its lowest level in Q1 before improving in Q2 and beyond. Demand fundamentals across our core markets remain healthy as the rapid adoption of AI reinforces the importance of the x86 ecosystem as the world’s most widely deployed high-performance compute architecture.” – CFO David Zinsner on Financial Outlook & Supply Realities
Zinsner is essentially saying: (1) We beat expectations despite supply constraints, proving execution excellence; (2) Q1 will be our worst quarter, a trough moment; (3) Recovery is coming in Q2 as manufacturing bottlenecks ease; (4) Demand remains strong the problem is purely supply-side, not market weakness. This narrative is designed to reassure investors that guidance is conservative and upside is likely in H2 2026.
Historical Performance: Q4 2025 vs. Q4 2024
| Financial Metric | Q4 2025 | Q4 2024 | YoY Change | Percentage Change |
| Revenue | $13.7B | $14.3B | $(0.6)B | -4.20% |
| Gross Profit (GAAP) | $4.97B | $5.56B | $(0.59)B | -10.60% |
| Gross Margin (GAAP) | 36.10% | 39.20% | -3.1 ppts | -7.9% |
| Gross Margin (non-GAAP) | 37.90% | 42.10% | -4.2 ppts | -10.0% |
| Operating Expenses (R&D + MG&A) | $4.4B | $5.1B | $(0.7)B | -13.70% |
| Operating Income (GAAP) | $0.58B | $0.41B | $0.17B | +41.50% |
| Operating Margin (GAAP) | 4.20% | 2.90% | +1.3 ppts | +44.8% |
| Operating Margin (non-GAAP) | 8.80% | 9.60% | -0.8 ppts | -8.3% |
| Net Income (Loss) (GAAP) | $(0.6)B | $(0.1)B | $(0.5)B | -500.00% |
| Diluted EPS (GAAP) | ($0.12) | ($0.03) | ($0.09) | -300.00% |
| Diluted EPS (non-GAAP) | $0.15 | $0.13 | $0.02 | +15.40% |
| Tax Rate (GAAP) | 198.50% | 125.50% | +73 ppts | +58.2% |
Intel’s Q4 2025 YoY comparison reveals a mixed performance masked by strong non-GAAP profitability. Revenue declined 4.2% to $13.7B, indicating market share pressure in both Consumer (CCG down 7%) and modest growth in AI (DCAI +9%). However, gross margins contracted 310-420 basis points a concerning trend. This margin compression stems from three factors: (1) unfavorable product mix (higher mix of outsourced products for AI PC ramp); (2) early production of Intel 18A, which carries lower yields and higher costs; (3) lower inventory reserves due to working capital optimization.
Despite gross margin headwinds, Intel demonstrated operational discipline by reducing R&D and MG&A spending 13.7% YoY, more than offsetting revenue decline. This allowed non-GAAP EPS to grow 15.4% to $0.15 a positive surprise. However, GAAP EPS deteriorated significantly to a $(0.12) loss, driven by $2.2B in restructuring charges (employee severance, facility exits) and extraordinarily elevated tax rates reflecting the company’s loss position.
Intel is sacrificing near-term profitability (through restructuring and foundry ramp investments) while using cost cuts to sustain non-GAAP profitability. This is a classic turnaround strategy: buy time through expense discipline while capital investments mature.
Full-Year Comparison: 2025 vs. 2024
| Financial Metric | 2025 | 2024 | YoY Change | Percentage Change | Notes |
| Revenue | $52.9B | $53.1B | $(0.2)B | -0.40% | Essentially flat; 2024 was weakest year in 20+ years |
| Gross Profit (GAAP) | $18.5B | $17.3B | $1.2B | +6.90% | Margin expansion on lower cost structure |
| Gross Margin (GAAP) | 34.80% | 32.70% | +2.1 ppts | +6.4% | Stabilization after 2024 weakness |
| Gross Margin (non-GAAP) | 36.70% | 36.00% | +0.7 ppts | +1.9% | Limited expansion; product mix headwinds |
| R&D + MG&A Expenses | $18.4B | $22.1B | $(3.7)B | -16.70% | Restructuring realized; 2024 included peak layoff costs |
| Operating Income (Loss) (GAAP) | $(2.2)B | $(11.7)B | $9.5B | +81.20% | Massive improvement; 2024 included $19.2B goodwill write-down |
| Operating Margin (GAAP) | -4.20% | -22.00% | +17.8 ppts | +80.9% | Path back to profitability |
| Operating Margin (non-GAAP) | 5.50% | -0.50% | +6.0 ppts | N/A (swing from loss) | Core business returned to profitability |
| Net Income (Loss) (GAAP) | $(0.3)B | $(18.8)B | $18.5B | +98.40% | 2024 was catastrophic loss; 2025 minimal loss |
| Diluted EPS (GAAP) | ($0.06) | ($4.38) | $4.32 | +98.60% | Swing from severe loss to near break-even |
| Diluted EPS (non-GAAP) | $0.42 | ($0.13) | $0.55 | +423.10% | Extraordinary profitability swing |
| Operating Cash Flow | $9.7B | $20.1B | $(10.4)B | -51.70% | Significant decline due to working capital changes |
| Free Cash Flow (Adjusted) | $9.6B | $20.1B | $(10.5)B | -52.20% | Less available for dividends/buybacks |
| Capital Expenditures (gross) | $25.1B | $25.1B | $0B | 0% | Flat; foundry buildout continues at peak levels |
Intel’s 2025 full-year results paint a picture of a company stabilizing after a near-death experience in 2024. The key story: Intel went from near-insolvency to operational profitability, but at the cost of cash generation.
- Revenue Stagnation: Flat revenue performance ($52.9B vs. $53.1B) signals that Intel has lost ground in its core markets (CCG down 3% in FY2025). This is the concerning headline: Intel is not growing only defending.
- Operational Restructuring Worked: The 16.7% reduction in R&D + MG&A ($3.7B savings) reflects the aggressive 2024-2025 restructuring. The company eliminated ~15,000 employees and consolidated real estate, realizing cost targets ahead of schedule. This enabled the non-GAAP EPS swing from loss to profit.
- Gross Margin Stability: The 210-basis-point GAAP gross margin expansion (32.7% to 34.8%) is real and meaningful, driven by lower per-unit manufacturing costs. However, non-GAAP margins expanded only 70 basis points, suggesting the GAAP improvement includes one-time benefits.
- Cash Flow Collapse: Operating cash flow fell 52% from $20.1B to $9.7B a major red flag. This reflects: (1) lower earnings; (2) higher working capital tied up in manufacturing ramps; (3) payment timing of restructuring severance. Less cash generation means less ability to fund the $25B+ annual foundry capex without external financing (government grants, potential debt issuance).
- Capital Intensity Unchanged: The $25.1B in gross capex shows Intel has not reduced investment despite profitability challenges. This is strategic determination (betting the company on foundry), but also financial risk, the company is borrowing from the future to fund current buildout.
Intel traded 2025 profitability for market position in 2024 (took write-downs, restructured aggressively). Now it’s trying to claw back through operational discipline, but growth remains elusive. The company is essentially betting that foundry services and AI products will drive future growth, but 2025 showed no evidence of that bet paying off yet.
Competitive Landscape Q4 2025: Intel vs. Semiconductor Peers
| Metric | Intel Q4 | NVIDIA Q4 | Broadcom Q4 | AMD Q4 Est. |
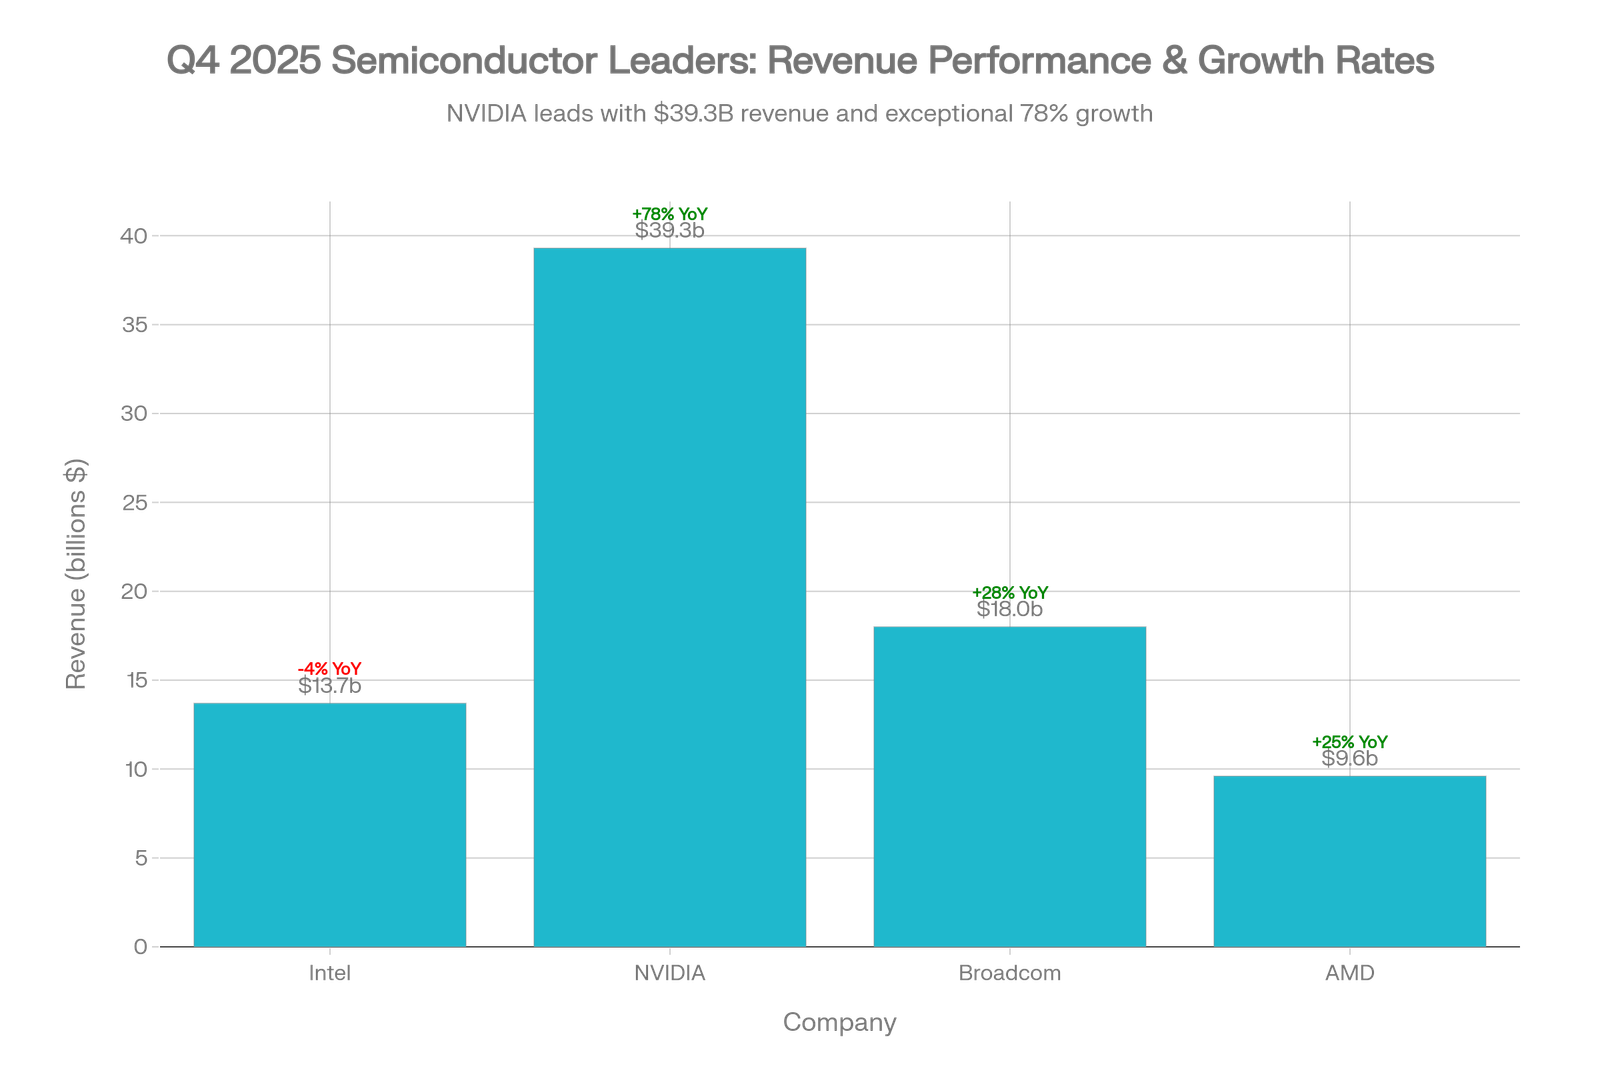
| Revenue | $13.7B | $39.3B | $18.0B | $9.6B |
| YoY Growth | -4% | +78% | +28% | +25% |
| Gross Margin | 37.9% (non-GAAP) | 73.50% | 67.8% (non-GAAP) | ~54% (est.) |
| Non-GAAP EPS | $0.15 | $0.89 | $1.95 | ~$1.20 |
| EPS YoY Growth | +15.40% | +71% | +4.30% | ~+30% |
| Operating Margin | 8.8% (non-GAAP) | 67.10% | 66.20% | ~24% (est.) |
| Data Center Revenue | $4.7B (+9% YoY) | $35.6B (+93% YoY) | ~$11.1B (+35% YoY)* | Combined |
| AI Growth Rate | ~9% | ~78% YoY (DC) | +74% YoY (AI semi) | +25-30% overall |
| Stock Reaction Post-Earnings | -16% to -17% | +3.67% | -1.94% | TBD (Q4 report pending) |
*Note: Broadcom’s $11.1B Q4 semiconductor revenue includes AI accelerators; overall AI revenue grew 74% YoY
Competitive Analysis
- Market Leadership Divergence is Extreme:
- NVIDIA’s $39.3B Q4 revenue is 2.9x larger than Intel’s $13.7B, with 78% YoY growth vs. Intel’s -4% contraction
- This gap reflects NVIDIA’s dominance in AI accelerators (data center revenue $35.6B, up 93% YoY)
- Intel’s AI play (DCAI segment) grew only 9% YoY to $4.7B—one-tenth of NVIDIA’s data center revenue
- Margin Collapse Reveals Competitive Weakness:
- NVIDIA’s 73.5% gross margin vs. Intel’s 37.9% represents a 3,560 basis point gap
- Broadcom’s 67.8% margin also dwarfs Intel, reflecting AI infrastructure pricing power
- Intel’s 37.9% margin barely covers its operating expenses ($4.4B on $13.7B revenue = 32% OpEx ratio)
- This leaves only 5.9% operating margin, vs. NVIDIA’s 67.1% and Broadcom’s 66.2%
- AI Revenue Capture is Skewed:
- NVIDIA captured the AI boom: data center +93% YoY, representing 90% of total revenue
- Broadcom’s AI semiconductor revenue grew 74% YoY, representing ~55% of its semiconductor business
- Intel’s DCAI grew only 9% YoY, suggesting the company is losing AI market share to NVIDIA, AMD, Broadcom, and custom silicon
- AMD is expected to grow 25-30% overall with data center as key driver, outpacing Intel
- Operating Leverage Gap:
- NVIDIA and Broadcom are both operating leverage machines: incremental revenue drops straight to the bottom line at 70%+ margins
- Intel’s lower margins mean it must grow revenue 3-4x faster to match competitor profit growth
- This structural disadvantage could persist for years if process node leadership doesn’t translate to market share gains
- Stock Market’s Verdict:
- NVIDIA rallied +3.67% post-earnings despite beating expectations by $1B (2.6%)
- Broadcom fell -1.94% despite beating revenue and achieving strong growth—suggesting market wanted more
- Intel crashed -16% to -17% despite beating both revenue and EPS—showing market discounted disappointing guidance
- This suggests equity investors are rotating toward pure-play AI (NVIDIA) and away from foundational chip designers (Intel)
- Forward Outlook Shows Divergence:
- NVIDIA guided Q1 FY26 revenue of $65B (±2%), implying continued 50%+ sequential growth
- Broadcom guided Q1’26 revenue of $19.1B (+6% sequential), with AI semiconductor revenue doubling YoY
- AMD expects continued double-digit data center growth
- Intel guided Q1 2026 revenue of $11.7B-$12.7B (down 11% sequential), with non-GAAP EPS of $0.00—implying material margin compression
The competitive landscape in Q4 2025 reveals a clear bifurcation: AI-winner (NVIDIA, Broadcom) stocks surged and maintained pricing power; Intel, despite earnings beat, signalled distress through weak guidance. The market is pricing Intel as a cyclical turnaround story with a binary outcome (foundry works or doesn’t), while rewarding pure-play AI operators with multiple expansions.
How the Market Reacted?
Immediate Market Action (January 22-23, 2026):
Intel’s stock experienced a shocking reversal immediately following the January 22, 2026 earnings announcement at 2 PM PT. Despite beating Q4 revenue ($13.7B vs. $13.41B estimate) and non-GAAP EPS ($0.15 vs. $0.08 estimate)—both material beats—the stock plunged 16-17% in after-hours trading, wiping out approximately $40 billion of market cap in a single session.
Root Cause of the Selloff:
Wall Street’s negative reaction centered entirely on forward guidance, not historical results. The critical disappointment:
- Q1 2026 Revenue Guidance: $11.7B-$12.7B (midpoint $12.2B).
- Wall Street Consensus: $12.51 billion (vs. Morgan Stanley $12.7B, Goldman Sachs $12.3B).
- Intel’s Guidance: Below consensus by $310 million (-2.4%).
- Sequential Implication: -11% quarter-over-quarter revenue decline from Q4’s $13.7B—alarming in normal industries, catastrophic in semiconductors during the AI boom.
- Q1 2026 Non-GAAP EPS Guidance: $0.00 (break-even).
- Wall Street Consensus: $0.05 per share.
- Intel’s Guidance: Miss by $0.05 (-100%).
- Margin Implication: Non-GAAP EPS of $0.00 on revenue midpoint of $12.2B = 0% net margin (before tax).
- This is razor-thin profitability vs. Broadcom’s 66% operating margin or NVIDIA’s 67%.
- CFO’s Language on Supply: David Zinsner stated bluntly: “We expect our available supply to be at its lowest level in Q1 before improving in Q2 and beyond.” This is a trough-quarter warning—the market hates uncertainty around when recovery starts.
Analyst Reaction (Post-Announcement):
Within 48 hours of earnings, major semiconductor analysts issued mixed verdicts:
- Morgan Stanley (January 23): Raised price target from $38 to $41 (+8%), kept Equal Weight rating.
- Rationale: “Meaningful supply constraints are problematic for foundry ambitions; confidence in data center AI tailwinds tempered by supply issues”.
- Tigress Financial (January 24): Raised price target from $52 to $66 (+27%), maintained Buy rating.
- Rationale: “The recent pullback in shares represents a significant buying opportunity; AI data center tailwinds position Intel into an increasingly compelling multi-year upside story”.
- Goldman Sachs (Estimated consensus): Maintained Hold/Neutral rating.
- Consensus: Waiting for supply recovery evidence before re-rating.
- JPMorgan Chase (Estimated): Neutral; focused on binary foundry outcome.
Negative Factors Cited by Bears
- Supply-demand mismatch: Strong demand for Intel products but constrained manufacturing capacity
- Market share loss in AI: NVIDIA captured 93% YoY data center growth; Intel only 9% YoY
- Foundry strategy unproven: No major customer anchor yet announced; government subsidies creating dependency
- Competitive disadvantage: 37.9% gross margins vs. NVIDIA’s 73.5% makes it hard to compete on price
- Cash burn concern: $25B annual capex + flat revenue = potential debt spiral if foundry doesn’t deliver
Positive Factors Cited by Bulls:
- Intel’s 18A process node ramp is a major achievement—only U.S. company manufacturing leading-edge chips
- AI PC opportunity (Core Ultra Series 3) is real, with 200+ OEM designs expected
- Q1 is a trough quarter—recovery visible in Q2/Q3 guidance
- Valuation compression post-selloff: Trading at negative multiples due to near-breakeven EPS, creating asymmetric upside if supply resolves
- Geopolitical tailwinds: U.S. government pushing reshoring; CHIPS Act subsidies continue flowing
Stock Price Evolution (January 22 – February 3, 2026)
| Date | Close Price | Daily Change | Notes |
| Jan 21, 2026 (Pre-earnings) | ~$54.60 | N/A | Stock near 52-week high; optimism on Intel turnaround |
| Jan 22, 2026 (Earnings day, 4:00 PM close) | $54.42 | -0.30% | Minimal reaction during regular trading |
| Jan 23, 2026 (Next day) | $45.36 | -16.70% | Post-earnings selloff in response to weak guidance |
| Jan 27-30, 2026 | $47-50 range | Volatile | Market digesting guidance; technical bounce |
| 2-Feb-26 | $50.24 | -1.50% | Stabilization as investors bottom-fish |
| 3-Feb-26 | $49.04-$50.24 | +0.5% (day) | Current level; -8% below pre-earnings |
The paradoxical response—earnings beat, stock crashes—is a classic “sell on good news” scenario where the market is forward-looking. Wall Street was pricing in Intel’s recovery based on a stronger Q1 2026 than what management guided. The 16-17% selloff represents a repricing from “recovery story with upside surprise” to “high-risk turnaround with execution risk.” The 8% net decline from pre-earnings levels suggests the market has partially stabilized but remains skeptical.
Strategic Implications & Forward Outlook
What Intel Got Right in 2025?
- Cost Structure Discipline: The 16.7% reduction in R&D + MG&A spending ($3.7B savings) demonstrates management’s ability to execute cost cuts. This allowed non-GAAP EPS to grow despite flat revenue—proof that operational leverage exists if the company can stabilize revenue.
- Intel 18A Ramp Success: Achieving high-volume manufacturing of the company’s most advanced process node at Arizona and Oregon facilities is a genuine technology win. This is the first Intel process technology that can compete with TSMC’s N3/N2 class nodes—a critical milestone for foundry credibility.
- Modest AI Growth: While DCAI’s 9% YoY growth lags NVIDIA’s 93%, it’s positive growth in a competitive market. The introduction of Intel Xeon 6 and partnerships (e.g., Cisco) show the company is not ceding enterprise AI completely.
- Balance Sheet Strengthening: The $12.7B increase in cash position (to $37.5B) includes $5B from NVIDIA’s strategic investment, providing financial flexibility to weather supply disruptions without external financing pressure.
What Intel Got Wrong?
- Supply Chain Crisis Unresolved: CFO Zinsner’s warning that Q1 supply will be at “lowest level” suggests manufacturing bottlenecks extending into 2026. This is not typical for a $25B annual capex company—it indicates process node challenges or yield issues that management has not solved.
- Market Share Loss in AI: Intel’s DCAI segment growing only 9% YoY while NVIDIA data center grows 93% YoY is damning evidence that the company is losing the most important market. This suggests custom silicon (Broadcom, Alibaba, Amazon, Google) and NVIDIA GPUs are filling demand that Intel could be serving with Xeon CPUs.
- Foundry Services Languishing: At only 4% YoY growth, Intel Foundry Services is underperforming relative to the $25B+ annual capex and government subsidies being invested. Without a major customer anchor (e.g., ARM-based server chip, high-end ASIC), the business remains a venture capital project, not a revenue engine.
- Gross Margin Compression: The 310-420 basis-point YoY decline in gross margin is concerning. This reflects unfavorable product mix (low-margin outsourced AI PC products) and Intel 18A early production inefficiencies. If margins don’t expand as yields improve, Intel’s business model will struggle to generate adequate returns on $25B annual capex.
Q1 2026 Red Flags
- Revenue Guidance Below Consensus: $11.7B-$12.7B midpoint of $12.2B vs. $12.51B consensus = -2.4% miss. In a growth industry, negative guidance is a major negative signal.
- Profitability at Break-even: Non-GAAP EPS of $0.00 on ~$12.2B revenue = essentially no profit after tax. This implies gross margins will compress to ~33-34% range—a painful decline from Q4’s 37.9%.
- Sequential Decline: Q1 revenue expected down 11% sequentially is unusual for a company with strong demand. This signals either (a) customer push-outs due to supply constraints, or (b) management overestimating demand and correcting down.
Bottom Line for Investors
Intel’s Q4 2025 earnings reveal a company stabilizing operationally (non-GAAP profitability achieved) but struggling competitively (losing AI market share) and facing supply chain uncertainty (Q1 trough, recovery timing unclear). The 16-17% stock selloff reflects justified concerns about forward profitability and execution risk on the foundry strategy.
- Bull Case: Intel 18A ramp is real, foundry wins are imminent, and supply resolves by Q2—creating $45+ stock price upside by 2027.
- Bear Case: Supply constraints reflect deeper yield/efficiency issues, NVIDIA and AMD completely dominate AI market, and foundry never achieves profitability—leading to $30-35 stock by end of 2026.
- Base Case: Supply issues resolve by Q2, Intel stabilizes revenue at $53-54B run-rate, non-GAAP EPS reaches $0.60-0.70 by 2027, stock settles at $50-55 range as foundry strategy proves out partially but doesn’t eliminate NVIDIA’s competitive advantage.
The market’s decision to crash the stock on guidance miss (despite earnings beat) is rational—Intel has lost the credibility to guide conservatively and beat. Investors now demand evidence of demand and margin recovery, not promises of future improvement. Q1 2026 earnings (due April 2026) will be make-or-break for investor confidence.