


Luceco PLC (LSE: LUCE) delivered a standout 2025 with revenue rising 11.9% to £271.4 million, statutory EPS up 42.1% to 13.5p, and adjusted EPS up 20% to 15.0p. Net profit climbed 39% to £20.3 million. Shares surged +8.4% to 173p on results day (March 25, 2026), reflecting strong investor confidence in the company’s growth trajectory.
About Luceco PLC
Luceco PLC (LSE: LUCE) is a leading British designer and manufacturer of residential and commercial electrification products. Founded in 2011 and headquartered in London, UK, the company operates through four key product lines: wiring accessories (sold under the British General and Nexus brands), LED lighting (including the DW Windsor commercial LED brand), portable power devices, and EV chargers (Sync Energy brand).
As of March 25, 2026, Luceco has a market capitalisation of approximately GBP 243.4 million and an enterprise value of GBP 317.1 million. The company employs approximately 1,707 people and generates revenue of roughly GBP 159,000 per employee. With a trailing P/E ratio of 11.91 and a forward P/E of 9.94, the stock appears attractively valued relative to current earnings growth. Luceco distributes products across the UK (79% of revenue), Europe, the Americas, the Middle East, and Asia Pacific, and is majority owned by insiders (24.4%) and institutional investors (59%).
Top Financial Highlights
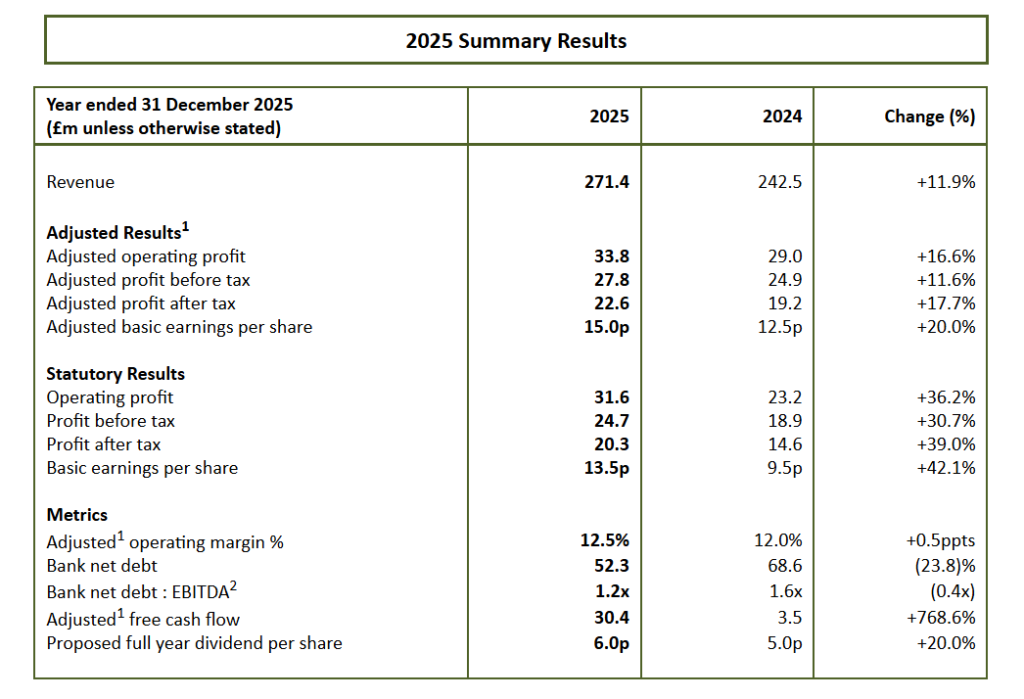
- Revenue reached £271.4 million, up +11.9% from £242.5 million in 2024
- Like-for-like revenue growth of 4.6%, accelerating to 6.7% in the second half
- Adjusted Operating Profit rose to £33.8 million, up +16.6% year on year (2024: £29.0m)
- Statutory Net Income of £20.3 million, up +39.0% (2024: £14.6m)
- Adjusted Basic EPS of 15.0p, up +20.0% (2024: 12.5p)
- Statutory Basic EPS of 13.5p, up +42.1% (2024: 9.5p)
- Adjusted Operating Margin improved to 12.5%, up +0.5 percentage points (2024: 12.0%)
- Gross Margin reached a record 41.8% despite higher raw material costs
- Adjusted Free Cash Flow surged to £30.4 million, up +768.6% from just £3.5m in 2024
- Bank Net Debt reduced to £52.3 million (2024: £68.6m), with leverage of 1.2x EBITDA
- EV Charging sales up +84.7% to £18.1 million (2024: £9.8m)
- Wiring Accessories segment revenue up +20.7% to £131.4 million
- Full-year dividend increased +20% to 6.0p per share, paid 40% of adjusted earnings
- Adjusted Operating Profit CAGR above 15% over the past three years
- 2026 guidance: Adjusted Operating Profit expected to exceed £37 million, beating analyst consensus range of £34.7m to £36.5m
Beat or Miss?
Luceco Full Year 2025 vs Full Year 2024
| Category | FY 2025 | FY 2024 | Change (%) |
| Revenue | £271.4m | £242.5m | 11.90% |
| Adjusted Operating Profit | £33.8m | £29.0m | 16.60% |
| Statutory Net Income | £20.3m | £14.6m | 39.00% |
| Adjusted EPS | 15.0p | 12.5p | 20.00% |
| Statutory Basic EPS | 13.5p | 9.5p | 42.10% |
| Adjusted Operating Margin | 12.50% | 12.00% | +0.5ppts |
| Gross Margin | 41.8% (record) | 40.21% | +1.59ppts |
| Adjusted Free Cash Flow | £30.4m | £3.5m | 768.60% |
| Bank Net Debt | £52.3m | £68.6m | -23.80% |
| Operating Expenses (SGA) | £83.6m | £74.3m | 12.50% |
| Full-Year Dividend | 6.0p | 5.0p | 20.00% |
What Leadership Is Saying?
CEO John Hornby
“We delivered another strong performance in 2025, with momentum building through the year, again demonstrating the Group’s ability to deliver compound growth. Our Energy Transition offering continues to scale rapidly, with EV charging sales up 85%, providing us with a significant installed base across the UK, while our core categories delivered steady, resilient and cash generative growth. Our competitive advantages in channel reach, new product innovation, integrated manufacturing, and ability to organically fund disciplined M&A position us well to deliver continued profitable growth across our established categories and our expanding role in the Energy Transition. Given the Group’s continued momentum and strong start to 2026 we are upgrading expectations for the full year.”
CFO Will Hoy (from the Financial Review)
“Adjusted Free Cash Flow of £30.4m in the period was £26.9m better than the prior year due to the anticipated reversal of the working capital outflow seen in 2024, higher operating profit and lower tax payments. The Group’s non-utilised facilities totalled £68.7m [and] the Group signed a £120.0m facility on the 21 May 2025 which expires in May 2028 but has the optionality of extending further by two years to May 2030.”
Historical Performance
Luceco Full Year 2025 vs Full Year 2024
| Category | FY 2025 | FY 2024 | Change (%) |
| Revenue | £271.4m | £242.5m | 11.90% |
| Adjusted Operating Profit | £33.8m | £29.0m | 16.60% |
| Statutory Net Income | £20.3m | £14.6m | 39.00% |
| Adjusted EPS | 15.0p | 12.5p | 20.00% |
| Statutory Basic EPS | 13.5p | 9.5p | 42.10% |
| Adjusted Operating Margin | 12.50% | 12.00% | +0.5ppts |
| Gross Margin | 41.8% (record) | 40.21% | +1.59ppts |
| Adjusted Free Cash Flow | £30.4m | £3.5m | 768.60% |
| Bank Net Debt | £52.3m | £68.6m | -23.80% |
| Operating Expenses (SGA) | £83.6m | £74.3m | 12.50% |
| Full-Year Dividend | 6.0p | 5.0p | 20.00% |
Segment Performance in 2025
| Segment | Revenue 2025 | Revenue 2024 | Change | Adj. Op. Profit 2025 | Adj. Margin |
| Wiring Accessories | £131.4m | £108.9m | 20.70% | £19.4m | 14.80% |
| LED Lighting | £79.3m | £78.4m | 1.10% | £6.3m | 7.90% |
| Portable Power (incl. EV) | £60.7m | £55.2m | 10.00% | £8.1m | 13.30% |
| EV Charging (within Portable Power) | £18.1m | £9.8m | 84.70% | Included above | N/A |
Geographic Revenue Split in 2025
| Region | 2025 Revenue | 2024 Revenue | Change |
| UK | £214.6m | £184.2m | 16.50% |
| Europe | £24.1m | £21.5m | 12.10% |
| Americas | £20.1m | £22.5m | -10.70% |
| Middle East and Africa | £9.4m | £10.3m | -8.70% |
| Asia Pacific | £3.2m | £4.0m | -20.00% |
Competitor Comparison
Luceco operates in the broader electrical products and infrastructure market, competing across lighting, wiring accessories, and electrification products. For context, FY 2025 results for key sector players are shown below.
| Category | Luceco FY 2025 | Luceco FY 2024 | Change (%) |
| Revenue | £271.4m | £242.5m | +11.9% |
| Net Income | £20.3m | £14.6m | +39.0% |
| Adj. Operating Profit | £33.8m | £29.0m | +16.6% |
| Category | Legrand FY 2025 | Legrand FY 2024 | Change (%) |
| Revenue | €9,480.6m | €8,648.9m | +9.6% |
| Net Income | €1,244.6m | €1,166.4m | +6.7% |
| Adj. Operating Margin | 20.70% | ~20.5% | +0.2ppts |
| Category | Schneider Electric FY 2025 | Schneider Electric FY 2024 | Change (%) |
| Revenue | €40,152m | ~€38.2bn | +5.2% reported; +8.9% organic |
| Net Income | €4.2 billion | ~€4.3 billion | -2% |
| Adj. EBITA Margin | 18.70% | ~18.2% | +50bps organic |
Analysis
Luceco’s 11.9% revenue growth in 2025 compares favorably to both Legrand (+9.6%) and Schneider Electric (+5.2% reported). While Luceco remains far smaller in scale, its 39% net income growth and record cash generation suggest meaningful operational leverage as a high-growth specialty electrification player. Legrand and Schneider are benefiting primarily from datacenter demand, whereas Luceco’s growth is powered by EV infrastructure and UK residential electrification.
How the Market Reacted?
Luceco shares rose +8.4% to 173p on March 25, 2026, the day of the full year results announcement, reflecting broad positive sentiment. This follows an earlier rally of +6.2% when the company released its H1 2025 interim results in September 2025.
The bullish reaction to the 2025 full year release was driven by a combination of profit beats, significant cash flow improvement, and a 2026 profit guidance upgrade that topped analyst consensus by a meaningful margin. The stock had gained +22.1% over the prior 52 weeks entering results day, and the strong results support the view that Luceco’s EV charging and energy transition exposure represents a durable structural growth story heading into 2026.
