


Introduction
Meesho Statistics: Meesho, which started as a basic social selling platform, reached its peak disruptive power in Indian online retail by 2025 when it achieved unprecedented user growth and order volume before its IPO attracted worldwide interest. Meesho demonstrates its 2025 growth path through its statistics, which show explosive expansion, widespread market access, and active efforts to achieve profitability.
This article examines the main Meesho statistics 2025 operations, which include user base numbers and orders processed, together with revenue and valuation data and market share details, strategic analytics, and future projections, which researchers, financial experts, and industry analysts have verified.
Editor’s Choice
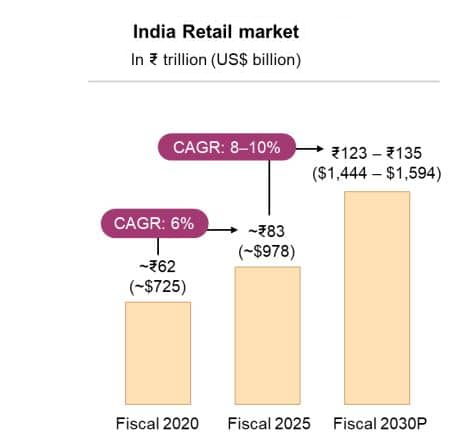
- India’s retail market stood at ₹83 trillion (USD 978 billion) in FY2025 and is projected to grow at an 8–10% CAGR to ₹123–135 trillion by FY2030.
- Meesho’s Q3 FY26 revenue rose 31% YoY to ₹35.20 billion. Net loss widened to ₹4.90 billion in Q3 FY26 from ₹374 million last year.NMV increased 26% YoY to ₹10,995 crores in Q3 FY26.
- The contribution margin reduced by 200 basis points when compared to the previous year to reach 2.3% of net merchandise value.
- The number of annual transacting users increased by 34% compared to the previous year to reach 251 million.
- The number of quarterly orders placed increased by 35% compared to the previous year to reach 690 million.
- The average user makes 9.78 purchases every year, which represents a 9% increase from the previous year.
- The number of annual transacting sellers increased by 81% compared to the previous year to reach 846000.
- AI systems handle complete resolution of 63% of all customer support inquiries.
- Meesho accounted for between 29% and 31% of India’s total e-commerce delivery volume throughout fiscal year 2025.
- GMV index rose to 146 in FY2025 versus the market index of 127 (FY2023 base 100).
- Meesho’s seller enablement costs are 35–61% lower than industry averages.
- Cash reserves stood at ₹7,277 crores as of December 31, 2025. Free Cash Flow to Equity reached ₹437 crores in the last 12 months.
India Retail Market
(Source: meesho.com)
- The retail market of India, which currently holds a value of approximately ₹83 trillion (USD 978 billion), will experience growth to reach a value between ₹123 trillion and ₹135 trillion (USD 1.4 trillion to USD 1.6 trillion) by FY2030, according to industry estimates, which predict an annual growth rate between 8 % and 10 %.
- The current situation shows a faster recovery process, which exceeds the recovery rate from the world pandemic that occurred during the COVID-19 period and the worldwide economic disruptions.
- India displays large potential for retail market growth because its citizens spend less on retail than people from both China and the United States.
- The increasing use of digital technologies, together with growing consumption in Tier II and III markets, and the latest Meesho updates, will create greater accessibility to eCommerce according to an analyst statement.
- The latest Meesho data shows how the platform enables retail demand to become accessible to all people (source: industry reports, 2025 projections).
Meesho’s Q3 FY26 Earnings
| Financial Metric: | Q3 FY26 | Q3 FY25 | YoY Growth |
| Revenue: | ₹35.20 billion | ₹26.80 billion | 31% |
| Net Loss: | ₹4.90 billion | ₹374 million | – |
| NMV: | ₹10,995 crores | ₹8,730 crores | 26% |
| Contribution Margin %: | 2.30% | 4.30% | -200 bps |
(Source: scanx.trade)
- Meesho achieved major revenue growth during Q3 of fiscal year 2026 because its revenue increased by 31 % to reach ₹35.20 billion, which represented a rise from ₹26.80 billion during Q3 of fiscal year 202,5 based on company documents.
- The company experienced a 26 % increase in its net merchandise value, which reached ₹10,995 crores, because customers continued to purchase value-based products.
- Meesho statistics show that the company experienced an increase in net loss, which reached ₹4.90 billion compared to the net loss of ₹374 million from the previous year due to higher expenses for acquiring customers, developing logistics, and expanding platform capabilities.
- The company saw its contribution margin decrease to 2.3 % because it needed to spend more money on promotions and deal with increased competition.
- The Meesho data shows that the company changed its strategy towards gaining market share instead of focusing on short-term profits, according to an analyst assessment.
- The platform demonstrates its fundamental strength through its improved revenue growth and increased transaction volume despite the fact that losses have expanded.
- Meesho will move away from growth through center expansion toward growth through operational efficiency when its operating leverage starts to improve and its profit margins reach a stable level.
Meesho User Momentum And Engagement
| User Metric: | Q3 FY26 | Q3 FY25 | YoY Growth |
| Annual Transacting Users: | 251 million | 187 million | 34% |
| Placed Orders: | 690 million | 509 million | 35% |
| Frequency: | 9.78 | 8.98 | 9% |
(Source: scanx.trade)
- The company reports Q3 FY26 results, which show substantial platform growth because their Annual Transacting Users increased 34% to 251 million from 187 million.
- The number of placed orders increased by 35,% reaching 690 million, while users showed a 9% improvement in purchase behavior with 9.78 transactions per user annually.
- The Meesho data demonstrates that the company successfully acquired new customers while building stronger relationships with existing customers.
- The analyst observes that the growth pattern shows better management of customer relationships throughout their entire lifecycle with improved customer retention processes.
- The Sensor Tower data shows that Meesho maintained its position as the most downloaded shopping application in India during Q3 FY26, which helped establish its dominance over initial customer acquisition stages.
- The business uses AI-driven technology to deliver personalized customer experiences through precise marketing efforts, which lead to increased conversion rates and more customers returning to make additional purchases.
- The business achieves a higher market share through increased user acquisition, which helps maintain profitability over extended periods.
- The Meesho statistics demonstrate that the company operates a consumption engine that grows through data-driven optimization (source: company filings; Sensor Tower Q3 FY26 rankings).
Meesho Segmented Results
(Source: meesho.com)
- Meesho’s current nine-month financial report and most recent quarterly financial report show that the company currently operates a platform that develops its scale but needs to solve its upcoming profitability challenges.
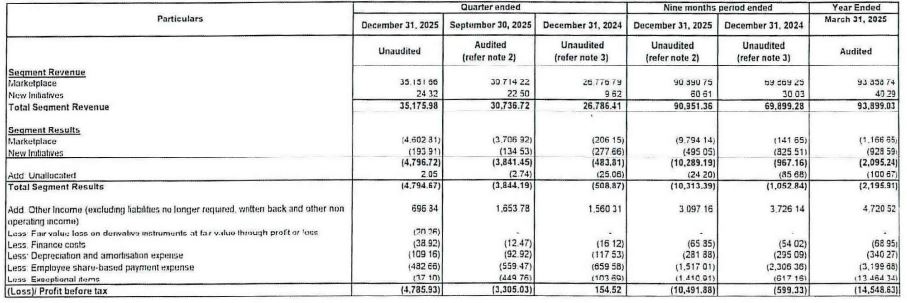
- The segment achieved total revenue of approximately ₹35,175.98 million for the quarter, which ended on December 31 2025.
- The segment showed strong revenue growth when compared to last year’s same quarter, which recorded revenue of ₹26,788.41 million.
- The segment results showed a total loss of ₹4,794.67 million because the company continued to make heavy investments.
- Marketplace revenue maintains its role as the primary revenue driver for the company at present because new business ventures currently result in financial losses, which happen during expansion periods.
- The Meesho statistics present an efficiency tradeoff for analysts because they show how the company tries to balance two objectives, which involve expanding its operations.
- The company shows strong revenue growth, but its customer acquisition expenses and operational costs have increased, resulting in lower contribution margins.
- Management demonstrates its commitment to disciplined capital allocation through its efforts to balance between other income and cost reduction initiatives.
- Meesho statistics show that the company concentrates on expanding its market share in India’s value-commerce sector instead of focusing on immediate profit generation.
- The company will experience substantial operating leverage growth during the next few fiscal periods because revenue maintains a 25 to 30 % annual growth rate and fixed costs return to normal levels.
Meesho Liquidity Strength
- The company’s financial results display strong performance because Meesho achieved a cash balance of ₹7,277 crores on December 31, 2025, which included ₹4,088 crores from its IPO that took place in December of FY26.
- The Last Twelve Months Free Cash Flow to Equity reached ₹437 crores because the company operated its asset-light marketplace model while maintaining a working capital cycle that produced negative results.
- The Meesho financial data show that the company maintains effective cash control systems, although its net losses have increased during the last three months.
- The recovery of logistics costs, together with platform growth and advertising revenue generation, represents the key elements that will help the company achieve its target for improved profitability, according to analysts.
- The company expects its Adjusted EBITDA margins to return to their Q1 FY26 levels within two quarters because of its operational growth and efficiency improvements.
- The Meesho financial data shows that the company has moved from its previous pattern of extensive investment toward moderate increases in profitability (source: company financial disclosures, FY26).
Meesho Seller Expansion And AI Integration
- Meesho experienced its fastest ecosystem growth during the third quarter of fiscal year 2026 because its Annual Transacting Sellers reached 846000, which represented an 81 % increase from the previous year, according to company disclosures.
- The onboarding process became more efficient, together with better product discovery methods and stronger market presence in Tier II through Tier IV areas.
- Meesho Mall gained established brands like Dabur as partners, which helped build its reputation and expand its offerings within the value-commerce market.
- The Meesho statistics demonstrate how the platform has expanded its supply network, which results in better product selection and more competitive pricing for customers.
- AI integration has emerged as an essential technological factor that distinguishes companies from their competitors.
- The company reported that 63% of customer support queries are now resolved end-to-end by AI, improving efficiency and response quality.
- Users who speak regional languages experience better results because of improved AI voice search capabilities.
- The Meesho statistics show that the company operates with automated systems, which reduce operational expenses while using data analysis to create sustainable revenue growth, according to analyst assessments of company filings and Q3 fiscal year 2026 updates.
Logistics Scale-Up Weighs On Margins
- Meesho achieved 2.3% contribution margin during Q3 of FY26, which represented a decrease of 104 basis points when compared to the previous quarter and a decline of 198 basis points when measured against the same quarter of the previous year, according to company reports.
- The quarter experienced temporary efficiency problems, which included routes that were not fully used and delivery points that were repeated and longer-than-normal delivery distances, that were longer than normal which resulted in a margin decline of approximately 1% age point.
- Analysts interpret these Meesho statistics as evidence that investment expenses create margin pressure instead of actual cost increases, which show ongoing structural growth.
- The company will achieve a recovery within two quarters by implementing node rationalization and route improvement.
- Operating leverage will help restore contribution margins to their former levels if execution follows the planned guidance.
- The Meesho statistics present evidence that the company is building its strategic infrastructure to enhance both its fulfillment capabilities and cost control methods, which will support its operations over the long term, according to Q3 FY26 financial disclosures.
GMV Outperformance Signals Market Share Acceleration
(Source: meesho.com)
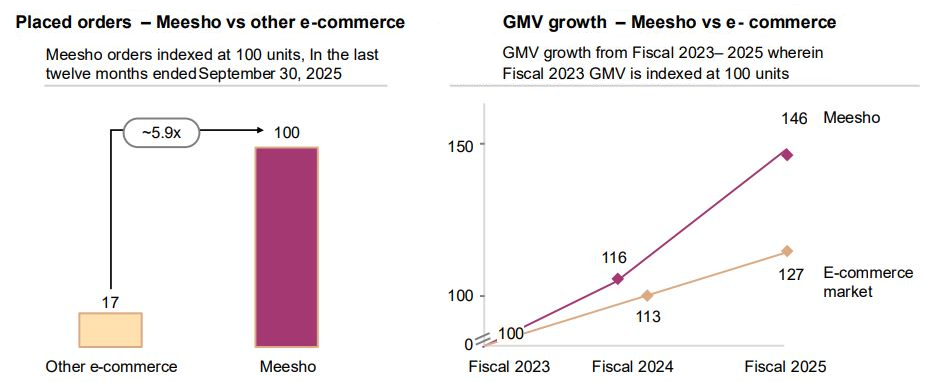
- The indexed GMV comparison shows that Meesho achieved more success than the entire e-commerce market.
- The base index for Fiscal 2023 starts at 100, which Meesho achieved as its GMV index when it reached 116 in FY24 and 146 in FY25.
- The overall e-commerce market experienced lower growth, which brought it to 113 in FY24 and 127 in FY25. Meesho expanded its business operations by 46% during two years while the market experienced a 27% growth (source: company investor presentation, FY25).
- The chart shows Meesho’s business operations reach approximately 5.9 times the scale of its smaller e-commerce competitors, according to an indexed comparison, which shows Meesho’s superior performance in value commerce.
- Meesho statistics show analysts that the company maintains market share through its expansion efforts into Tier II to IV markets, which help it compete effectively on pricing while expanding its supply capacity.
- The widening growth gap shows that structural momentum drives growth instead of temporary cyclical improvements.
- The Meesho statistics show the platform experiences faster growth than the industry standard, which builds its long-term market leadership position.
Meesho Average Order Value
- Meesho operates with the lowest Average Order Value (AOV) among scaled Indian e-commerce players for the twelve months ended September 30, 2025, yet commands the highest shipment share at 29–31% of total non-hyperlocal e-commerce shipments in Fiscal 2025, according to company disclosures.
- The high-frequency mass-market model between the two products shows different results because one product offers affordable prices, while the other product delivers fast product delivery.
- Meesho achieved cost savings for seller sales through its commission system, fulfillment process, and platform expenses, which excluded advertising costs because these expenses were 35 to 61 % lower than typical expenses found in the industry.
- Meesho established a major achievement through its August 2021 launch of zero % commission for unbranded sellers, which made it the first Indian e-commerce business to reach 1 billion US dollars in gross merchandise value through this operational method.
- Meesho statistics show an analyst-tested disruptive approach that builds its business through low average order value operations that create shipping power.
- The operational leverage of Meesho operates through two main aspects, which include cost leadership and supply democratization, according to the company’s financial statements from fiscal year 2025.
Challenges and Competitive Landscape
- The company faces ongoing structural problems because India maintains a highly competitive e-commerce market, which develops through its current business expansion, as demonstrated by recent Meesho performance data.
- The company needs to increase its shipment volume between 29 and 31 % because its current gross merchandise value falls behind market leaders Amazon and Flipkart because of its low average order value and restricted access to high-end products.
- The company needs to expand its margins, but it faces challenges because both logistics operations and marketing activities drive up its business expenses.
- The Indian digital retail market operates through multiple independent channels, which forces existing businesses to use aggressive pricing methods in order to gain both seller and consumer dedication.
- The ability to maintain affordable prices while increasing contribution margins will determine the company’s future viability, according to analysts.
- The Meesho statistics demonstrate strong growth potential, but the company needs to maintain profitability standards to achieve sustainable success.
Conclusion
The company Meesho has become an essential component of Indian e-commerce operations, which will continue until the year 2025. The company drives its operations through a user base that exceeds 250 million active shoppers and handles billions of yearly orders while maintaining a central position in the upcoming online shopping expansion. The challenges of making profits and dealing with strong competition and complex logistics operations continue to exist, but Meesho successfully operates its business model, which combines high-volume sales with affordable prices through artificial intelligence technology to match the demands of Indian customers who are becoming more digital.
The company uses innovative technology to create a unique market advantage because it provides equal opportunity access and cost reduction, and establishes digital commerce links with smaller businesses. The data from 2025 shows more than mere numbers because it demonstrates how digital access expands to empower different regions, while micro-transactions create new retail patterns that will shape future commerce in India and other parts of the world.
FAQ
Meesho announced its Q3 FY2025–26 results in the quarter ending December 31, 2025, as per its quarterly financial disclosures.
In Q3 FY26, Meesho reported ₹35.20 billion in revenue (31% YoY growth), NMV of ₹10,995 crores (26% YoY growth), and a net loss of ₹4.90 billion, with a contribution margin at 2.3%.
Meesho has 251 million annual transacting users as of Q3 FY26, reflecting 34% year-on-year growth.
Meesho generated ₹35.20 billion in revenue for Q3 FY26, which represents a 31% growth from the previous fiscal year Q3 results.
Meesho focuses on affordable, value-driven products targeting Tier II–IV markets, prioritizing high shipment volume and frequency over premium pricing, which results in a structurally lower AOV.
