


Introduction
Product Launch Statistics: The year 2025 has become a remarkable time for product introductions, which exist across various sectors that include consumer products and technology startups, as well as digital retail and software as a service businesses. The combination of advanced analytics and AI-driven launch tools, together with changes in consumer behavior, enables companies to develop new products at an unprecedented speed.
The evidence shows that more than 30,000 new consumer items entered international markets in 2025, demonstrating how quickly modern innovation develops. Businesses need to understand these patterns together with their numerical data because this knowledge will help them achieve success in 2026. This article will present product launch statistics and their trends.
Editor’s Choice
- The world saw more than 30000 new consumer items enter the market during 2025.
- The number of global social media users reached 4.41 billion in 2025, which represents a 54% increase since 2017.
- The first quarter of the year sees SaaS launch activity reach its highest point at 28% while enterprise software achieves its peak at 35% during the same period.
- The third quarter sees consumer apps achieve their highest performance level at 32%, which results from seasonal demand patterns.
- Social media usage exists among 89% of founders, yet 31% of them believe it serves as their most powerful tool.
- Early access emails produce superior results to standard launch emails because they achieve 42.1% open rates and 8.4% CTR.
- After one year of product launch, only 11% of customers maintain their active status.
- Only 20% of new products survive beyond two years.
- The product launch process results in 60% of products achieving revenue generation, while 40% of products remain inactive for commercial purposes.
- The process requires 28 weeks to achieve 75% distribution of the product.
Product Launch On Social Media
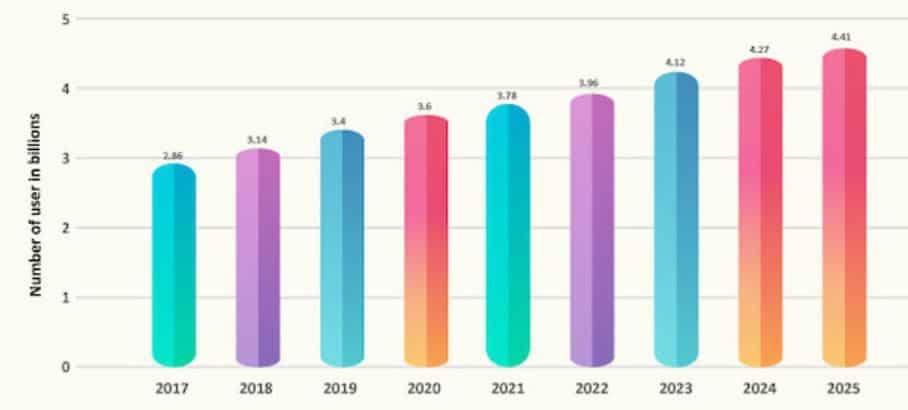
(Source: sketchbubble.com)
- The current product launch statistics show that global social media adoption continues to grow because of its upward trajectory.
- User numbers climbed from approximately 2.86 billion in 2017 to 3.6 billion in 2020, and projections indicate growth to 4.41 billion by 2025.
- Digital audience growth reached 54% during the eight-year period because more than 1.5 billion users joined the internet.
- Marketing models required businesses to spend multiple million dollars on media purchases for access to hundreds of millions of customers.
- Social platforms today enable users to reach billions of people at lower costs than before. The audience shows consistent growth because it adds around 200 million to 300 million new users each year.
- The product launch statistics show that brands need social media as their fundamental system. The system expansion provides brands that synchronize their launch schedule with influencer partnerships and paid media with the ability to reach more customers.
Seasonal Performance Patterns Across Product Categories
- Product launch statistics show different performance results for various categories because of the impact of quarterly timing.
- SaaS products show balanced launch distribution across all quarters because Q1 accounts for 28% of successful launches, while Q3 follows at 26%. Q4 drops to 22% because of holiday distractions and procurement slowdown activities.
- The back-to-school period, together with increased digital usage, drives Q3 to achieve its highest percentage of 32%.
- Q2 and Q4 each capture 25%, while Q1 lags at 18%, which most likely results from post-holiday spending fatigue.
- The first quarter accounts for 35% of successful launches because organizations begin their new fiscal year and release their IT spending for the upcoming year.
- The rate of progress decreases to 15% during the fourth quarter when organizations implement their budget restrictions.
- The product launch statistics show that companies must adjust their timing strategy according to the psychological patterns of buyers and the financial spending cycles.
- The success rates of modern product launches depend on the calendar alignment, which can produce a success rate variation of 20%.
Data-Driven Marketing For High-Impact Product Launches
- The current statistical data on product launches shows a distinct difference between common marketing channels and those that produce actual measurable results.
- While 89% of founders rely on social media, only 31% rank it as their most effective channel, which shows the difference between social media usage and actual business results.
- Product Hunt helps 34% of tech startups to succeed, which shows that it has an undeserved impact because of its restricted user base.
- Although 76% of teams use email, 28% report it as their top-performing channel.
- The performance metrics show that early access campaigns achieve an exceptional 42.1% open rate, together with an 8.4% click-through rate, which exceeds standard launch announcements that produce 24.3% open rate and 3.2% click rate.
- The platform-level engagement data, together with the platform-level engagement data, creates new strategic directions for the company.
- LinkedIn operates as a B2B powerhouse because it achieves a 67% reach rate with 4.2% engagement.
- TikTok and Reddit show the highest engagement rates because their niche communities and algorithm-based communities attract more active users than their larger competitors.
- The business world shows that companies use paid advertising as their primary marketing method, with an 82% adoption rate, yet only 24% of businesses view it as their most efficient strategy, which indicates that advertising effectiveness decreases after reaching a certain point.
- The product launch statistics require precise execution because they show which elements need to be present.
- The product launch statistics of today demonstrate that businesses can achieve double-digit conversion rate increases through proper channel management.
Post-Launch Retention Realities And Content Strategy Gaps
- The most revealing product launch statistics emerge after the initial excitement fades. The initial traction of a product launch generates media coverage, which creates a more challenging situation because only 11% of new product consumers stay engaged with the product after 52 weeks.
- The product market shows high fragility because only 20% of new products maintain their existence after two years.
- Research shows that 77% of buyers expect different content at each stage of their decision journey; however, 47.9% of product marketers do not have a professional sales enablement team.
- The product launch statistics show that businesses need to maintain customer relationships after acquiring new customers because this model does not work financially.
- The organization needs three elements to achieve continuous development, which are lifecycle marketing, iterative development, and specific marketing methods.
- The success rate for North America stands at 43%, while Europe shows 39% success, and Asia-Pacific achieves a 36% success rate.
- The American market remains the main validation market because 67% of worldwide product launches start from the United States.
- The data shows that websites with localized content achieve 34% more customer interaction, while websites using local payment systems achieve 28% more successful transactions.
- The power of cultural adaptation leads to 52% better customer retention because it represents the most effective method to drive post-launch success, according to modern product launch statistics.
- Mid-sized markets between USD 100 million and USD 1 billion achieve the highest success rate because they reach 47% success, which exceeds the 31% success rate of billion-dollar markets that face market saturation.
- “Blue ocean” environments present a 67% success rate while highly competitive business sectors achieve only 24% success.
Product Launch Revenue Realities And Distribution Timelines
- The current product launch data shows a major performance gap between the time products enter the market and the time products achieve financial success.
- The 60% of products that reach retail stores and online platforms created revenue streams, while the rest remained nonproductive.
- The revenue gap shows that businesses need to improve their pricing methods, demand assessment, and brand strategy.
- In performance modelling, the first actual proof of product-market fit occurs when a product reaches the revenue threshold, which exists beyond normal product accessibility.
- New products need about 28 weeks to achieve 75% of their full distribution capacity.
- The 7th month period of ramping up operations demonstrates the various structural obstacles that exist during the scaling process because it involves three different areas of operation, including logistics, channel partnerships, and marketing activities.
- The organization must slow down its operations because rapid product launches will create more risks to business operations than they will help its enterprise function.
- The product launch statistics demonstrate that success requires companies to follow a particular order of operations.
- Businesses need to understand that their product visibility does not automatically create profits, while their product distribution will develop over time.
- The revenue activation element, together with the controlled scale element, will establish sustainable growth according to complete product launch statistics.
Tools And Resources For Product Launches
- The success of product launches depends on the quality of their pre-release and post-release launch statistics, which companies gather during both these periods.
- Google Analytics and Mixpanel track user behavior through their tools, which measure traffic sources, conversion rates, and feature adoption.
- Strategic decision-making becomes clearer through advanced tracking systems, which provide better data.
- UTM parameters enable precise campaign ROI distribution while conversion funnels display customer exit points, and cohort analysis shows retention rates throughout different periods.
- Structured funnel optimization techniques enhance conversion rates by 15 to 25 % across multiple data sets.
- Attribution modelling enables businesses to determine which marketing channels drive actual revenue growth instead of merely creating brand visibility.
- Organizations can use SimilarWeb, App Annie, and Google Trends as benchmarking tools to create a competitive landscape that helps them connect their market forecasts with current industry conditions.
- The product launch statistics enable organizations to evaluate market uncertainty through their measurement of specific results.
- Modern product launch statistics focus on creating a system that uses data to enhance launch outcomes through ongoing improvement efforts.
Conclusion
Product Launch Statistics: Product launches in 2025 are defined by three main factors. The market sees thousands of products launch each year, yet their survival depends on four critical factors. Social media usage enables wider audience access, yet the actual customer growth process requires effective methods to keep users. Success rates experience double-digit changes according to seasonal patterns, while localized approaches boost both user engagement and purchase rates.
Only 60% of businesses create revenue streams, while only 20% of businesses survive beyond their second year. Companies now need to demonstrate their product launch success through measurable customer acquisition and the ability to grow their customer base and create value for customers over time.
FAQ
The market introduced more than 30000 new consumer products.
About 60% of product launches create revenue streams.
The process takes about 28 weeks to complete.
Only 20% of products succeed in remaining active after two years.
Q1, with 28% of successful launches.
Q3, which accounts for 32% of successful launches.
The system achieves an open rate of 42.1% together with an 8.4% click-through rate.
Only 11% of customers continue to use the service after 52 weeks.
