


Introduction
Promotional Product Statistics: Brands require affordable methods to increase brand visibility, develop customer bonds, and achieve sustainable brand recognition in today’s competitive marketing environment. The most effective marketing instrument for organizations to accomplish their objectives exists in promotional products, which people refer to as branded merchandise. Companies worldwide use custom pens, tote bags, drinkware, and eco-friendly accessories to establish their brand identity and engage customers.
Unlike digital advertisements that vanish from screens in seconds, the physical permanence of promotional merchandise provides continuous brand exposure. Promotional Product Statistics 2025 demonstrate that this traditional marketing method maintains its effectiveness through all periods of digital advertising development. The promotional products industry demonstrates its strength through ongoing market presence, which continues to function in contemporary marketing approaches.
Editor’s Choice
- The global promotional products industry reached USD 27.8 billion in 2025, continuing a steady long-term growth trend.
- Consumers keep promotional drinkware products because 63% of them retain these items, which makes drinkware the most long-lasting promotional product type.
- The strong daily exposure of the brand results in 62% retention for both calendars and polo shirts.
- The promotional outerwear products provide 7,856 permanent brand impressions.
- Approximately 85% of consumers can recall the brand that provided them with a promotional item.
- The 66% of recipients who received a promotional item during the past 12 months can remember the brand name.
- The 83% of consumers who receive corporate promotional gifts develop a stronger relationship with the brand.
- 54% of U.S. consumers choose promotional products that American manufacturers produce because they prefer domestic goods.
- The majority of consumers, approximately 80%, will pay extra for branded merchandise that companies produce in an environmentally friendly manner.
- The promotional pens, which create 2,436 brand impressions, show that inexpensive products provide substantial advertising benefits.
Promotional Product Retention Trends And Consumer Loyalty Insights
| Product | Retention Rate |
| Drinkware | 63% |
| Calendars | 62% |
| Polo Shirts | 62% |
| Outerwear/Fleece (2+ years) | 61% |
| Performance Wear | 59% |
| Desk Accessories | 58% |
| Headwear | 56% |
| Umbrellas (2+ years) | 54% |
| Pens | 52% |
| Power Banks (2+ years) | 51% |
| T-Shirts (2+ years) | 47% |
| USB Drives (2+ years) | 44% |
| Bags (2+ years) | 43% |
| Health Products | 36% |
(Source: brandelity.com)
- The analysis of promotional product data by Promotional Products Association International (PPAI) demonstrates that branded merchandise displays specific time periods during which it remains functional and visible to customers.
- The retention chart shows that drinkware products lead with 63% retention, whereas calendars and polo shirts follow with identical 62% retention results, which demonstrates that customers prefer to use their daily items for extended periods.
- The outerwear and fleece product category achieves 61% retention, while performance wear shows 59% retention, which demonstrates that customers use promotional clothing to promote brand awareness.
- Desk accessories record 58% retention, and headwear stands at 56%, showing moderate longevity in daily environments.
- The retention rate for utility-based products like umbrellas reaches 54%, while writing instruments such as pens maintain a 52% retention rate, which makes them one of the most common advertising materials used by businesses.
- Technology-related items like power banks retain 51%, but T-shirts fall to 47%, suggesting shorter product life cycles.
- USB drives and bags record 44% and 43% retention, respectively, while health products show the lowest retention at 36%.
Promotional Products Market
| Year | Promotional product industry market size |
| 2011 | $17.7 billion |
| 2012 | $18.5 billion |
| 2013 | $19.8 billion |
| 2014 | $20 billion |
| 2015 | $20.8 billion |
| 2016 | $21.3 billion |
| 2017 | $23.3 billion |
| 2018 | $24.7 billion |
| 2019 | $24.2 billion |
| 2020 | $19.6 billion |
| 2021 | $22.1 billion |
| 2022 | $25.5 billion |
| 2023 | $26.1 billion |
| 2024 | $26.98 billion |
| 2025 | $27.8 billion |
(Source: sellerscommerce.com)
- The promotional product industry by the Advertising Speciality Institute (ASI), experienced continuous growth, which experienced only a temporary decline during the pandemic.
- The market size reached USD 17.7 billion in 2011 and experienced a steady growth to USD 20 billion by 2014 because businesses increased their demand for branded merchandise used in marketing activities.
- The industry maintained its growth trend until it achieved a value of USD 24.7 billion in 2018 before experiencing a minor decline to USD 24.2 billion in 2019.
- The market experienced its most significant decline in 2020 when it fell to 19.6 billion because pandemic-related disruptions stopped events, conferences, and corporate promotions.
- The recovery process unfolded at a rapid pace. Post-pandemic demand drove market growth, which reached USD 22.1 billion in 2021 and progressed to USD 25.5 billion in 2022.
- The market maintained its upward trend, which brought USD 26.1 billion in 2023 and USD 26.98 billion in 2024.
- The promotional merchandise market reached approximately USD 27.8 billion in 2025 as organizations show constant market growth.
- The promotional product industry statistics show an upward trend, which results from companies using branding strategies to enhance corporate marketing and engage customers with their products.
- Promotional products, through their distribution to potential customers, help businesses to build brand recognition and develop lifelong customer relationships.
Promotional Merchandise Impact On Brand Awareness
- The promotional product industry demonstrates through its statistics that businesses use branded products, which help them to build both brand recognition and customer relationships.
- Companies increasingly distribute promotional products, which include trade show materials, conference merchandise, and corporate gifts, to reach new customers while they strengthen their bonds with current clients.
- The global promotional product statistics show that 85 % of people remember the brand that gave them a promotional gift because physical products create enduring impressions.
- The study shows that 66 % of consumers remember the brand name that appeared on a logoed item they received during the last 12 months because common products such as umbrellas, headwear, and wearables provide customers with ongoing brand visibility through their daily usage.
- Promotional merchandise creates customer awareness, which develops into stronger emotional ties with customers.
- The surveys show that 83 % of people who receive corporate gifts feel closer to the company that gave them the gift because it helps them build trust and loyalty.
- The promotional product statistics from marketing analytics research show that practical branded items create over one million social media impressions while serving as permanent brand ambassadors, which help businesses achieve enhanced brand recognition and customer engagement in battle with their market rivals.
U.S. Promotional Products Sales
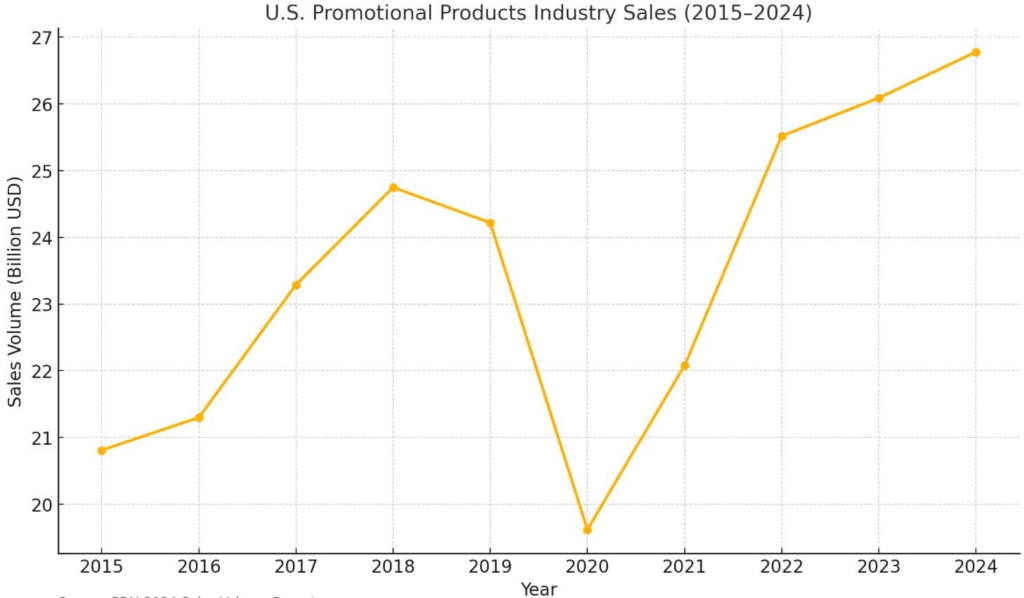
(Source: perfectimprints.com)
- The promotional products industry shows a growing trend that experiences a short break before returning to its previous rate of growth.
- The U.S. promotional products market grew from USD 20.8 billion in 2015 to USD 24.7 billion in 2018 because businesses showed constant demand for branded merchandise, which they used to promote their products and marketing initiatives.
- The market recorded a small decrease to USD 24.2 billion in 2019 before it experienced a major decline to USD 19.6 billion in 2020 because the pandemic caused interruptions to events and trade shows, and marketing expenditures.
- The sales reached USD 22.1 billion in 2021 before they increased to USD 25.5 billion in 2022, which shows that businesses resumed spending money on brand visibility methods.
- The promotional products market maintained its upward trend, which reached USD 26.1 billion in 2023 and USD 26.8 billion in 2024, because it grew almost 29 % since the 2020 market decline.
- The promotional products industry is experiencing a growth period, which leads to fresh developments and innovative ideas that will extend until 2025.
- Distributor sales in the U.S. reached USD 27.8 billion during 2025, which marks a continuation of the annual growth pattern that has persisted for the past ten years with a rate of approximately 2.8%.
- After the pandemic situation improved, 65 % of distributors forecasted that their business would expand throughout 2025.
Tech-Driven Evolution In The Promotional Products Industry
- The promotional products industry shows a major shift toward digital merchandising because 45% of end-buyers choose promotional products that offer app and QR code and online connection capabilities.
- The popularity of giveaways that use technology as their foundation continues to rise. The most popular branded products in 2025 included Bluetooth trackers, wireless chargers, smart notebooks, and UV sanitizers.
- ASI data shows Power Banks have a 51% retention rate, and USB drives sit at 44% retention rate according to promotional products industry statistics, because recipients maintain and utilise these assets for a more extended period, which results in increased brand visibility.
- Approximately 80% of corporate buyers display interest in AR/VR product previews because augmented reality and scannable QR codes enable basic promotional items to become interactive brand experiences that foster stronger customer relationships.
- The process of digital transformation creates new distribution methods for businesses. APPAI’s official 2025 data notes that online sales accounted for roughly 26.3% of total industry sales volume, which results in distributors needing to develop e-commerce stores, automated fulfillment systems, and on-demand ordering systems to achieve faster deliveries and better product customization options.
- The process of data-driven engagement has developed into a significant innovative development for businesses.
- RFID-enabled promotional products used at events created a 92% attendee interaction rate because technology integration enables brands to use giveaways as effective marketing tools.
Consumer Attitudes Toward Promotional Merchandise
- The current promotional products market research demonstrates that branded merchandise functions as the most efficient method for achieving brand visibility and building enduring marketing recognition.
- The public connects promotional product quality and usefulness to the brand reputation that provides those products.
- At the same time, practicality plays a major role in retention—65% of consumers keep promotional items because they find them useful in everyday life.
- Another important insight from promotional products industry statistics shows that 54% of U.S. consumers prefer promotional items made in the USA, highlighting a growing interest in locally manufactured goods.
Outerwear – The Most Influential Promotional Product Category
- The promotional products market shows T-shirts as a popular product, but outerwear now produces a greater marketing impact than T-shirts.
- The brand visibility of jackets, hoodies, and fleeces extends because these items people will use throughout multiple seasons.
- The research demonstrates that 41% of Americans who receive promotional outerwear are more likely to do business with the advertiser, which shows its strong ability to attract customers.
- The 61% of consumers who maintain and use promotional outerwear for two years or more create ongoing advertising value, which benefits brands.
- According to the ASI Global Ad Impressions Study, the outerwear products generate 7856 brand impressions, which makes them one of the most effective promotional products for the market.
- The companies that purchase premium branded outerwear products achieve higher brand recognition, together with better customer retention results.
Health-Focused Promotional Products And Consumer Well-Being
- Health-related promotional merchandise has gained traction as companies seek to demonstrate care for customers’ well-being.
- The promotional products industry statistics show that women consider health products, which include wellness kits, sanitizers, and fitness accessories, to be the second most effective promotional category.
- The products show an effect on purchasing behavior since 26 % of customers who obtain a promotional health product will show increased intent to purchase from the company that provided the product.
- About 36 % of Americans maintain and use their promotional health products for one year or more, which results in 640 brand impressions throughout the product’s complete lifespan.
- The items create less brand exposure than apparel and outerwear products do, but their emotional and relational effects strengthen customer trust and brand loyalty.
Office Supplies – Functional Tools That Reinforce Brand Presence
- Office supplies that companies give away as promotional items continue to attract users because people need these products for their work activities.
- Americans retain their promotional desk accessories for one year or longer, resulting in 58% of users maintaining their promotional desk accessories.
- The branded desk accessory usage leads to 24 % of customers showing increased intent to purchase from the company that provided the product, thus showing that basic office equipment can shape customer brand views.
- The marketing value of writing instruments remains strong because 30% of customers who receive promotional pens from a brand will show an increased likelihood of purchasing from that brand.
- According to the ASI Global Ad Impressions Study, the pens create approximately 2436 brand impressions because they demonstrate how low-cost items can achieve extensive advertising exposure.
Drinkware And Sustainable Promotional Products
- Drinkware remains one of the most frequently used promotional categories due to its everyday functionality.
- 30% of Americans who receive promotional drinkware are more likely to do business with the advertiser, while 63% keep and use these items for at least one year.
- According to the ASI Global Ad Impressions Study, drinkware products create approximately 3162 brand exposures, which makes them one of the most prominent advertising items that businesses distribute to the public.
- The importance of sustainability as a choice for consumers has risen to become an essential element for their purchasing decisions.
- Research indicates that 62% of consumers actively seek eco-friendly products, and 80% are willing to pay more for sustainably produced goods.
- The U.S. consumer base shows 46% of people who think better of businesses that give out environmentally friendly promotional products, while 84% of people believe that companies with poor environmental policies will lose their positive image.
- The data demonstrates how businesses can use eco-friendly promotional products to enhance customer loyalty while meeting the preferences of contemporary consumers.
Cost Per Impression (CPI) – The True ROI Of Promotional Products
| Advertising medium | Typical unit cost or spend basis | Impressions generated | Approximate CPI (cost per single impression) | Approximate CPM (cost per 1,000 impressions) |
| Outerwear/fleece (ASI) | USD 15–25 per item | 7,856 lifetime impressions. | USD 0.002–0.003 | USD 2–3 |
| Super‑soft T‑shirt (ASI) | 10 per shirt | 5,053 lifetime impressions. | USD 0.002 (1/5 of a cent) | USD 2 |
| Headwear/baseball cap (ASI) | USD 8 per cap | 3,380 lifetime impressions.l | < USD 0.0025 (< 1/4 of a cent) | < USD 2.50 |
| Insulated travel mug (ASI) | USD 10 per mug | 3,162 lifetime impressions. | ~0.0032 (1/3 of a cent) | USD 3.20 |
| Non‑woven tote bag (ASI) | USD 2 per bag | 1,940 lifetime impressions. | USD 0.001 (1/10 of a cent) | USD 1 dollar |
| Metal pen (ASI) | USD 1 dollar per pen | 2,436 lifetime impressions.l | < USD 0.001 (< 1/10 of a cent) | < USD 1 dollar |
| Display ads (programmatic) | CPM‑based buy | 1,000 per CPM unit | USD 0.002–0.010 | USD 2–10. |
| Google Display Network | CPM‑based buy | 1,000 per CPM unit | USD 0.011 | USD 11.12. |
| Facebook / Instagram ads | CPM‑based buy | 1,000 per CPM unit | USD 0.006–0.015 | USD 6–15. |
| Google Search ads | CPC‑based buy (avg. CPC USD 0.73–1.31 ) | ~1,000 impressions yield ~15–66 clicks at 1.5–6.6% CTR. | USD 0.011–0.018 | USD 11–18 |
| Connected TV (CTV) ads | CPM‑based buy | 1,000 per CPM unit | USD 0.020–0.040 | USD 20–40. |
Generational Preferences – Gen Z Vs. Millennials
| Dimension | Gen Z (born 1997–2012) | The company sells sustainable lifestyle products together with apparel, which makes up 63% of their sales, and fashion accessories, 57% | Gen X & Boomers (born before 1981) |
| Top product preferences | The company sells sustainable lifestyle products together with apparel, which makes up 63% of their sales and fashion accessories, 57% | Apparel (62%), office supplies (41%), drinkware (40%), and eco‑friendly workplace items. | High‑quality outerwear, functional drinkware, office tools, desk accessories, and traditional pens. |
| Sustainability importance | Social responsibility holds vital importance for 100% of ASI members, while 89 to 90% of members consider environmental friendliness as important, and 84% of ASI and PPAI members choose to buy socially responsible products. | Over 80% prioritize environmentally friendly products; sustainability is an expectation rather than a differentiator. | Sustainability matters, but is secondary to quality, durability, and domestic manufacturing. |
| Personalization and quality | Customers who want customized solutions spend 85% more than the average customer, who spends 39%. The three main factors that keep customers loyal to the brand include 80% product quality, and 70% product utility, and 70% product attractiveness. | Value brand awareness (93% say promo enhances it); appreciate retail‑quality but are less focused on personalization. | Prioritize utility and longevity; “Made in USA” matters significantly (>80%).custom. |
| Brand perception impact | 68%of people believe promotional activities create a positive effect on their brand perception, while 63% of people make purchase decisions based on promotional activities, and 51% of people follow brands to receive merchandise or participate in giveaways. | 93% believe promo products enhance brand awareness among Gen Z. | Positive but quieter brand response; value function over brand storytelling or social sharing. |
Conclusion
Promotional Product Statistics 2025 clearly demonstrate that branded merchandise remains a powerful and effective marketing tool in the modern business landscape. With the global market valued at tens of billions of dollars and expected to grow steadily over the next decade, promotional products continue to deliver strong brand visibility, high consumer recall, and impressive return on investment. From traditional items like pens and apparel to innovative tech accessories and sustainable merchandise, promotional products play a crucial role in connecting brands with consumers.
As businesses increasingly integrate promotional merchandise into digital marketing strategies and adopt eco-friendly solutions, the industry is poised for continued growth and innovation. Ultimately, promotional products will remain a cornerstone of marketing strategies worldwide, helping brands create lasting impressions and meaningful relationships with their audiences.
FAQ
The promotional products industry reached approximately USD 27.8 billion in 2025 because the branding and marketing needs of businesses continued to grow.
Promotional drinkware leads with a 63% retention rate, while calendars and polo shirts follow at 62% retention rate.
Yes. About 62% of consumers choose sustainable promotional items, while 80% are ready to spend additional money on eco-friendly products.
Promotional merchandise creates thousands of lifetime impressions because outerwear produces 7,856 impressions, which cost less per impression than most digital advertising methods.
