


Ross Stores delivered a blowout fourth quarter, posting diluted EPS of $2.00 (vs. guidance of $1.77-$1.85 and analyst estimates of $1.88) on revenue of $6.64 billion (+12% YoY), with comparable store sales surging 9%. Shares initially dipped 2.3% after hours before rallying ~6% the following session on strong FY2026 guidance.
About Ross Stores
Ross Stores, Inc. (NASDAQ: ROST) is the largest off-price apparel and home fashion retailer in the United States. Headquartered in Dublin, California, the company was originally founded in 1950 by Morris Ross as a department store, then transformed into the off-price retail format in 1982 when a group of investors pivoted the business model. Ross went public on the NASDAQ in 1985.
The company operates two banners: Ross Dress for Less (1,904 stores across 44 states, DC, Guam, and Puerto Rico) and dd’s DISCOUNTS (363 stores in 22 states), totaling 2,267 locations as of January 31, 2026. Ross offers first-quality, in-season, brand-name and designer merchandise at savings of 20%-60% off department and specialty store regular prices.
| Key Metric | Value |
| Ticker / Exchange | ROST / NASDAQ |
| Market Cap | ~$68.5 billion |
| P/E Ratio (TTM) | ~30.7x |
| Forward P/E | ~26.0x |
| Dividend Yield (TTM) | 0.77% |
| Employees | ~107,000 |
| CEO | Jim Conroy (since Feb 2025) |
| CFO | William (Bill) Sheehan |
| FY2025 Revenue | $22.8 billion (record) |
Top Financial Highlights
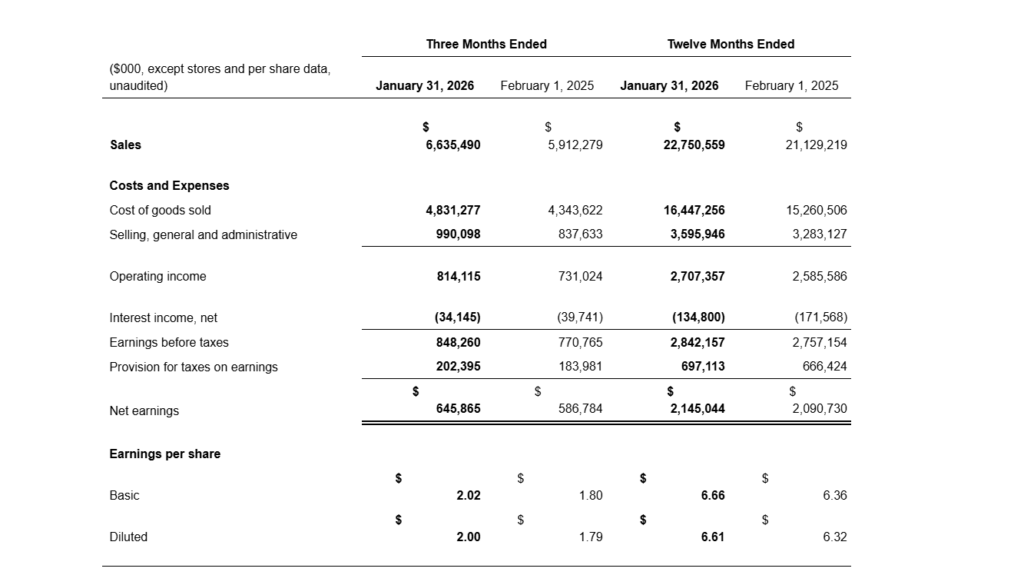
- Total revenue in Q4 reached $6.64 billion, representing a 12% increase from $5.91 billion in the prior-year quarter, reflecting strong consumer demand.
- Comparable store sales increased 9% in Q4, primarily driven by higher transaction volumes and customer traffic, following a 3% gain in the previous year period.
- Diluted EPS in Q4 was $2.00, exceeding the company’s guidance range of $1.77 to $1.85 and analyst consensus of $1.88. Excluding the $0.14 prior-year packaway facility gain, EPS growth reached 21% year-over-year.
- Net income in Q4 totaled $646 million, compared with $587 million in Q4 FY2024, reflecting improved profitability.
- Operating income in Q4 increased to $814 million, representing an 11.4% year-over-year improvement.
- Operating margin expanded to 12.3%, surpassing the company’s planned range of 11.5% to 11.8%. Excluding the prior-year 105 basis point packaway benefit, operating margin improved by 95 basis points.
- Cost of goods sold declined 65 basis points year-over-year, supported by occupancy leverage (+30 basis points), lower distribution and freight costs (+35 basis points combined), and merchandise margin improvement (+10 basis points).
- SG&A expenses in Q4 totaled $990 million, increasing 75 basis points as a percentage of sales due to the prior-year facility sale. Excluding that item, SG&A improved 30 basis points.
- Full-year revenue reached a record $22.8 billion, up 8% from $21.1 billion, indicating continued business expansion.
- Full-year EPS was $6.61, compared with $6.32 in the previous year. Adjusted for the facility sale and a $0.16 tariff impact, earnings grew 10% year-over-year.
- Operating cash flow for FY2025 totaled $3.03 billion, representing a 28% increase from $2.36 billion in the previous year.
- Free cash flow reached $2.21 billion, rising 35% from $1.64 billion, reflecting stronger cash generation.
- Cash on hand stood at $4.59 billion as of January 31, 2026, providing substantial liquidity.
- During Q4, the company repurchased 1.5 million shares for $262 million, completing its $2.1 billion two-year buyback program. A new $2.55 billion authorization has been approved, representing a 21% increase.
- The quarterly cash dividend was increased 10% to $0.445 per share, reinforcing the company’s commitment to shareholder returns.
Beat or Miss?
Ross Stores beat both its own guidance and Wall Street consensus estimates across all key metrics for the fourth quarter.
| Metric | Reported | Analyst Estimate | Difference |
| Diluted EPS | $2.00 | $1.88 (Zacks) | +$0.12 / +6.4% beat |
| Revenue | $6.64B | $6.38B (FactSet) | +$260M / +3.7% beat |
| Comp Store Sales | 9% | ~+3–4% (company guide) | Significantly above expectations |
| Operating Margin | 12.30% | 11.5%–11.8% (company guide) | ~50–80bp above plan |
| EPS vs. Own Guidance | $2.00 | $1.77–$1.85 | +$0.15 to $0.23 above |
What Leadership Is Saying?
CEO Jim Conroy – On Strategy & Performance
“We are pleased to report that business momentum accelerated further in the fourth quarter, with both sales and earnings significantly surpassing our expectations. Throughout the holiday season, we delivered compelling merchandise assortments to our stores, benefited from higher customer engagement through our new marketing campaigns, and executed in-store initiatives that enhanced the customer experience.”
“As we reflect on 2025, we are proud of the meaningful progress we made across the business, including advancing key initiatives to further drive topline growth, while improving our operational performance. As we move into 2026, we are encouraged by the strength of our business and confident in the strategic priorities we have set for the year.”
CFO Bill Sheehan – On Financial Performance & Margins
“Excluding the benefit last year, operating margin increased 95 basis points. Cost of goods sold was 65 basis points lower in the quarter. Occupancy leveraged by 30 basis points on strong sales results, while distribution and domestic freight costs declined by 20 and 15 basis points, respectively. Merchandise margin improved by 10 basis points.”
“For the 52 weeks ending January 30, 2027, we are forecasting same store sales to be up 3% to 4% and earnings per share to be $7.02 to $7.36 compared to $6.61 for fiscal 2025. Total sales are projected to be up 5% to 7% for the year… operating margin for the full year is expected to be in the range of 12.0% to 12.3% compared to 11.9% in 2025.”
Historical Performance
Ross Stores – Q4 FY2025 vs. Q4 FY2024
| Category | Q4 FY2025 (Jan 2026) | Q4 FY2024 (Feb 2025) | Change (%) |
| Total Revenue | $6.64B | $5.91B | 12.20% |
| Net Income | $646M | $587M | 10.10% |
| Diluted EPS | $2.00 | $1.79 | +11.7% (21% adj.) |
| Operating Income | $814M | $731M | 11.40% |
| Operating Margin | 12.3% | 12.4%* | -10bp (but +95bp adj.) |
| Comp Store Sales | +9% | +3% | +600bp improvement |
| SG&A | $990M | $838M | 18.20% |
| Store Count | 2,267 | 2,186 | +81 stores |
Ross Stores – Full Year FY2025 vs. FY2024
| Category | FY2025 | FY2024 | Change (%) |
| Total Revenue | $22.8B | $21.1B | 7.70% |
| Net Income | $2.15B | $2.09B | 2.60% |
| Diluted EPS | $6.61 | $6.32 | +4.6% (10% adj.) |
| Operating Cash Flow | $3.03B | $2.36B | 28.40% |
| Free Cash Flow | $2.21B | $1.64B | 34.90% |
Off-Price Competitor Performance
All three major U.S. off-price retailers reported their Q4 results for the fiscal year ending January 31, 2026. Ross Stores led in comparable store sales growth, while TJX dominated in scale and Burlington in margin expansion.
Q4 Comparison (Fiscal Year Ending Jan 2026)
| Metric | Ross Stores (ROST) | TJX Companies (TJX) | Burlington Stores (BURL) |
| Q4 Revenue | $6.64B | $17.7B | $3.65B |
| Revenue Growth (YoY) | +12% | +9% | +11% |
| Comp Store Sales | +9% | +5% | +4% |
| Net Income (Q4) | $646M | $1.8B | $310M |
| Diluted EPS | $2.00 | $1.58 (GAAP) / $1.43 (adj.) | $4.84 (GAAP) / $4.99 (adj.) |
| EPS Growth (YoY) | +21% (adj.) | +16% (adj.) | +21% (adj.) |
Full Year Comparison (FY Ending Jan 2026)
| Metric | Ross Stores (ROST) | TJX Companies (TJX) | Burlington Stores (BURL) |
| Annual Revenue | $22.8B | $60.4B | $11.6B |
| Revenue Growth | +8% | +7% | +9% |
| Comp Store Sales | +5% | +5% | +2% |
| FY Net Income | $2.15B | $5.5B | $610M |
| FY EPS | $6.61 | $4.87 (GAAP) | $9.51 (GAAP) / $10.17 (adj.) |
All three off-price retailers demonstrated strong consumer demand for value-oriented retail, outperforming the broader retail sector. CEO Conroy noted during the earnings call that “the primary loss of market share is occurring within mainstream retail… the shift is more from traditional retail, such as department stores, to off-price retailers”.
How the Market Reacted?
Despite the strong beat, Ross Stores shares initially fell 2.3% in after-hours trading on March 3, 2026, dipping to $199.13, as investors digested broader macro concerns and the potential for future challenges. However, sentiment quickly reversed: on the next trading session (March 4), shares surged approximately 5–6%, driven by the upbeat FY2026 guidance calling for 3–4% comp growth and EPS of $7.02–$7.36. Analysts from multiple firms noted the strong start to Q1 FY2026 (with 7–8% comp guidance) as a key catalyst for renewed optimism. As of March 6, 2026, ROST traded at $211.75, near its 52-week high of $216.80, with a market capitalization of approximately $68.5 billion.
