


Introduction
Airline statistics: When we talk about airline Statistics, we’re really talking about the story of how flying grew from a few mail flights in 1911 to billions of passengers today. These numbers show us how airlines change travel, jobs, and even the global economy.
In this article, I’ll walk you through the major facts and figures in simple words that will help you to understand easily. We’ll look at how many people fly, how much money airlines make or lose, how fuel costs matter, and which airlines lead worldwide. These airlines’ statistics make it clear that planes are not just about travel; they connect directly to business, families, tourism, and the future of sustainability. Let’s get started.
Editor’s Choice
- The first official airmail flight took place in India in 1911, carrying 6,500 mail items, and the first scheduled passenger flight was in 1919 by AT&T in the UK. By 1945, IATA was formed with 57 airlines from 31 countries.
- Airlines carried 4.1 billion passengers on 41.9 million flights, generating $704.4 billion in revenue and supporting 65.5 million jobs worldwide.
- The industry swung from a $40.4 billion net loss in 2021 to a projected $36 billion net profit in 2025, with EBIT margins around 6.7%.
- Around 5.2 billion passengers are expected to travel by air in 2025, with traffic growth at 8% globally, though capacity growth is slowed by aircraft delivery shortages.
- As of 2025, there are 725 active airlines and nearly 4,000 airports. American Airlines operates the most daily flights (5,946), while United serves the most destinations (381).
- Jet fuel costs make up 25.8% of airline expenses in 2025, with average prices at $86/barrel. Sustainable Aviation Fuel (SAF) accounts for just 0.7% of total consumption despite big investment deals worth $45 billion.
- Airbus forecasts 3.6% annual passenger traffic growth through 2044, with Asia and the Middle East as the biggest growth regions.
| Category | Key Data / Highlights |
| Origins | First airmail flight (India, 1911), first passenger flight (UK, 1919), IATA (1945) |
| 2016 Scale | 4.1B passengers, 41.9M flights, $704.4B revenue, 65.5M jobs, $2.7T economic activity |
| 2021 | Net loss: $40.4B, EBIT margin: −8.5% |
| 2022 | Net loss: $3.5B, EBIT margin: +1.5% |
| 2023 | Net profit: $37.3B, EBIT margin: +6.9%, RPK growth: +36.8% |
| 2024E | Net profit: $32.4B, EBIT margin: +6.4%, RPK growth: +10.6% |
| 2025F | Net profit: $36.0B, EBIT margin: +6.7%, 5.2B passengers, RPK growth: +5.8% |
| Airline Operations | 725 active airlines, 3,939 airports, American 5,946 flights/day, United 381 cities |
| Fuel & Costs | Fuel cost $236B (25.8% of expenses), jet fuel avg $86/barrel, SAF 0.7% share |
| Future Outlook | 3.6% annual growth in passenger demand till 2044, led by Asia & the Middle East |
Origins of Airlines and Early Milestones
(Source: mit.edu)
- The earliest real commercial flight in India happened on 18 February 1911, when Henri Pequet flew mail in a Humber biplane for about 6 miles from Allahabad to Naini, carrying 6,500 mail items. That was the world’s first official airmail flight. Airlines’ statistics begin right there if you’re Indian-centric.
- The first commercial airline in India came soon after, with J. R. D. Tata flying mail from Karachi to Juhu in October 1932. That evolved into Air India.
- On a global scale, commercial aviation traces back to the post-World War I era, with the UK’s AT&T starting the first scheduled international passenger flight in 1919.
- Then associations: IATA started in April 1945 with 57 airlines from 31 countries, but its predecessor existed from 1919, an early effort to bring cooperation and price coordination among airlines.
| Year/Period | Event & Number Details |
| 1911 | First official airmail flight in India (6,500 mail items over 6 miles) |
| 1919 | First scheduled international passenger flight (UK’s AT&T) |
| 1932 | J.R.D. Tata’s mail flight later became Air India |
| 1945 | IATA was founded with 57 airlines from 31 countries |
Global Scale and Economic Impact
(Source: sphericalinsights.com)
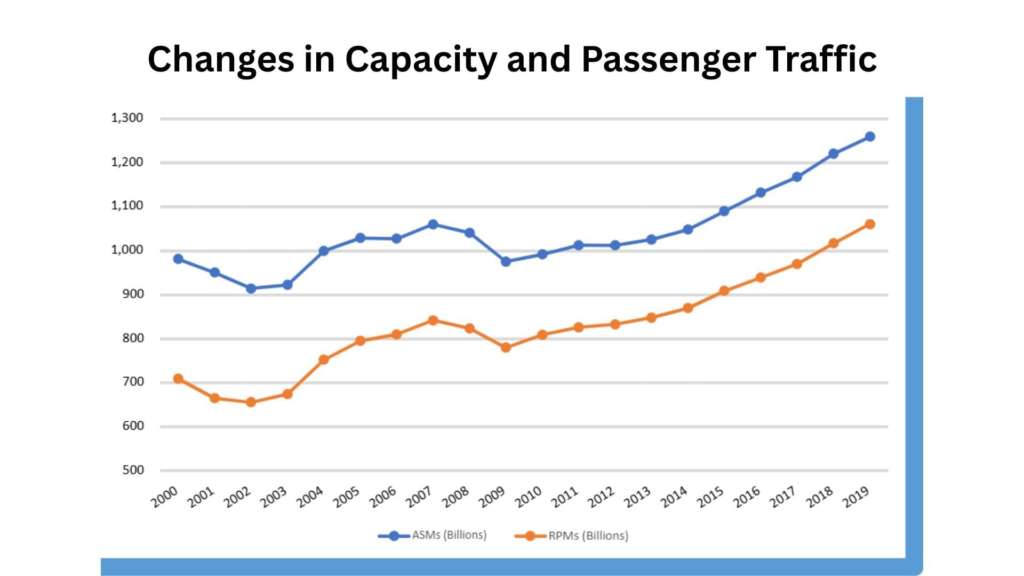
- In 2016, airlines handled about 4.1 billion passengers across 41.9 million commercial flights, covering around 7.75 trillion passenger-kilometres.
- That same year, air transport generated about $704.4 billion in revenue, created 10.2 million direct jobs, supported 65.5 million jobs overall, and contributed roughly $2.7 trillion in economic activity, around 3.6 percent of global GDP.
| Metric | Value |
| Passengers carried (2016) | 4.1 billion |
| Commercial flights (2016) | 41.9 million |
| Passenger-km (2016) | 7.75 trillion |
| Revenue (2016) | $704.4 billion |
| Direct employees | 10.2 million |
| Jobs supported (direct + indirect) | 65.5 million |
| Economic activity generated | $2.7 trillion (3.6 % GDP) |
Airline Economics- Profit, Revenue, and Traffic
(Source: itln.in)
IATA’s latest data has lots of numbers, so I’ll break them out carefully.
- EBIT margin (Earnings before interest & taxes):
#1. 2021: −8.5%
#2. 2022: 1.5%
#3. 2023: 6.9%
#4. 2024E: 6.4%
- Net profit (USD billions):
#1. 2021: −$40.4 billion
#2. 2022: −$3.5 billion
#3. 2023: $37.3 billion
#4. 2024E: $32.4 billion
- Traffic to RPK (Revenue Passenger Kilometres) growth:
#1. 2023: +36.8%
#2. 2024E: +10.6%
- Capacity to ASK (Available Seat Kilometres) growth:
#1. 2023: +31.1%
#2. 2024E: +8.8%
- 2025 revenue outlook: Total revenues expected at $979 billion, up +1.3%, with passenger revenues at $693 billion (+1.6%) and ancillary revenues at $144 billion (+6.7%)
- Expenses projected at $913 billion (+1.0%). Fuel bill is about $236 billion (25.8 % of costs), with jet fuel price averaging $86/barrel in 2025, down from $99 in 2024.
- Profit revision: IATA lowered its forecast from $36.6 billion to $36.0 billion for 2025, still better than 2024’s $32.4 billion.
| Year | EBIT Margin | Net Profit (USD B) | RPK Growth | ASK Growth | Total Rev (USD B) | Expenses (USD B) |
| 2021 | −8.5% | −40.4 | to | to | to | to |
| 2022 | 1.5% | −3.5 | to | to | to | to |
| 2023 | 6.9% | 37.3 | +36.8% | +31.1% | to | to |
| 2024E | 6.4% | 32.4 | +10.6% | +8.8% | to | to |
| 2025F | 6.7% | 36.0 | +5.8% | +5.2% | 979 | 913 |
Passengers, Demand, and Capacity Trends
(Source: crp.trb.org)
- A record 5.2 billion passengers are expected in 2025, and global airline revenue should surpass $1 trillion, but delivery constraints are holding capacity back.
- BCG says air travel grew 6.5 % in 2024, and similar growth is anticipated in 2025, but capacity is limited by delays in aircraft and parts deliveries, along with wage cost pressures. Particularly, Indian demand is rising, and China is recovering.
- AP News says global passenger capacity to grow 7.5 % and North America 2.8 % in 2025; global traffic growth 8 %, North America 3 %. Major US airlines anticipate 23 to 24 % profit growth.
| Metric | 2024 Estimate | 2025 Forecast |
| Passengers (why cited?) | to | 5.2 billion |
| Air travel growth | +6.5% | approximately same |
| Capacity growth (global) | to | +7.5% |
| Capacity growth (North America) | to | +2.8% |
| Traffic growth (global) | to | 8% |
| Traffic growth (North America) | to | 3% |
Supply Chain, Consolidation, and Fuel
(Source: oliverwyman.com)
- Aircraft deliveries were 31 % below demand in 2023 and 2024, leading airlines to keep older planes longer. That favors big carriers and pushes consolidation. Example: Qantas and Virgin in Australia gained after smaller rivals like Rex and Bonza folded.
- Trade tensions and tariffs are hurting spare parts availability and raising maintenance costs.
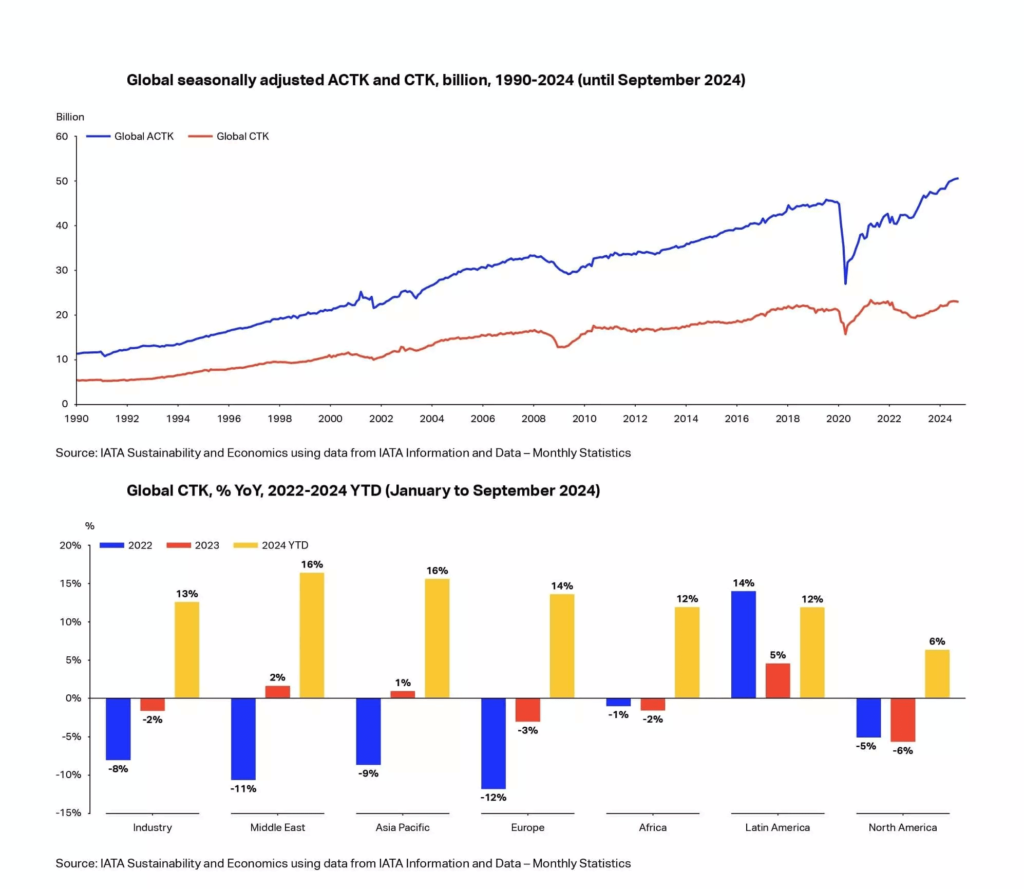
- Fuel vs SAF: Sustainable aviation fuel (SAF) production is around 2.1 million tonnes in 2025, just 0.7 % of total fuel consumption. In 2024, it was 1 million tonnes (double that of 2023).
- Big purchase agreements total $45 billion by early 2023. If scaled, 20 million tonnes by 2030 could be possible.
| Factor | Detail |
| Aircraft delivery shortfall | 31 % below demand (2023 to 24) |
| Industry consolidation | Larger carriers benefit, smaller folding |
| Trade/tariff tensions | Raise parts cost, disrupt maintenance |
| SAF production (2024 vs 2025) | 1 Mt to 2.1 Mt (0.7 % of fuel) |
| SAF purchase agreements (2023) | $45 billion |
| SAF target by 2030 | Possible 20 Mt uptake |
Fleet Size, Airlines, and Airports Today
(Reference: enterpriseappstoday.com)
- As of August 2025, 725 airlines are operating worldwide, and about 3,939 airports are currently in operation.
- Biggest airlines by daily flights (March 2025):
#1. American 5,946 flights/day
#2. Delta 4,343
#3. United 4,167
#4. Southwest 3,592
- Airlines with the most routes:
#1. Southwest 2,831
#2. Ryanair 2,611
- Destinations served (March 2025):
#1. United 381
#2. American 356
#3. Delta 311
| Metric | Number / Ranking |
| Active airlines (Aug) | 725 |
| Airports in operation | 3,939 |
| Daily flights (rank 1) | American 5,946 |
| Destinations (top) | United 381, American 356, Delta 311 |
| Routes network (top) | Southwest 2,831, Ryanair 2,611, American 1,250 |
Long-Term Growth Forecasts
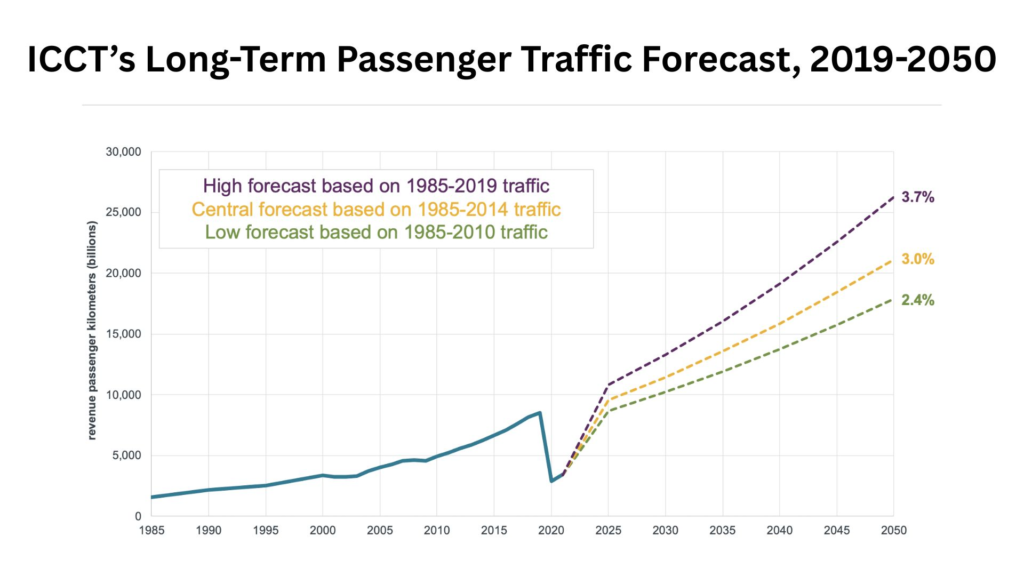
(Reference: theicct.org)
- Airbus forecasts average annual RPK growth of around 3.6 % mid to long term (2025 to 2044), driven by GDP (+2.5 %), trade (+2.6 %), and rising population. Growth is strongest in Asia & Middle East.
| Forecast Period | RPK Growth Pa | Drivers | Hot Regions |
| 2025 to 2044 Avg | 3.6% | GDP +2.5%, Trade +2.6%, Pop growth | Asia, Middle East |
Conclusion
So that’s the big picture of airline statistics. From the very first flights carrying a few letters to today’s airlines moving more than 5 billion passengers, the industry has come a long way. The numbers show both the progress and the struggles, whether it is profits bouncing back after losses, fuel taking up a big share of costs, or the small but growing role of sustainable aviation fuel.
But what these statistics tell us is how deeply airlines are tied to our daily lives and the world economy. It creates jobs, drives tourism, and connects countries. Looking at the trends, the future of air travel seems steady, with Asia and the Middle East leading growth, but also challenging, with costs and sustainability pushing airlines to adapt.
At the end of the day, I hope you understand these airline statistics. If you have any questions, kindly let me know in the comments section.
FAQ
In 2019, global airlines carried over 4.5 billion passengers, showcasing the vast scale of modern air travel.
Aviation accounts for about 2 to 3% of global CO₂ emissions, a modest but meaningful contribution.
Worldwide load factors hover around 79 to 82%, meaning most seats are filled, crucial for profitability.
Forecasts suggest the industry could reach around $1.1 to $1.6 trillion by 2025 to 2027.
Today, there are over 23,000 commercial aircraft in operation globally.
Low-cost carriers now account for roughly 30% of global airline traffic, marking a significant shift.
The top three alliances, Star Alliance, SkyTeam, and Oneworld, control over 60 to 70% of the market, pooling routes and coverage.
The average commercial aircraft in use is about 10 to 11 years old, reflecting a modernizing fleet.
Worldwide, airlines support around 12 million jobs and contribute trillions in economic activity.
Aviation is extremely safe, fatal accidents occur at fewer than 0.09 to 0.18 per million departures, underlining high safety standards.
