


Introduction
Brand Loyalty Statistics: The current market environment requires companies to develop brand loyalty as their main revenue source, which determines whether a company succeeds or fails. Brand loyalty serves as a key factor that separates successful brands from their competitors because consumers today face multiple options while prices increase and worldwide economic conditions remain unpredictable. In 2025, companies require customers to establish emotional bonds, which will lead to ongoing purchases and permanent customer relationships that will spend more money and bring new customers while choosing them over cheaper options.
The article examines current 2025 brand loyalty statistics, which show how customer loyalty affects consumer behavior and boosts company profits, and transforms contemporary marketing approaches.
Editor’s Choice
- Apple leads global brand valuation at USD 5745 billion, which exceeds Microsoft by USD 113 billion.
- Strong brands command 10–20% price premiums over lesser-known competitors.
- Loyal customers demonstrate 50% more product experimentation while they create chain value, which reaches 2x their total lifetime value.
- 53% of U.S. consumers prefer cashback rewards, which serve as the most effective loyalty program.
- 81% of German and 95% of South Korean consumers would boycott certain foreign brands.
- 50% of consumers actively choose a preferred brand over competitors.
- 27% of people show a willingness to pay extra for their favorite brand.
- 74% of people identify product quality as the main factor that creates customer loyalty.
- Online retailers keep 38% of their customers, while Amazon maintains 90% of its customer base.
- Repeat apparel customers spend 67% more in year three than in their first six months.
- 86% of loyal consumers recommend their favourite brand to others.
- 59% of U.S. loyal consumers prioritize buying from preferred brands.
- Gen Z shows the highest experimentation, with 39% likely to try a new brand.
- Paid members show stronger behavior, with 82% purchasing more frequently and 78% spending more.
Most Valuable Brands
(Reference: statista.com)
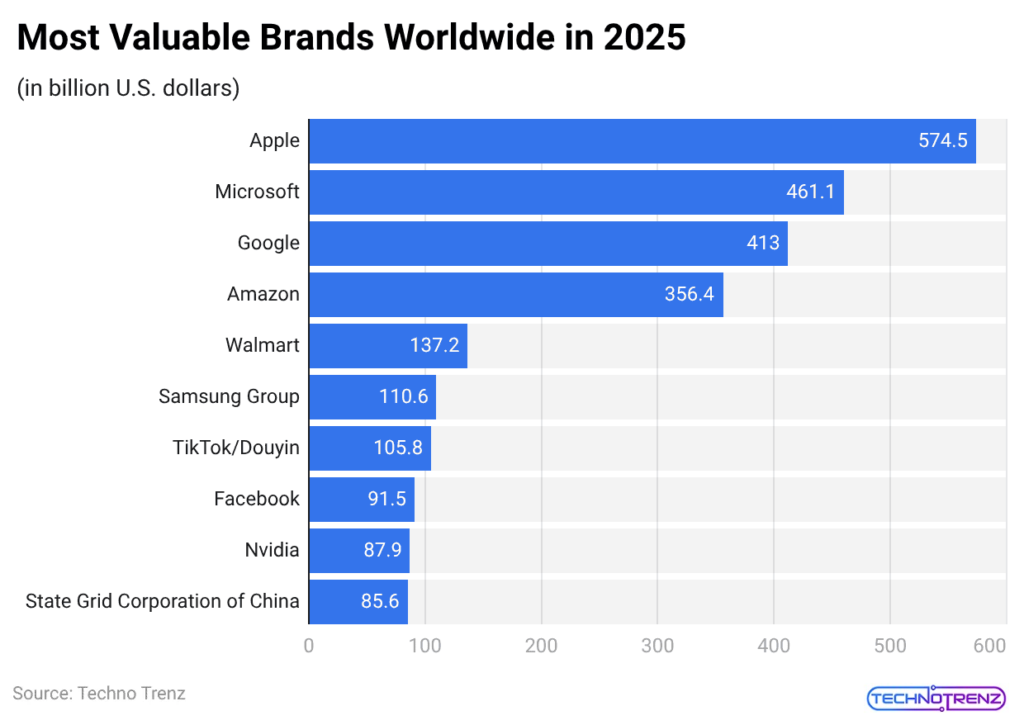
- The valuation data from 2025 shows that technology-driven companies maintain their position as the dominant force in global brand rankings.
- Apple leads the ranking with a brand value of USD 574.5 billion, while Microsoft follows with a brand value of USD 461.1 billion.
- The valuation gap, which exceeds USD 113 billion between the top two brands, demonstrates Apple’s control over pricing and its powerful ecosystem.
- Google and Amazon maintain their status as leading companies, which proves that technology drives most of the global brand distribution.
- The three sectors of business, technology, media, and entertainment, and consumer technology make up the largest portion of value for the top 100 global brands, which demonstrates the tendency of businesses to focus on high-profit digital business models.
- Strong brands create price premiums that reach 10 to 20 % above their competitors, according to brand loyalty research, which supports this trend.
- Brand value exists as a separate entity from brand equity because it measures financial value through specific calculations that show brand worth.
- Customers who demonstrate brand loyalty will first try new products because their lifetime value exceeds the value of 50 % of their initial investment.
- Companies with strong brand recognition can decrease their financing expenses while simultaneously increasing returns to shareholders, according to additional brand loyalty research.
- Brand loyalty statistics show that companies achieve valuation leadership through their ability to build trust with stakeholders and maintain ongoing revenue generation.
Loyality Programs
(Reference: statista.com)
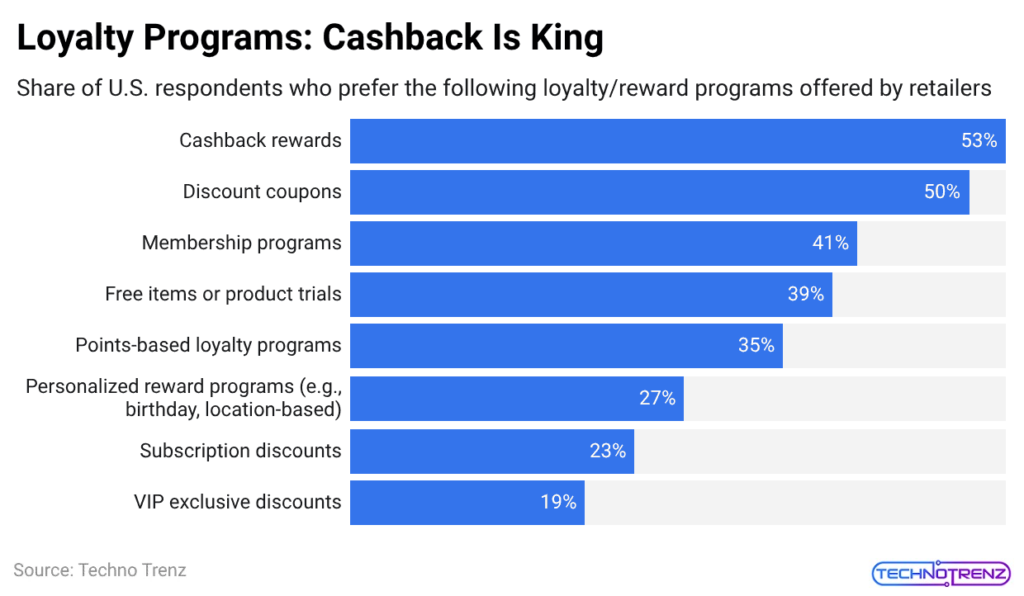
- The recent brand loyalty research shows that customers prefer to receive immediate benefits that provide them with actual worth.
- Among U.S. respondents, 53% prefer cashback rewards, making it the most favored loyalty incentive.
- The power of direct price reductions as a behavioral trigger reaches its peak because 50% of people choose discount coupons.
- The loyalty patterns of mid-tier customers show that they support more than one loyalty program.
- 42% of customers select membership programs, while 39% select free product trials and items because both types of benefits provide customers with experiences and access.
- 35% of customers select points-based loyalty programs because they find delayed gratification systems to be attractive.
- The brand loyalty statistics show that customer retention decreases when organizations offer benefits that require customers to wait for results or face complicated requirements.
- The three options show that 27% of customers choose personalized reward programs, while 23% select subscription discounts and 19% opt for VIP-exclusive discounts.
- The nearly 34-%age-point gap between cashback (53%) and VIP perks (19%) highlights a clear hierarchy of consumer motivation.
- The brand loyalty statistics demonstrate that a simple system that provides instant financial rewards functions as the main factor that attracts customer engagement.
Consumer Willingness To Boycott Foreign Brands In 2024
(Reference: statista.com)
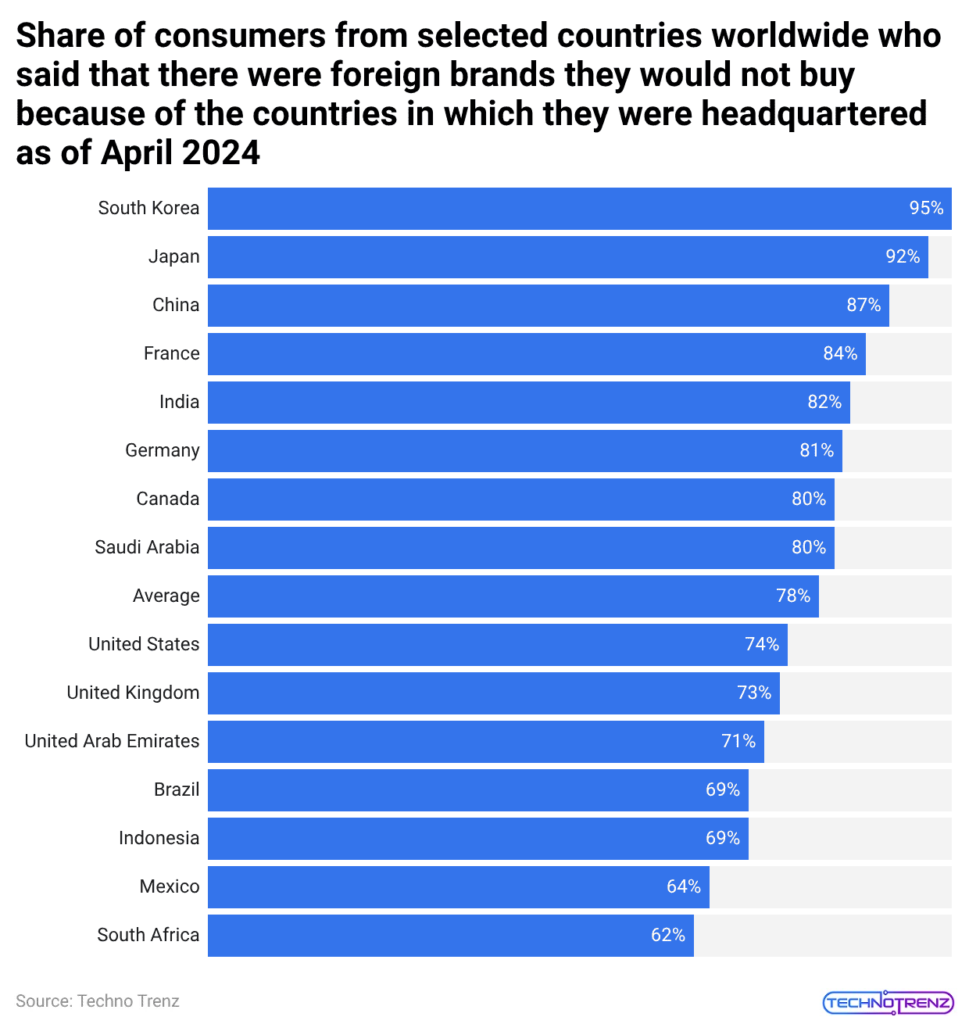
- The 2024 survey results show that consumer nationalism has grown stronger throughout major developed markets.
- In Germany, 81% of adults stated they would avoid purchasing certain foreign brands based solely on the country of headquarters.
- South Koreans showed more intense opposition because 95% of participants said they would boycott foreign companies in identical situations.
- The data shows exceptionally strong resistance from people in developed countries.
- The brand loyalty data shows that people now base their buying choices on their understanding of international political situations.
- Brand loyalty data shows that people now judge their brand choices and willingness to take risks based on their national identity.
Consumer Behavior Insights
(Reference: capitaloneshopping.com)
- The latest brand loyalty statistics demonstrate that customers who demonstrate behavioral commitment show stronger loyalty to brands than those who show repeat purchasing patterns.
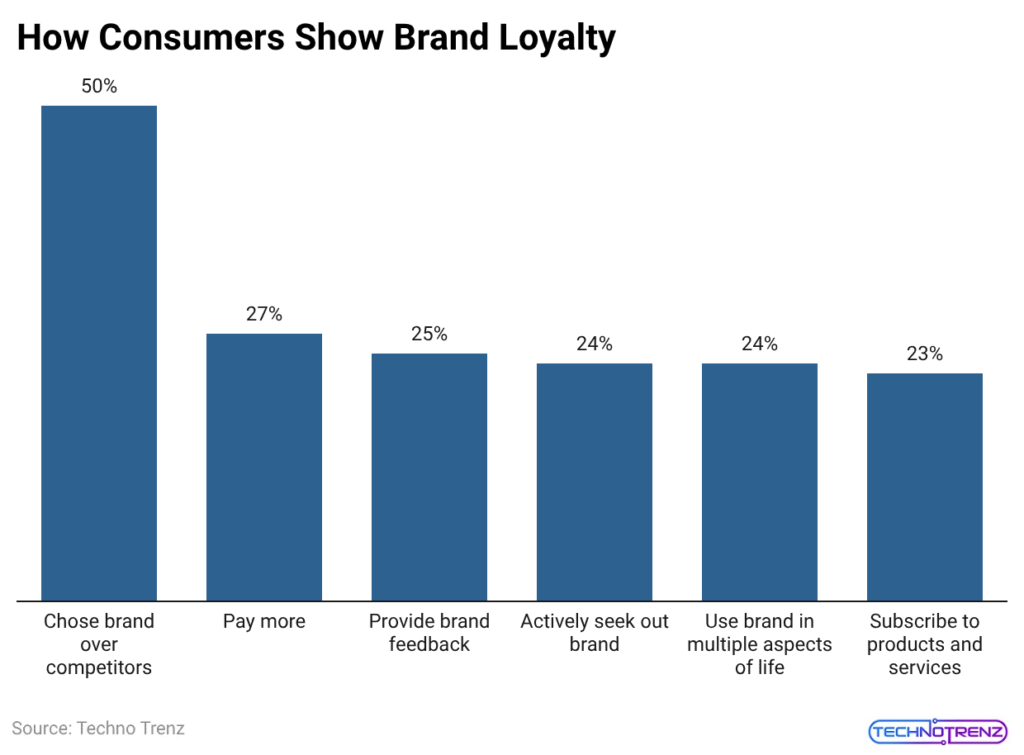
- Brand preference functions as the main indicator because 50% of consumers choose one brand over its competitors, which shows that half of the market remains committed to active brand selection.
- The 50% benchmark establishes a specific point that companies can use to determine their market edge.
- 27% of consumers are willing to pay more for their preferred brand, which creates a pricing premium that companies can measure according to their loyalty levels.
- Customers show moderate levels of engagement, which leads to meaningful outcomes because 25% of customers share brand opinions that help develop new products or services.
- The study found that both exploratory and habitual behaviors hold important research value.
- 24% of people actively search for their preferred brand, while another 24% of people use the brand throughout different parts of their daily activities.
- The number of people who subscribe to subscription-based products or services shows a lower value because 23% of customers choose to subscribe.
Core Drivers Behind Consumer Brand Commitment
- Current brand loyalty research shows that emotional connection with customers, together with exceptional service quality have become more important than price competition, which businesses used to compete with one another.
- The financial value of identity alignment shows that 89% of U.S. consumers choose brands that match their personal beliefs.
- Customer service excellence ranks as the top loyalty driver for 82% of consumers, while 82% of people expect businesses to provide extensive product access to maintain their customer base.
- Data stewardship has become a vital element that businesses use to distinguish themselves from their competitors.
- The strong data privacy practices of brands make 80% of consumers stay loyal to those companies because people now understand digital matters better than before.
- The study found that 79% of consumers buy from companies that demonstrate they understand their customers’ needs; this fact shows that customers want businesses to show them care through personalized service.
- In 2022, 60% of consumers ranked trustworthiness and transparency as top brand traits, up from 55% in 2021, marking a 9.09% year-over-year increase.
- According to 56% of people, they develop stronger loyalty toward brands that understand their customer needs, while 54% of people stay loyal to at least one brand because they support social issues.
- Brand loyalty statistics demonstrate that brands that invest in emotional connection with customers through ethical business practices achieve measurable advantages over their competitors.
What Truly Drives Product Brand Loyalty
(Reference: capitaloneshopping.com)
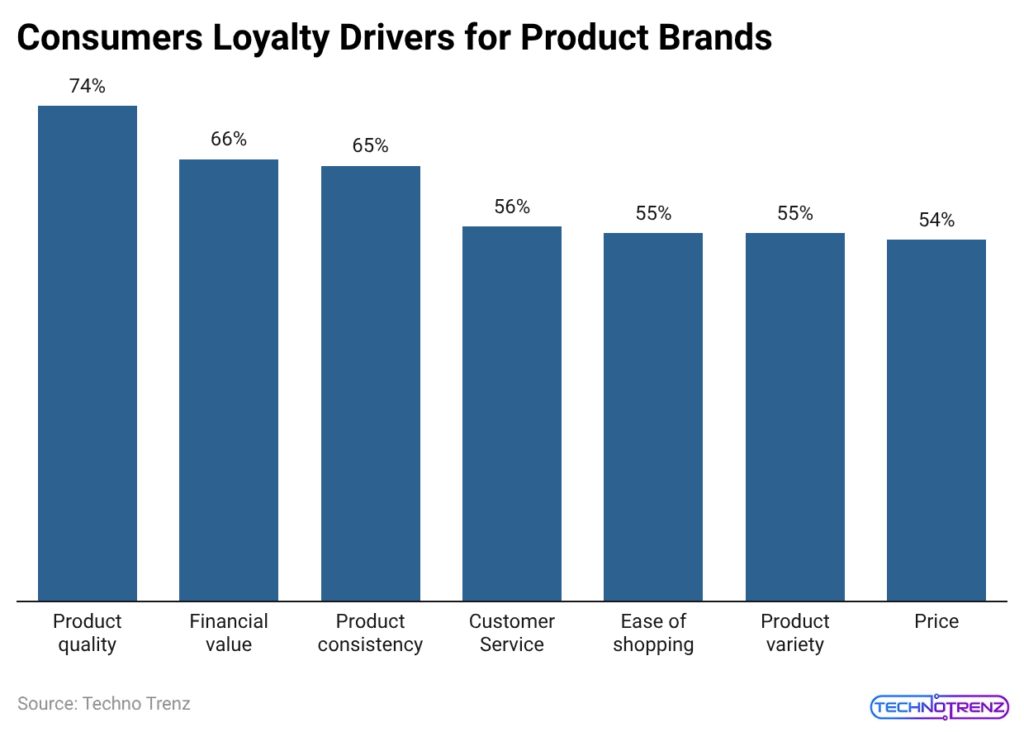
- The latest brand loyalty statistics indicate that product fundamentals remain the dominant force that ties consumers to their preferred products.
- 74% of consumers cite product quality as the primary loyalty driver, establishing quality as the strongest competitive differentiator.
- Financial considerations follow closely because 66% of people value financial worth, while 65% of people consider product reliability as their trustworthy source for establishing loyalty.
- Customer service, together with service delivery options, creates the next level of impact.
- 56% identify customer service as a key driver, positioning post-purchase experience as a significant retention lever.
- 55% of shoppers prefer shopping convenience, while another 55% choose product variety as their primary shopping requirement, which shows that both operational efficiency and product assortment have equal importance.
- Price sensitivity exists as an essential factor, but 54% of people identify price as an element that affects their loyalty.
- Brand loyalty statistics establish a system of ranked importance, which begins with essential product performance and moves to economic advantages and then reliable product distribution.
- The tight interval of 66% to 54% indicates that various factors function within a narrow range, which creates increased competition in the industry.
- The brand loyalty statistics indicate that successful quality maintenance, together with value matching, achieves better results than using price-based tactics.
eCommerce Retention Trends
- The latest brand loyalty statistics demonstrate that digital commerce businesses achieve higher revenue growth when they successfully retain their customers.
- Online brands and retailers retain an average of 38% of customers, highlighting moderate baseline loyalty across the sector.
- Amazon maintains a 90% customer retention rate, which establishes the company as the industry leader in customer retention practices.
- Customers who repeat their purchases at an online apparel brand during their third year of shopping spend 67% more than they did during their first six months.
- Customers who shop online for clothing spend 40% more during their fifth purchase than they did during their first purchase and 80% more during their tenth purchase than during their first transaction.
- Third-year repeat customers at grocery stores spend 23% more than customers who have less than six months of shopping experience.
- The brand loyalty statistics show that websites that maintain long-term customer relationships achieve revenue growth through increased customer value that results from ongoing customer interaction.
Brand Loyalty Consumers
- People demonstrate brand loyalty by showing their support of brands through their advocacy work, which research shows to be the most powerful way they show their loyalty.
- Brand-loyal customers worldwide recommend their preferred brands at a rate of 86% and write online reviews about their positive experiences at a rate of 66%, which helps businesses achieve organic growth.
- Global purchase commitment shows strong results because 52% of consumers want to purchase from their preferred brands, and 59% of U.S. loyal consumers choose to shop at their preferred brands or stores.
- Loyalty programs attract 48% of American consumers, while 29% of consumers possess brand or retailer credit cards that provide rewards.
- Feedback contribution stands at 25%, while 16% exclusively purchase from preferred brands.
- Direct marketing communication opt-ins show selective behavior because 15% of people choose to receive such communications.
- According to the Capital One Shopping study, shows that 13% of participants do not factor price into their decisions, while 12% use social media for engagement purposes.
- The brand loyalty statistics show that customers demonstrate three distinct behaviors of recommendation, repeat behavior, and structured program participation to show their loyalty intensity across various markets.
Brand Loyalty Among Generations
(Reference: capitaloneshopping.com)
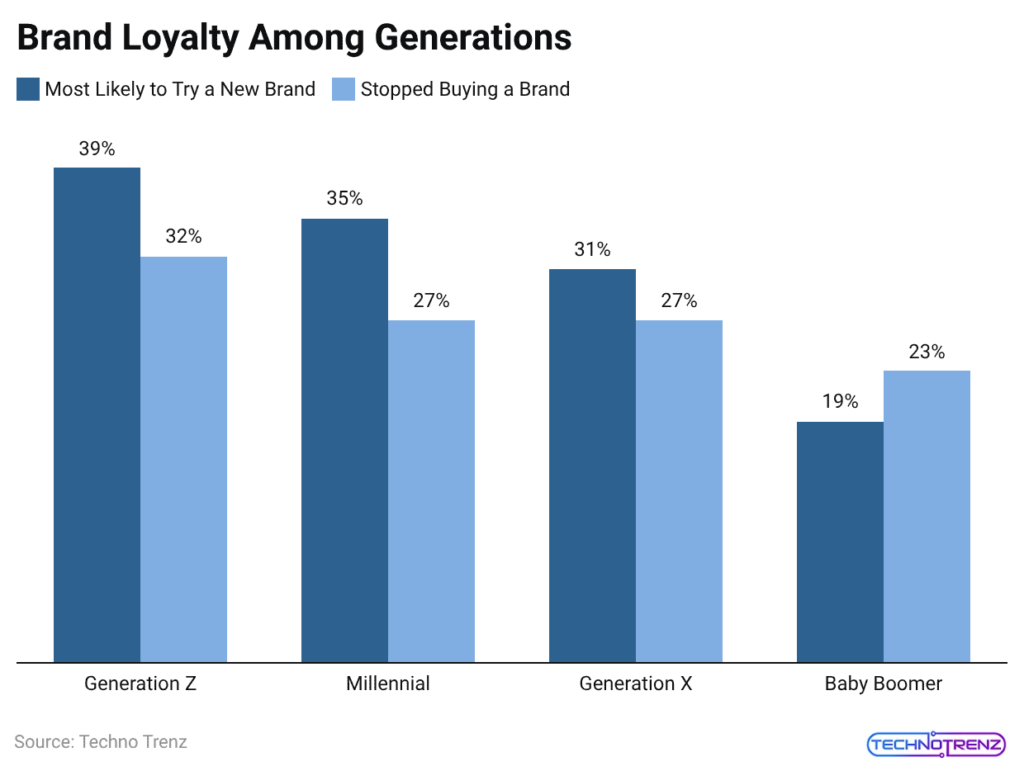
- Generation Z shows the highest brand experimentation, with 39% of members willing to try new products, while 32% of members report they stopped buying from specific brands.
- The majority of Millennials show brand loyalty, with 35% who would switch brands and 27% who already stopped buying from specific brands.
- Generation X demonstrates moderate brand loyalty because 31% of people will try new products, while 27% of people have already stopped buying.
- Baby Boomers show better brand retention because only 19% of them will try new brands, while 23% of them have stopped buying their current brands.
- The data clearly shows that different generations show different patterns because older people show less willingness to try new things, while all age groups show some level of brand abandonment.
- The 20-point difference between Gen Z’s 39% trial rate and Boomers’ 19% trial rate shows how consumer behavior has changed.
- The research shows that young people exhibit high brand loyalty because they show more unpredictable behavior compared to older customers.
- Digital native generations show higher customer turnover rates through their brand loyalty statistics than traditional customers do.
Paid Brand Loyalty Program
The statistics about brand loyalty show that customers increasingly adopt paid membership systems. In 2024, 79% of consumers participated in at least one paid loyalty program, while 70% paid for a loyalty program, which shows a 32.1% year-over-year growth from 53% in 2023. Program usage has increased since 27% of customers now use multiple paid services according to their current subscription level. 82% of paid members purchase more frequently, which shows a 1.23% higher purchasing frequency than users of the free program.
The brand receives 78% of its customers who spend more money, which exceeds the free tier spending rate by 2.63%. Customers show brand interest through their engagement activities since 61% of customers discuss the brand more often, and 51% of customers participate in activities that do not involve purchasing.
The Future of Brand Loyalty
- The next competitive advantage will come from businesses that use precise customer interactions instead of reward systems, which provide traditional benefits.
- Recent brand loyalty statistics reveal that 72% of consumers expect personalized experiences, while companies leveraging advanced personalization report revenue increases of 10–15%.
- The method of data-driven targeting has advanced beyond its testing phase because it now connects to improved customer retention rates and customer spending, which increases by 67%.
- Digital ecosystems create a strong shift because they create digital spaces where users interact with businesses.
- Research shows that brands that connect mobile applications with AI-based recommendation systems experience almost 40% increased customer engagement that leads to regular purchase patterns.
- The 64% of global consumers who identify with brands through their social or environmental commitments demonstrate how socially responsible strategies create dedicated customer bases.
Conclusion
Brand loyalty statistics: The metric of brand loyalty maintains its status as a vital business success indicator, which generates repeat purchases, increases customer lifetime value, and enables profitable business expansion. Brands must acknowledge that loyal customers hold both financial value and strategic importance because 77% of consumers remain loyal for more than 10 years, and loyalty programs generate 4.8 times return on investment.
Customers show genuine loyalty when they receive personalized experiences that reflect their values because companies must create emotional connections with their rewards programs. The business will create customer loyalty through these requirements, which will result in customer acquisition, customer retention, business growth, and enhancement of market positioning.
FAQ
53% of U.S. consumers prefer cashback rewards over other loyalty incentives.
Repeat apparel customers spend 67% more in their third year compared to their first six months.
Product quality leads at 74%, followed by financial value at 66%.
79% of consumers join at least one paid loyalty program, according to the 2024 statistics.
Generation Z leads with 39% who are most likely to try a new brand.
Sources
Disclaimer: This press release/article is provided by a third party, which is solely responsible for its content. Readers are advised to independently verify all information and do their research before acting on it or investing any money. CoinLaw is not responsible for any financial loss that may result from reliance on this content.
