


Introduction
Church Revenue Statistics: Church revenue comprises income from multiple groups and communities that support worship, staff, buildings, outreach, and community programs. Many people think churches derive income solely from Sunday offerings, but income usually comes from several sources. These include tithes and donations, fundraising events, rental of church spaces, grants, and investment returns.
Understanding where funding comes from and how it is used demonstrates how churches maintain their mission, plan for the future, and manage challenging economic times.
Editor’s Choice
- The average donation size to a church is USD 210.
- Additionally, 2.96% of donations are USD 1,000 or more, indicating that 2.96% of all transactions exceed USD 1,000.
- Only 2.85% of gifts exceed USD 1,000, and approximately 43.89% are less than USD 100.
- The digital giving accounted for 42% of total church donations among its faith-based customers in 2025.
- A credit card donation to a church is USD 147, while a bank account (ACH) donation is USD 255.
- Adults attending U.S. Protestant churches give an average of USD 17 per week.
- In December 2025, donations accounted for 11% of all donations; the average donation was 21% higher, and total giving was 33% higher than in any other month.
- 76% of givers donate once a year or only occasionally.
- Nearly 50% of online donors use a payment card.
- 67% of donors reported that trust is essential before giving, but only 22% report high trust in the charities they support.
- In Q3 2025, weekly per-capita giving increased from USD 51 to USD 58.
- The Episcopal Church in the United States budgeted USD 46,210,288 in total income for 2025 and estimated it would reach USD 48,096,369 by 2026 in its churchwide budget.
Church Giving And Crowdfunding Statistics
- According to Nonprofitsource, 80% of people who give to churches report having no credit card debt, and 60% being willing to give digitally to their church.
- In a typical congregation, tithers constitute approximately 10%-25% of members.
- Churches that accept online tithing can see overall donations increase by about 32%.
- Only 5% of people tithe, and about 80% of Americans give roughly 2% of their income.
- Christians give about 2.5% of income today, compared with 3.3% during the Great Depression.
- 3%-5% of Americans who give to their local church do so through consistent, regular tithing.
- Approximately 17% of Americans report regularly tithing.
- Among families earning USD 75,000 or more, with 1% give 10% or more as a tithe.
- 75% of people who do not attend church still donate to nonprofit organisations.
- Adults attending U.S. Protestant churches give an average of USD 17 per week.
- About 37% of regular church attendees and Evangelicals do not give money to their church.
- 17% of American families have reduced their giving to their local church.
- 7% of churchgoers have reduced regular giving by 20% or more.
- Roughly 10 million tithers in the U.S. donate about USD 50 billion per year to churches and nonprofits.
- 77% of tithers give 11%- 20% or more of their income, well above the standard 10% benchmark.
- 70% of tithers calculate their tithe using gross income rather than net income.
- Successful campaign owners post about 4 updates on average.
- Crowdfunding campaigns receive about 126% more donations when owners post updates to supporters.
- Campaigns shared fewer than 2 times have about a 97% chance of failure.
- Moreover, personal videos raise about 150% more than campaigns without videos.
- More than 50% of recipients of crowdfunding campaign emails donate.
Church Donation Size Distribution
(Source: website-files.com)
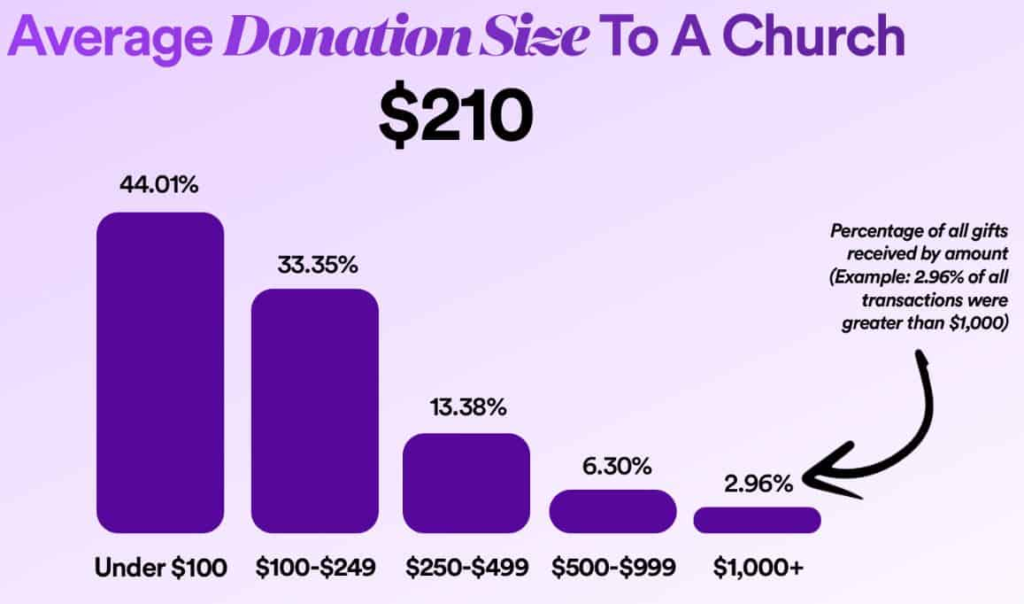
- The average donation size to a church is USD 210.
- 44.01% of all donations are less than USD 100.
- 33.35% of donations fall between USD 100 and USD 249.
- 13.38% of donations were between USD 250 and USD 499; 6.30% (USD 500 and USD 999).
- 2.96% of donations are USD 1,000 or more, indicating that 2.96% of all transactions exceed USD 1,000.
Donation Mix Statistics By Transaction Share Vs. Total Giving Volume
| Donation amount (USD) | Share of all transactions | Share of Total Giving Volume |
| Under 100 | 44.01% | 8.22% |
| 100-249 | 33.35% | 23.24% |
| 250-499 | 13.38% | 21.21% |
| 500-999 | 6.30% | 19.10% |
| 1,000+ | 2.96% | 28.24% |
Church Giving Concentration
- Nucleus reports that only 2.85% of gifts exceed USD 1,000, and approximately 43.89% are less than USD 100.
- Although 43.89% of gifts are under USD 100, they account for only 8.39% of the total dollars given.
- This means that nearly half of donors give less than 10% of their total giving.
- Although only 2.85% of gifts exceed USD 1,000, these gifts account for 27.34% of the total amount given.
Monthly Giving Share, 2025
| Month | Share of Annual Giving Share |
| January | 7.60% |
| February | 7.26% |
| March | 8.34% |
| April | 8.24% |
| May | 7.38% |
| June | 7.43% |
| July | 7.54% |
| August | 7.75% |
| September | 7.97% |
| October | 8.11% |
| November | 8.05% |
| December | 14.34% |
Weekly Gift Share
| Day of Week | Share of gifts |
| Sunday | 26.27% |
| Monday | 13.52% |
| Tuesday | 11.51% |
| Wednesday | 10.79% |
| Thursday | 11.67% |
| Friday | 16.74% |
| Saturday | 9.49% |
Hourly Gift Share
| Hour (24-hour) | Share of gifts |
| 0:00 | 0.70% |
| 1:00 | 0.37% |
| 2:00 | 0.31% |
| 3:00 | 0.28% |
| 4:00 | 0.48% |
| 5:00 | 1.54% |
| 6:00 | 2.94% |
| 7:00 | 5.12% |
| 8:00 | 7.83% |
| 9:00 | 9.04% |
| 10:00 | 10.74% |
| 11:00 | 9.51% |
| 12:00 | 6.16% |
| 13:00 | 5.79% |
| 14:00 | 5.30% |
| 15:00 | 5.14% |
| 16:00 | 4.79% |
| 17:00 | 4.17% |
| 18:00 | 3.65% |
| 19:00 | 3.84% |
| 20:00 | 4.16% |
| 21:00 | 3.75% |
| 22:00 | 2.90% |
| 23:00 | 1.48% |
Church Online Giving Statistics
- According to Business Wire, digital giving accounted for 42% of total church donations among its faith-based customers in 2025.
- 51% of churches said their overall giving increased.
- Recurring gifts make up 42% of digital donations and 57% of digital transactions.
- Digital wallet adoption more than doubled in 2024, yet only 20%-33% of surveyed churches currently offer digital wallets (e.g., Apple Pay or Venmo).
- 61% of churches reported increased digital giving, while cash and check giving remained steady.
- Pushpay reports that churches received more than USD 1 billion through its platform in December 2025, and the average gift size was 53% higher in December than in other months of 2025.
- The average gift size was 240% higher during the final three days of 2025 than the typical daily average.
- It processed 53.6 million gifts in 2025, 5% higher than in 2024, and reported that recurring giving volume increased 11% year over year.
- 18.4 million mobile gifts in 2025, and says 58% of first-time givers used Apple Pay, with 1.8 million first-time givers captured in 2025.
- Tithely’s 2025 estimates indicate 80% of online donations come through a web form and 20% through a giving app.
- 37% of all donations and 31% of total giving volume.
- December accounts for 11% of all donations, the average donation is 21% higher, and total giving is 33% higher than in any other month.
- The dataset includes an average church donation of USD 157.
Preferred Giving Methods Statistics
- On average, a credit card donation to a church is USD 147, while a bank account (ACH) donation is USD 255, according to Nucleus. church.
- Over a full calendar year, 29% of total church giving comes through credit cards, and 71% comes through bank account (ACH) transfers.
- In 2025, Tithely’s report stated that 80% of donations are made by debit/credit card, 16% by bank account (ACH), and 4% by digital wallet.
Typical Church Donation Frequency
(Source: website-files.com)
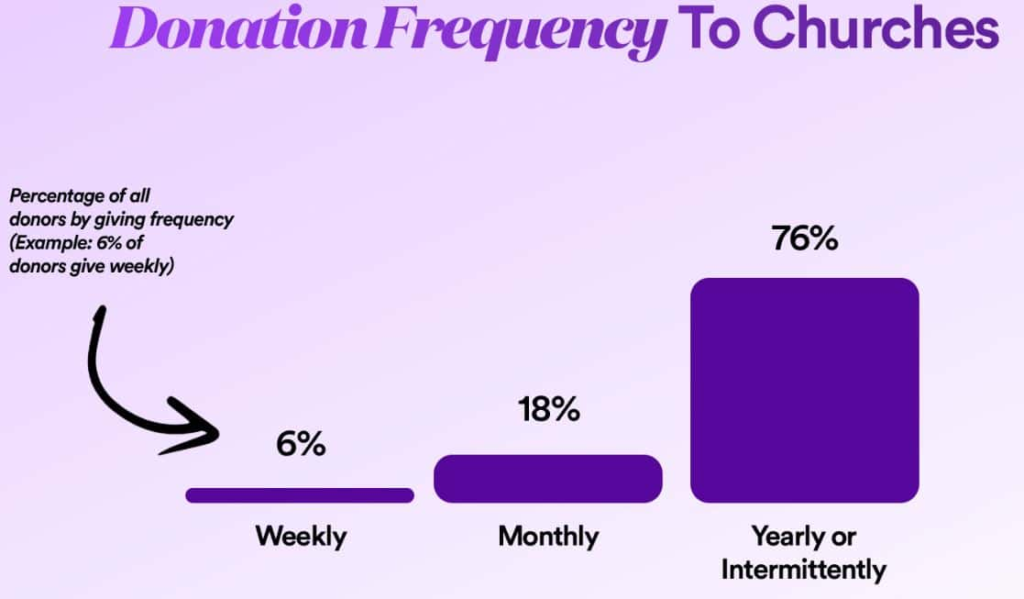
- 6% of givers donate weekly, while 18% donate monthly.
- 76% of givers donate once a year or only occasionally.
By Share of Giversvs. Share of Total Giving Volume
- According to the nucleus. church reports, weekly givers account for only 5.60% of all givers, yet they contribute 19.07% of total giving volume.
- Monthly givers make up 18.20% of all givers and generate the largest share, at 52.02% of total giving volume.
- Yearly or intermittent givers account for 76.21% of all givers, but they deliver 28.91% of total giving volume.
Key Findings On Church Giving And Donor Behaviour
- According to Subsplash, around 50% of churchgoers use digital giving (online, app, or other electronic methods).
- Approximately 60% of people report being willing to give to their church digitally.
- 94% of highly engaged Scripture readers also donate to a church.
- Among Scripture-engaged donors, 64% report directing most of their giving to their church.
- Research commonly indicates that about 75%-90% of church members do not tithe.
- Only about 10%-25% of church visitors are reported to tithe.
- Only 5% of churchgoers tithe consistently every month.
- The average churchgoer gives about USD 17 per week.
- Many regular tithers give more than 10% of their income, but the average attendee gives less than USD 20 per week.
- 77% of regular tithers give between 11% and 20% of their income.
- Adding an online giving option is associated with an average 32% increase in total church donations.
- 50% of donors choose to cover online transaction fees when given the option.
- Nearly 50% of online donors use a payment card.
- 27% of all charitable donations go to religious organizations, including churches.
- 57% of donors participate in monthly giving programs.
- 67% of donors reported that trust is essential before giving, but only 22% report high trust in the charities they support.
- Approximately 34% of donors are discouraged from donating when they are uncertain abouthow the money will be used.
- Mobile giving varies by generation: 30% of Boomers, 38% of Gen X, 47% of Millennials, and 68% of Gen Z donate using mobile devices.
Average Giving Per Person In Church
- According to the Unstuck Group, in 2025, self-reported data from 487 U.S. churches indicate that the average weekly per-person giving was USD 51.
- In the Q1 2025 Unstuck Church Report, per-capita giving was reported at USD 51 per person (excluding children), even as general fund giving increased by 8%.
- In Q3 2025, weekly per-capita giving increased from USD 51 to USD 58.
- Churches averaged USD 55 per person (excluding kids) while other churches averaged USD 63.
- By frequency, weekly giving participation declined from 49% in 2015 to 39% in 2025.
- A January 27, 2026, report with average gift size up 53% in December versus other months and up 240% in the final three days of the year.
Publicly Reported Church Revenue And Funding Statistics
- The Episcopal Church in the United States budgeted USD 46,210,288 in total income for 2025 and estimated it would reach USD 48,096,369 by 2026 in its churchwide budget.
- The Presbyterian Church (U.S.A.) reported revenue of USD 94.2 million in 2025 and estimated it would reach USD 94.3 million in 2026 in its proposed unified budget.
- For January-November 2025, the PC(USA) reported USD 111.9 million in income.
- The Evangelical Lutheran Church in America (ELCA) revised its 2025 Current Fund spending authorization to USD 65,375,000 and proposed 2026 spending of USD 61,500,000.
- The ELCA proposed a total 2026 spending authorisation of USD 83,050,000, including USD 21,550,000 for ELCA World Hunger.
- The Southern Baptist Convention adopted a 2025-2026 Cooperative Program Allocation Budget of USD 190,000,000, indicating that the same total budget spans both 2025 and 2026 within the two-year cycle.
- The SBC reported Cooperative Program receipts of USD 15,318,466.87 in November 2025, USD 13,846,155.22 in December 2025, and USD 19,325,460.46 in January 2026, with a fiscal year-to-date total of USD 63,563,251.18 from Oct 1, 2025, to Jan 31, 2026.
- Florida Baptist churches contributed USD 28,606,370 through the Cooperative Program in 2025, a 2% increase from 2024, according to the convention.
- From the USD 28,606,370 total in 2025, the convention sent USD 14,276,238 to the SBC and retained USD 14,330,131 for work in Florida.
- The Church of England planned £1.6 billion in spending for 2026-2028, funded by an £11.1 billion endowment, and a 10.7% increase in clergy stipends for 2026 (mid-market, Feb 2026), representing roughly USD 2.18 billion in planned spending and about USD 15.12 billion in endowment value.
Conclusion
Church revenue is not only Sunday offerings. It includes donations, fundraising, rentals, grants, and investments. When a church manages this money well, it can run services, pay staff, maintain buildings, and support outreach.
Clear budgeting and open reporting also build trust with members. Ultimately, a steady income helps the church remain strong, serve the community, and plan for the future.
FAQ
Most church revenue comes from tithes, offerings, and member donations.
Yes, many churches also earn from events, space rentals, grants, and investment income.
Church money is usually managed by church leaders, a treasurer, a finance team, and sometimes an outside accountant or auditor.
Common ideas include bake sales, charity dinners, concerts, auctions, fairs, and sponsorship drives.
Churches often run online giving campaigns, set up recurring donations, and use text-to-give or digital giving pages.
