


Introduction
Online Video Consumption Statistics: Video is now the top choice for content. With 93% of marketers using video in their overall marketing plans, the role of video in marketing has grown significantly in recent years. Social media companies have also boosted this trend by focusing on tools for creating video content.
If you need more clarification about investing in video marketing, this article gathers the latest trends from various studies. Video marketing gives marketers many ways to grow their business and promote their brands. This article will shed more light on “Online Video Consumption Statistics”.
Editor’s Choice
- In 2024, TikTok is expected to become more popular than Facebook for marketing videos.
- By 2025, videos will account for 82% of all consumer internet traffic.
- 90% of people say videos help them decide what to buy. LinkedIn users are 20 times more likely to share video content compared to other types of content.
- In 2024, the average person is predicted to spend nearly 100 minutes a day watching videos online.
- Recent research shows that emails with videos have a click-through rate that’s over 300% higher than emails without videos.
- Video streaming is expected to make up 91% of global internet traffic by 2024.
- The average internet user will watch over 100 minutes of online videos daily by 2024.
- Short videos are very popular, with 85% of viewers preferring videos that are 15 seconds or shorter, as stated in Online Video Consumption Statistics.
- Video SEO is becoming more important because Google says videos are 50% more likely to show up on the first page of search results.
- A huge 97% of marketers say that videos have improved their customers’ understanding of their products or services, and 76% say videos have helped boost their sales and revenue.
- Social media video ads get shared 12 times more than traditional image-based ads.
- YouTube is expected to remain a major player in video marketing, with 2.85 billion monthly active users by 2025.
- The use of AI in video marketing will increase, with over 60% of marketers planning to use AI tools to personalize their videos.
- 88% of marketers believe that video has improved their return on investment (ROI). By 2025, live videos will make up about 25% of total internet traffic.
- The growth of virtual reality (VR) and augmented reality (AR) will change video marketing, with the market size expected to exceed $109 billion by 2026.
- Personalized videos will become very important for businesses, with over 80% of consumers saying they are more likely to engage with videos that speak directly to them.
- Research shows that 70% of consumers have shared a brand’s video on social media.
- According to Online Video Consumption Statistics, millennials and Gen Z are more likely to watch brand videos on social media rather than through traditional ads.
Most Popular Video On The Internet In 2024
| Type of video content | % of internet users that watch this type of video content |
|
Gaming video |
22.2% |
| Influencer videos and vlogs |
23.4% |
|
Sports match or commentary |
23.5% |
| Product review video |
25.3% |
|
Sports clip or highlights video |
25.7% |
| Tutorial or how-to Video |
25.8% |
|
Educational Video |
26.0% |
| Video live stream |
27.7% |
|
Comedy, meme, or viral videos |
35.0% |
| Music video |
48.2% |
|
Any video |
91.8% |
- Online Video Trends: Top 5 Types of Videos – Recent data shows that 91.8% of internet users worldwide watch digital videos every week. This includes all kinds of videos, such as music videos, tutorials, gaming content, and influencer videos.
Most Popular Video Types:
- Music Videos: Nearly 48.2% of internet users watch music videos at least once a week.
- Comedy and Viral Videos: About 35% of users enjoy comedy, memes, or viral videos.
- Live Streams: 27.7% of users watch live streams.
- Educational Videos: 26% of users view these videos.
- Tutorials or How-To Videos: 25.8% of users watch these types of videos.
Other Popular Video Types
- Product Review Videos: More than 25.3% of global consumers watch these weekly, which can be useful for e-commerce businesses.
- Influencer Videos and Vlogs: 23.4% of internet users watch these every week, which is helpful if you’re considering influencer marketing.
- Sports Videos: About 25% of users watch sports highlights or full matches.
- Gaming Videos: 22.2% of people watch gaming content.
- For eCommerce businesses, knowing these video trends can help you tailor your video marketing to your audience’s interests.
- For instance, since many people watch tutorials or how-to videos, creating videos that show how your products work could be a good investment, especially if your products are unique or hard to explain with just text or images.
- Live streams can also help build a community and strengthen your connection with customers.
General Online Video Marketing Statistics
- Statista says that spending on video marketing will reach $92.253 billion in 2024.
- Online Video Consumption Statistics stated that video marketing is growing faster than any other type of digital advertising.
- By 2024, video content will account for 82% of all internet traffic.
- Viewers remember 95% of the information when it’s presented in video form.
- Online Video Consumption Statistics research shows that 54% of people want to see video content from their favorite brands.
- Over 78% of viewers watch video content every week, and 55% of them engage with it daily.
- OptinMonster found that 72% of people prefer to learn about a product or service through videos.

(Reference: indirap.com)
- Webinars are the most common type of business video.
- Marketers get 66% more qualified leads with video marketing, as per Online Video Consumption Statistics.
- Online Video Consumption Statistics report that adding a video to a website’s landing page can boost conversions by 18%.
- Adding video to a webpage has been shown to increase the average time visitors spend there.
- Since 2016, the number of businesses using video for marketing has gone up by 41%.
- According to Wyzowl, 87% of marketers are satisfied with the return on investment (ROI) from video marketing.
- Marketers who use video see revenue growth 49% faster than those who don’t.
- If both text and video are available on a topic, 95% of executives would prefer to use video.
- Online Video Consumption Statistics stated that videos on social media are shared 12 times more than text and images combined.
- Currently, 86% of businesses use videos as part of their marketing strategy.
Most Famous Video Content Type Globally

(Reference: statista.com)
- In recent years, video has become one of the most popular online formats, covering everything from educational content to product reviews.
- In the first quarter of 2024, music videos had the highest reach, with almost 50% of internet users worldwide watching them online each week.
- YouTube and TikTok have become two of the top social media platforms for video content, which gets a lot of attention.
- In 2024, people around the world spent about 28.4 hours a month using the YouTube mobile app.
- On TikTok, popular hashtags have racked up billions of views as per Online Video Consumption Statistics.
- For example, by January 2024, the hashtag “fyp” (for you page) had 55 billion views, and “for you” had 35 billion views.
- In 2023, televisions were the most common devices for watching video-on-demand (VOD), with 55% of people using them. In comparison, only 13% of people used smartphones for this purpose.
- Device preferences vary by age. Younger users, especially those aged 18-34, are more likely to watch videos on smartphones.
- On the other hand, connected TVs are especially popular with viewers aged 35 and older.
Use of Artificial Intelligence In Video Marketing
- Three out of four video marketers have used AI to help make or edit their marketing videos.
- 59% of businesses say the best way to use generative AI for video marketing is to create captions and transcripts.
- Meanwhile, according to Online Video Consumption Statistics, 49.8% of businesses think the best use of generative AI is to generate scripts, outlines, or ideas
- Here is a table showing how businesses prefer to use generative AI.
| Usage of generative AI | A percentage of businesses |
| don’t use or plan to use AI tools for videos |
13.5% |
|
Helping create social promotion copy |
25.5% |
| Finding key clips to edit |
29.3% |
|
Generating visuals, music, or fixing overdubs |
35.1% |
| Generating a script, outline, or ideas |
49.8% |
|
Auto-generating captions or transcripts |
59% |
- In 2023, 85% of marketers said they think generative AI will change how content is made in 2024, and 62% believe it will become a crucial part of their marketing plans.
- Currently, 33% of businesses are already using AI to create videos, and 71% plan to start using it in the future.
- Additionally, 96% of video marketers have seen a positive return on their investment from using AI in their video marketing efforts.
Long-Form And Short-Form Video Statistics
- Videos that are 90 seconds or shorter keep 50% of viewers’ attention.
- 44% of people like short explainer videos better than long ones.
- 75% of short videos are watched on mobile devices.
Platform Usage:
- 61% of people use YouTube Shorts to find short videos.
- 56% use YouTube to find longer videos.
- Using both long videos (including live streams) and short videos together helps increase people’s recall of ads and recognition of brands.
- TikTok’s short videos are mostly popular with young people, 76% of whom are aged 18-24.
- YouTube attracts a wide range of ages, with about 24% of users aged 19-25 and 17% aged 30-39.
- More than 53% of Gen Z users watch long videos on social media.
- Online Video Consumption Statistics stated that around 83% of online marketers say short videos should be under 60 seconds.
- 44% of people prefer short videos or explanations when learning about a product.
Video Engagement Statistics
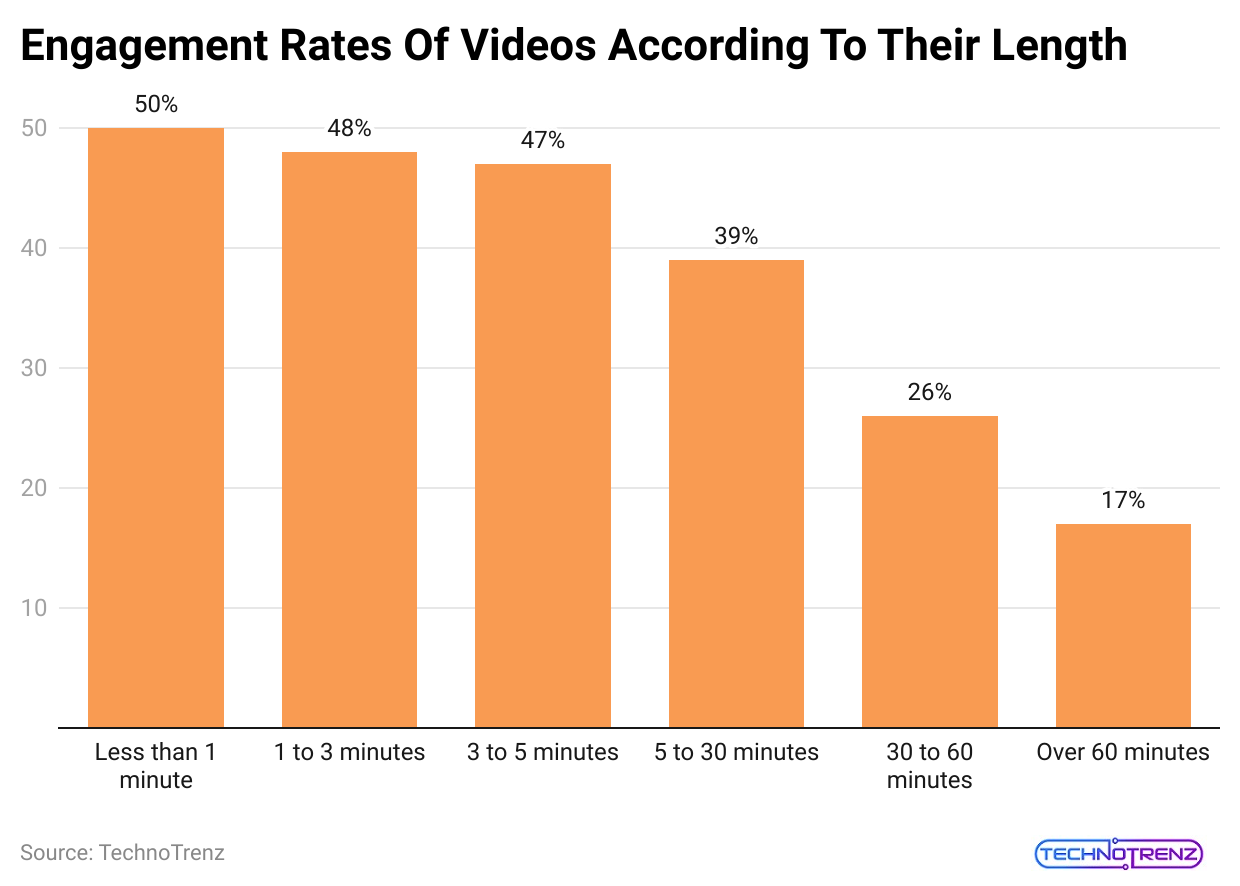
- Videos that are under 1 minute long have the highest engagement rates, while videos that are longer than 60 minutes have the lowest engagement rates.
- The table below shows how engagement rates differ based on video length.
(Reference: yaguara.co)
| Length of Video | Engagement Rates |
|
Over 60 minutes |
17% |
| 30 to 60 minutes |
26% |
|
5 to 30 minutes |
39% |
| 3 to 5 minutes |
47% |
|
1 to 3 minutes |
48% |
| Less than 1 minute |
50% |
- Companies using Wistia to host their videos experienced a 15% boost in the number of times their videos were played and a 44% increase in total watch time.
- Videos that are more than 60 minutes long have the highest pay rates.
- Here’s a table showing play rates for videos of different lengths.
| Length of Video | Play Rates |
|
Over 60 minutes58% |
Over 60 minutes58% |
| 30 to 60 minutes |
50% |
|
5 to 30 minutes |
35% |
| 3 to 5 minutes |
17% |
|
1 to 3 minutes |
12% |
| Less than 1 minute |
23% |
- Videos that are over 60 minutes long have the highest conversion rates, at 13%. In contrast, videos that are less than one minute long have the lowest conversion rate, just 1%.
- Videos that last more than 5 minutes tend to have higher conversion rates.
- Here is a table showing conversion rates based on the length of the videos.
| Length of Video | Conversion Rates |
|
Over 60 minutes |
13% |
| 30 to 60 minutes |
8% |
|
5 to 30 minutes |
11% |
| 3 to 5 minutes |
2% |
|
1 to 3 minutes |
4% |
| Less than 1 minute |
1% |
Online Users’ Views On Video Marketing
- 72% of consumers prefer learning about products and services through videos.
- People are three times more likely to watch a video tutorial on YouTube than read a text-based manual.
- Nearly 54% of email subscribers like emails that include video content.
- 91% of users want to see more video marketing from businesses.
- Online Video Consumption Statistics stated that almost 45% of users want to see more live video content on social media.
- 66% of consumers find short-form videos more engaging than long-form ones on social media.

(Reference: websiteplanet.com)
- Viewers are 35% more likely to keep watching a personalized video compared to a non-personalized one.
- 87% of users believe that video quality impacts how much they trust a brand.
- Online Video Consumption Statistics stated that around 65% of users skip online video ads if given the option.
- 87% of business-related videos are watched on desktop computers.
- Over 90% of people find new brands on YouTube.
- 80% of users alternate between online searches and video content when researching products.
Social Media Video Marketing Statistics
- Almost 17% of businesses use live streaming in their social media marketing campaigns. Live streaming helps build trust and credibility with customers, but only a small number of businesses are using it.
- 16% of people who watch social media videos use vlogs to research products. While vlogs can be used for many things, only a small portion of users turn to them for product information.

(Source: techreport.com)
- 73% of social media users prefer watching entertaining videos over educational or business content. Most people skip content that isn’t fun or engaging.
- Videos posted on social media get 48% more views than other types of content. This is because people are more likely to watch video content.
- Online Video Consumption Statistics stated that around 88% of marketers use YouTube to share videos.
- YouTube is the most popular platform for video marketing, making it a top choice for promoting products.
- YouTube Video Marketing Statistics

(Reference: backlinko.com)
| Country | YouTube Viewers |
|
Canada |
31.9 million |
| Bangladesh |
33.6 million |
|
Thailand |
44.2 million |
|
Italy |
42.8 million |
| Spain |
39.7 million |
|
Egypt |
44.7 million |
| South Korea |
44.3 million |
|
Turkey |
57.5 million |
| UK |
56.2 million |
|
France |
50.7 million |
| Pakistan |
71.7 million |
|
Germany |
67.8 million |
| Vietnam |
63 million |
|
Philippines |
58.1 million |
| Brazil |
144 million |
|
Indonesia |
139 million |
| Mexico |
83.1 million |
|
Japan |
78.6 million |
| India |
462 million |
|
USA |
239 million |
- YouTube is the top choice for Millennials when it comes to watching content. Its user-friendly design and vast range of videos make it very popular with this age group. Netflix comes in second with its large collection of mature films that Millennials enjoy.
- In 2021, YouTube users uploaded 500 hours of new content every minute. The COVID-19 lockdown caused many people to spend more time online, boosting the amount of content being uploaded.
- On average, YouTube users spend 17 minutes and 30 seconds watching videos each day. While some people spend less than an hour on the app, others may use it for more than three hours.
- YouTube has over 15 million content creators and more than 38 million active channels. This means that some creators run multiple channels. However, only about 22,000 channels have over 1 million subscribers.
- In 2023, live streaming on YouTube increased by 45%. As the pandemic worsened, more people turned to live streaming, leading to a significant rise in live video content.
#1. LinkedIn Video Marketing Statistics
- Around 80% of videos on LinkedIn are watched without sound. Many of these videos are designed with text on the screen so that viewers can understand the audio without the audio.

(Source: techreport.com)
- The best length for LinkedIn videos used in ads and posts is between 30 to 90 seconds. Videos within this time range perform the best on the platform.
- LinkedIn users share posts 20 times more often than on other social media sites. This high share rate helps ensure that posts reach the right audience, whether potential clients or brands.
- Live LinkedIn streams get seven times more engagement than regular videos. People find live streams more engaging and educational, leading to higher interaction rates.
#2. Facebook Video Marketing Statistics
- 85% of videos on Facebook are watched without sound. Most Facebook videos have captions, so viewers can understand them even if they don’t turn on the sound.
- Facebook live streams receive three times more engagement than regular videos. People prefer watching live events as they happen rather than pre-recorded ones.

(Reference: bloggingwizard.com)
- Facebook gets over 8 billion video views every day, and this number is likely to increase due to its large number of users.
- Over 75 million people visit Facebook Watch each day. Out of the many Facebook users, 75 million go to Facebook Watch every day and spend about 20 minutes watching videos.
- Around 71% of Facebook content comes from accounts with more than 100,000 followers. Accounts with a large number of followers post more often, and their high engagement encourages them to continue sharing content.
#3. Instagram Video Marketing Statistics
- 60% of Instagram Story viewers use sound. Research shows that most people prefer watching Instagram Stories with the sound on, and about 40% of viewers watch without worrying about the sound.

- The number of Instagram picture post views has gone up by 80% since 2021. The number of people viewing Instagram photos has grown significantly since mid-2022 and remains high.
- One out of every three top Instagram Stories is from a business profile.
- Business accounts are becoming very popular, with many of the most-watched Stories coming from these profiles. This trend is expected to continue growing.
- Online Video Consumption Statistics stated that using stickers on Instagram Stories increases views by 83%.
- Adding stickers to your Stories can boost the number of views by 83%, as stickers attract more attention and help your Stories reach more people.
- Instagram videos get twice the engagement of photo posts. If you want more interactions on your Instagram posts, videos are twice as effective as photos.
#4. TikTok Video Marketing Statistics
- In 2022, TikTok had over 1 billion views every day. TikTok attracted more than 1 billion daily views. Users found the platform’s short and engaging videos very appealing, with some individuals watching over 50 videos in a single day.

(Reference: techreport.com)
- 66% of marketers who used TikTok achieved success. TikTok has proven to be a fruitful platform for many marketers.
- About 66% of them reported successful results, while the remaining 44% felt they needed to put in more effort to capitalize on the platform fully.
- 68% of TikTok users watch videos from others. Most TikTok users prefer watching videos created by others rather than uploading their own.
- Although 55% of users create content, 68% watch videos made by others.
- TikTok has over 800 million users. The company’s user base has surpassed 800 million, and experts believe this number will continue growing quickly shortly.
- The average TikTok user in the US spends about 7 hours a day on the app. This time is often divided into several 45-minute sessions throughout the day.
#5. X(Twitter) Video Marketing Statistics
- Using Video Website Cards on X can boost your retention by 60%.
- This tool works well with the platform’s algorithm, helping to increase how long viewers stay engaged as per Online Video Consumption Statistics.
- 90% of videos on X are watched on mobile devices. This is because most people use their phones to watch videos on X, making it easier to access and use.
- X gets about 2 million video views each day, even though it is mainly a blogging platform.
- Video Website Cards on X get twice as many clicks as regular video ads.
- Ads with Video Website Cards have click-through rates that are two times higher than those of standard video ads.
Video Marketing Usage Statistics
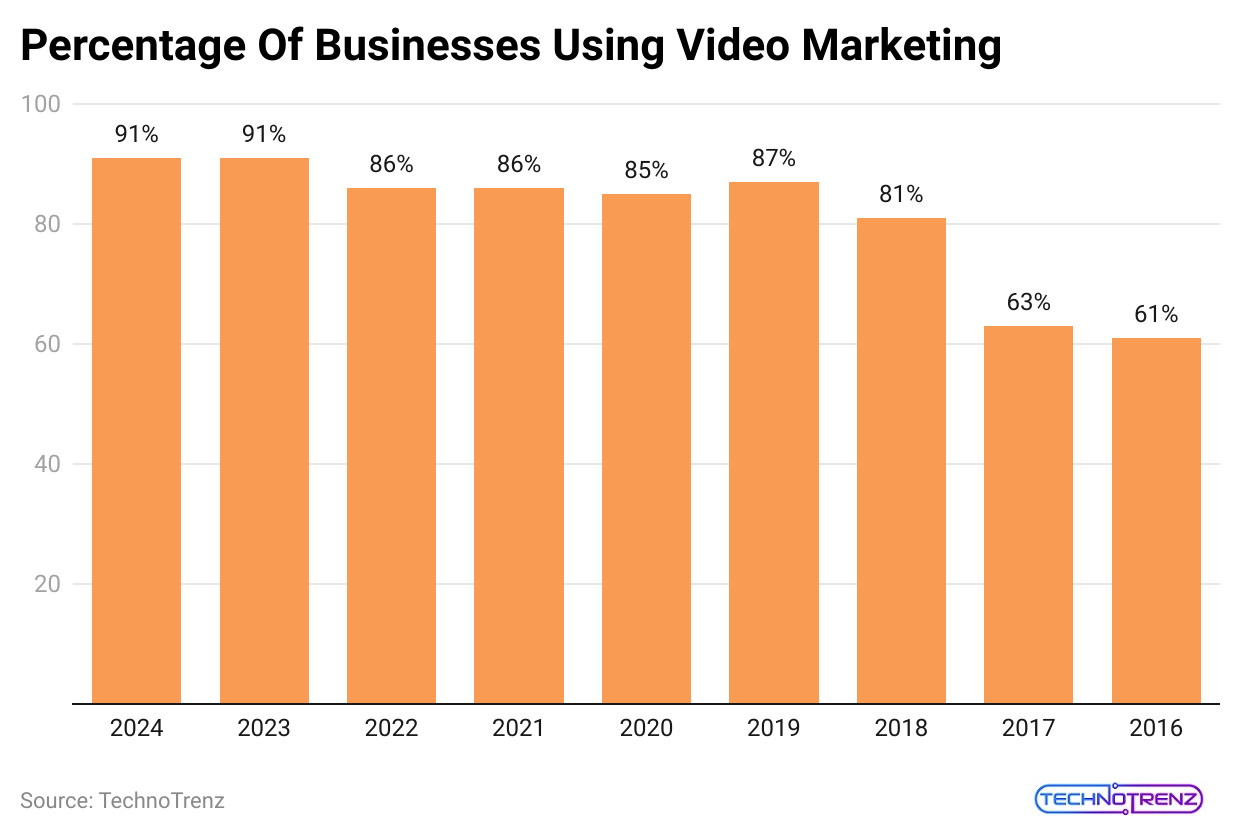
- According to Online Video Consumption Statistics, as of 2024, 91% of businesses worldwide use video for marketing, the highest percentage ever recorded.
For comparison:
- 85% of businesses used video for marketing in 2020.
- 61% of marketers used video for marketing in 2016.
Here’s a table showing how the use of video marketing has changed over the years:
(Reference: yaguara.com)
| Year | % of businesses using video marketing |
|
2016 |
61% |
| 2017 |
63% |
|
2018 |
81% |
| 2019 |
87% |
|
2020 |
85% |
| 2021 |
86% |
|
2023 |
91% |
| 2024 |
91% |
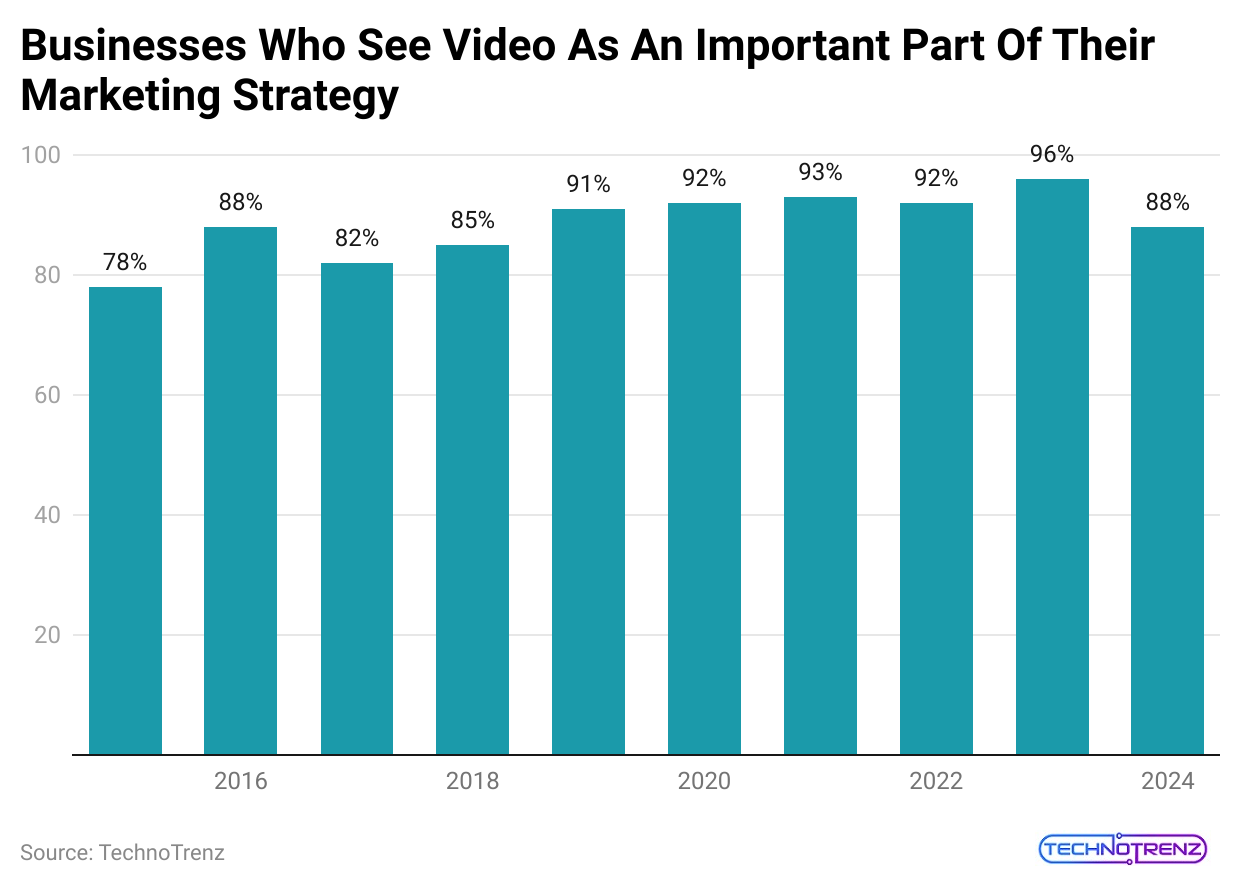
- 93% of businesses say that video marketing is essential to their marketing plan. In 2024, 88% of video marketers also believe that video is a vital part of their strategy. This is a drop from 96% who thought the video was crucial before.
- Here is a table showing the percentage of video marketers who see video as an important part of their marketing strategy:
| Year | Share of business |
|
2015 |
78% |
| 2016 |
88% |
|
2017 |
82% |
| 2018 |
85% |
|
2019 |
91% |
| 2020 |
92% |
|
2021 |
93% |
| 2022 |
92% |
|
2023 |
96% |
| 2024 |
88% |
- Online Video Consumption Statistics stated that almost 68% of marketers need to start using video marketing plans by 2024.
- 90% of marketers say that videos have helped them increase brand awareness as of 2024.
- Nearly 40% of video marketers are making testimonial videos this year. Testimonial videos are the most common type of video used in marketing, followed by explainer videos.
The table below shows how marketers are using video:
| Use cases of video | % of videos |
|
App demo videos |
22% |
| Staff training videos |
22% |
|
Customer service videos |
28% |
| Videographic |
25% |
|
Employee onboarding videos |
25% |
| Customer onboarding videos |
22% |
|
Product demo videos |
32% |
| Sales videos |
30% |
|
Teaser videos |
30% |
| Video ads |
30% |
|
Product demo videos |
32% |
| Testimonial videos |
39% |
|
Explainer videos |
38% |
| Social media videos |
34% |
|
Presentation videos |
34% |
- 86% of marketers say that videos have helped increase their website traffic, compared to 91% in 2023.
- 87% of marketers report that video marketing has helped them get more leads and significantly boost their sales in 2024.
- Online Video Consumption Statistics stated that almost 82% of marketers find that videos keep visitors on their websites for longer periods.
- 66% of marketers state that using videos has helped cut down on support questions, which is a record high and represents a 13% increase from before.
- The table below shows the percentage of marketers who have experienced fewer support queries over the years.
| Year | % of marketers |
|
2015 |
30% |
| 2016 |
36% |
|
2017 |
53% |
| 2018 |
47% |
|
2019 |
41% |
| 2020 |
43% |
|
2021 |
43% |
| 2022 |
49% |
|
2023 |
53% |
| 2024 |
66% |
Video Marketing ROI Statistics
- According to 90% of marketers, video marketing offers a good return on investment (ROI). This trend has been steady over the years, reaching a high in 2023, when 92% of marketers said they saw a good ROI from video marketing.
- To measure the success of their video marketing campaigns, 60% of marketers look at video engagement.
- Additionally, 42% focus on audience engagement, and 40% use the number of video views as a measure of success.
- According to Online Video Consumption Statistics, 39% of marketers believe that videos lasting between 30 and 60 seconds provide the best ROI.
- In comparison, 28% find that videos lasting 1 to 2 minutes are the most effective.

(Reference: keywordseverywhere.com)
- Besides providing a good return on investment (ROI), 88% of marketers say that video has helped their customers better understand their product or service.
- Videos like product demos, explainer videos, and testimonials are effective at educating potential customers.
- For building brand awareness, 90% of marketers have seen increased recognition through video marketing.
- In 2024, video views for small and medium-sized businesses increased by 13% and by 5% for large businesses.
- The education industry has the highest video view rate at 46%, followed by the media industry at 44%. The healthcare and services industries have a much lower view rate of 11%, as per Online Video Consumption Statistics.
- Video marketing also boosts traffic to a company’s social media pages and websites. According to 86% of marketers, videos are effective in driving more traffic to their websites.
- For A/B testing, 31% of marketers experiment with different versions of their videos, such as varying lengths, introductions, and music.
- 87% of marketers say that video has helped them generate leads, showing that videos are a great way to attract potential customers and spark interest in their products or services.
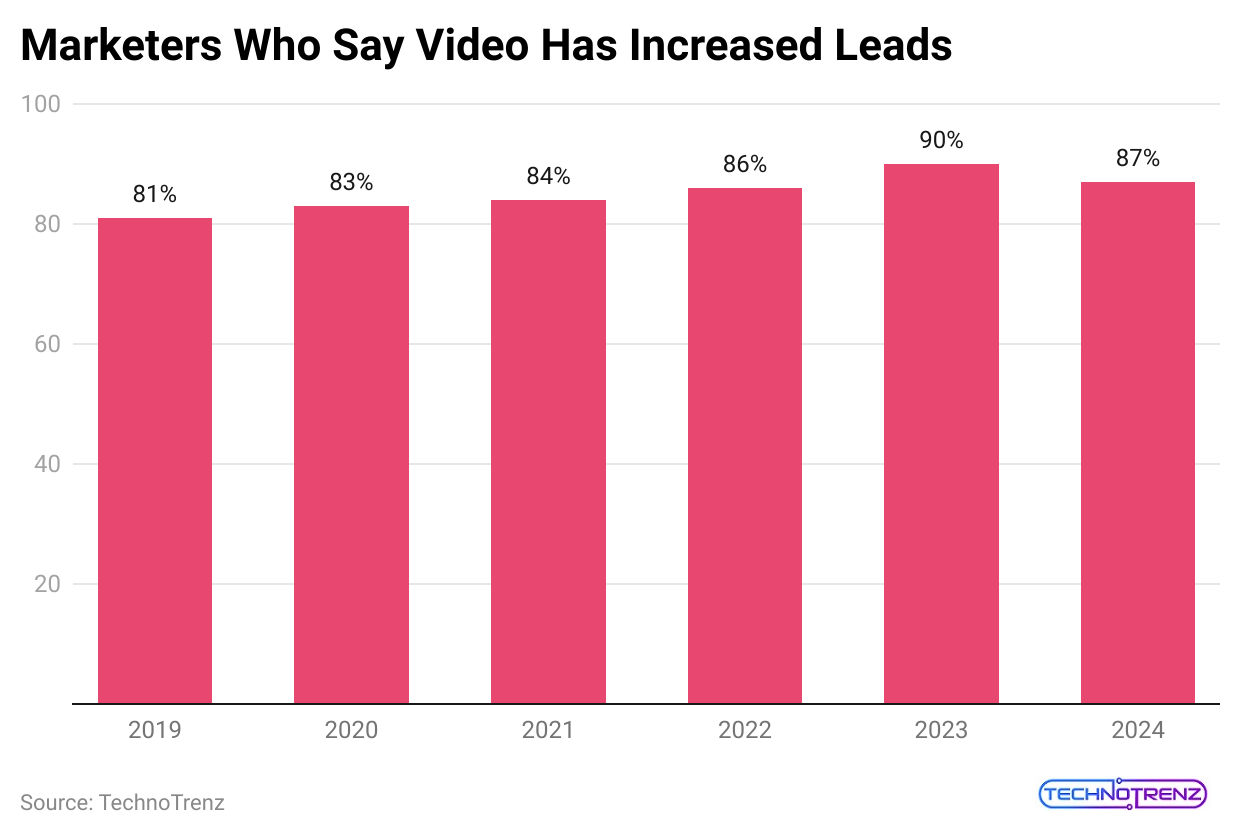
(Reference: keywordseverywhere.com)
- 87% of marketers have noticed a direct boost in sales from using videos.
- In recent years, video marketing has also improved customer service. 66% of marketers say their video efforts have cut down the number of customer questions and inquiries, as per Online Video Consumption Statistics.
- Videos shorter than 1 minute have a 50% engagement rate. As the video length increases, engagement drops, going down to 17% for videos that are close to 60 minutes long.
| Video length | Engagement rate | Average time watched |
|
<1 minute |
50% | 0:00:16 |
| 1-3 minutes | 48% |
0:00;54 |
|
3-5 minutes |
47% | 0:01:50 |
| 5-30 minutes | 39% |
0:04:59 |
|
30-60 minutes |
26% | 0:11:32 |
| >60 minutes | 17% |
0:16:40 |
- 49% of marketers say that the CTA (call-to-action) button is the most effective feature for getting high video conversions.
- On the other hand, 19% find that an email collection form works best for this purpose.
- The highest conversion rate, at 13%, is seen with videos that are about 60 minutes long.
- In contrast, short videos have a much lower conversion rate, between 1% and 4%.
Video Marketing Benefits And Effectiveness
- 87% of marketers believe video delivers a positive return on investment (ROI).
- With such a high percentage of marketers seeing positive results, video marketing is a worthwhile investment.
(Reference: wyzowl.com)
| Year | %Companies |
|
2015 |
78% |
| 2016 |
88% |
|
2017 |
82% |
| 2018 |
85% |
|
2019 |
91% |
| 2020 |
92% |
|
2021 |
93% |
| 2022 |
92% |
|
2023 |
96% |
| 2024 |
88% |
- 74% of marketers believe video offers a better return on investment (ROI) than static images.
- Static images include any visual content that doesn’t move, such as infographics and photos.
- Online Video Consumption Statistics stated that almost 68% of marketers think video provides a better ROI than Google Ads.
- This means that video content might give you better returns for each dollar spent compared to paid ad campaigns.
- Over 60% of marketers view video as very or extremely important to their marketing strategy.
- This comes from a recent survey of 694 marketers and small business owners.

(Reference: bloggingwizard.com)
- 63% of marketers use engagement metrics like shares, comments, and likes to measure video performance. However, 58% think overall reach is the most important success factor, and only 29% use sales as a key measure.
- Online Video Consumption Statistics stated that around 84% of video marketers say that videos have helped them find and attract potential customers, bringing them into the sales process.
- 86% of video marketers report that videos have increased traffic to their websites, which is a 1% improvement from last year.
- 53% of marketers believe that video is great for increasing brand awareness and reaching a wider audience.
- Almost half (49%) of marketers think video is very effective in keeping audiences engaged.
- 52% of marketers feel that video helps build trust with customers, which is important for creating lasting relationships.
- According to Online Video Consumption Statistics, 83% of marketers have found that videos help keep visitors on their web pages longer, making them more engaged than just text.
- A large 94% of marketers believe that videos improve customers’ understanding of their business through explainer videos, how-to guides, and product tutorials.

(Reference: wyzowl.com)
- 78% of video marketers think that videos have had a direct positive effect on their sales. Even though most don’t use sales numbers to measure video success, this shows that videos can still help increase sales.
- 43% of video marketers believe that videos have cut down on the number of customer support calls. Providing how-to videos and tutorials on your website can give customers the help they need and reduce the demand for phone support.
Live Streaming Video Statistics
- About 4 million people are expected to watch live videos in 2024.
- Because of the pandemic, the audience for live videos increased from 126.7 million to 150 million viewers.
- 45% of users want to see more live video content on social media.
- Online Video Consumption Statistics stated that almost 52% of people around the world want to watch live branded videos.
- Only 36% of online marketers include live streams in their social media plans, making it an underused tactic.
- Just 14% of online marketers think live video is their most important type of video, with most preferring native video.
- One-third of online users watch more live video streams each week than any other kind of video.
- 37% of US livestream viewers aged 18 to 34 use YouTube as their preferred platform.
- Some content creators earn between $20 and $300 per live video on popular platforms.
- Younger streamers find it easier to make money from live streaming. About 50% of streamers aged 18-34 earn revenue, while only 10% of those aged 55 and older do.
Video Consumption Statistics
- American adults now spend about 3 hours and 50 minutes each day watching videos online, which is 55 minutes more than they spend watching traditional TV. This shows that businesses and content creators need to focus more on online platforms rather than just TV.
- In 2024, Americans are spending more time on TikTok (58.4 minutes) than on YouTube (48.7 minutes). This shows how popular short videos are and suggests that businesses should consider including TikTok in their marketing strategies.
- Netflix still has the most daily viewing time, with users watching for 62.1 minutes each day. This shows that streaming services are still very popular, and businesses should think about how to use platforms like Netflix to reach their audience.

(Reference: keywordseverywhere.com)
- About 241.8 million people in the US use YouTube, making it the second-most popular video platform after streaming services like Netflix, according to Online Video Consumption Statistics.
- In 2024, a survey found that 58% of US adults aged 18 to 34 watch digital videos on their devices every day. Meanwhile, 28% of adults aged 35 to 54 watch digital videos on their devices at least once a week.
- People around the world spend an average of 17 hours watching videos each week.

(Reference: keywordseverywhere.com)
Conclusion
Video marketing is now popular across many industries and is growing worldwide. Brands believe it helps increase sales, engagement, awareness, and more. People, especially younger ones, prefer watching videos instead of reading text or looking at pictures. This is why blogs with only text often get less attention. Posting video clips can increase your page views and make your business more visible, helping you attract more clients.
Because of this, more brands are using video marketing for their advertising and promotions. Going live can also boost interest and engagement from potential buyers. The information above shows how video marketing can greatly benefit your brand.
Sources
- Hubspot
- Synthesia
- Sixthcitymarketing
- Wyzowl
- Vidico
- Thesocialshepherd
- Dash
- Oberlo
- Hubspot
- Quickframe
- Statista
- Enterpriseappstoday
- Statista
- Socialpilot
- Backlinko
- Charleagency
- Colorwhistle
- Cambridgefilmworks
- Keywordseverywhere
- Twicsy
- Wistia
- Personifycorp
- Lambdafilms
- Webfx
- Optinmonster
- G2
- Indirap
- Statista
- Herenow
- Thriveagency
- Sagapixel
- Lemonlight
- Lemonlight
- Creativemarketingltd
- Sproutsocial
- Gudsho
- Demandsage
- Rankingbyseo
- Meetanshi
- Winsavvy
- Sprinklr
- Wordstream
- 90Seconds
- Kapwing
- Hourone
- Gitnux
- Thebrandshopbw
- Medium
- Techreport
- Plainlyvideos
- Contentkrush
- Yaguara
- Bloggingwizard
- Dme
- Buzzflick
- Vpnalert
- Zight
- Serpwatch
- Cincopa
- Skillademia
- Fastercapital
- Foundationinc
- Thetradeshownetwork
- Beverlyboy
- Digitalstudioindia
- Financesonline
- Cloudincome
- Winsavvy
- Liveyourmessage
- Superside
- Yaguara
- Lovo
