


Introduction
Smart Home Devices Statistics: Smart home devices make life easier, safer, and more comfortable by allowing users to control lights, temperature, door locks, and security cameras anytime, anywhere with a tap on their phone or a voice command. These devices are connected to the internet and work together to help people control their homes more efficiently.
From smart speakers and bulbs to thermostats, locks, and appliances, there’s something for every home and budget. But before the user purchases, it’s important to consider privacy, device compatibility, and cost.
This article includes several statistical analyses and insights that will help you understand what smart home devices are, how they work, and how to choose the right ones for your needs.
Editor’s Choice
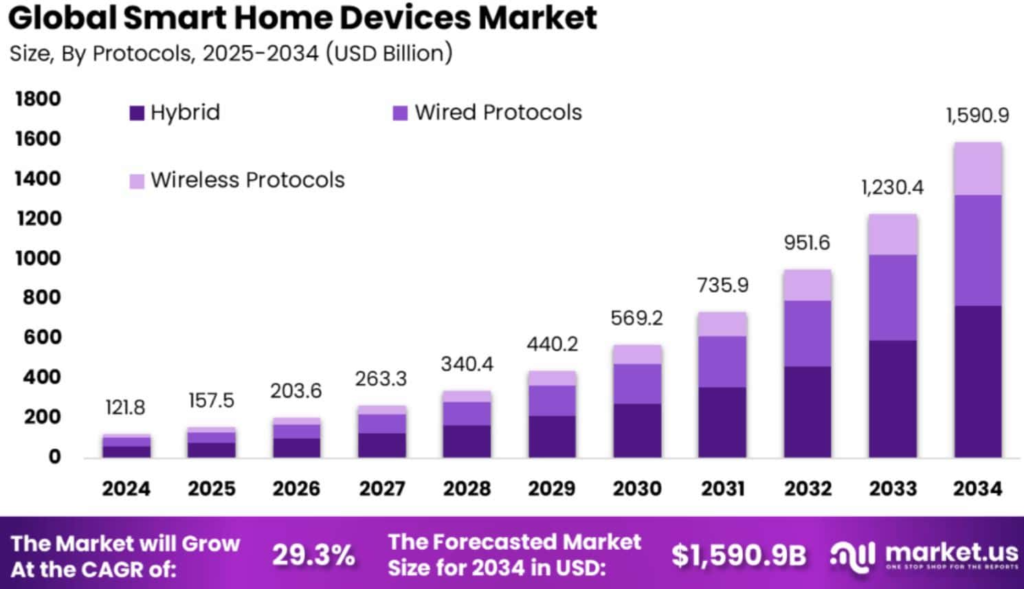
- The global smart home devices market is expected to reach USD 203.6 billion by 2026, up from USD 157.5 billion in 2025.
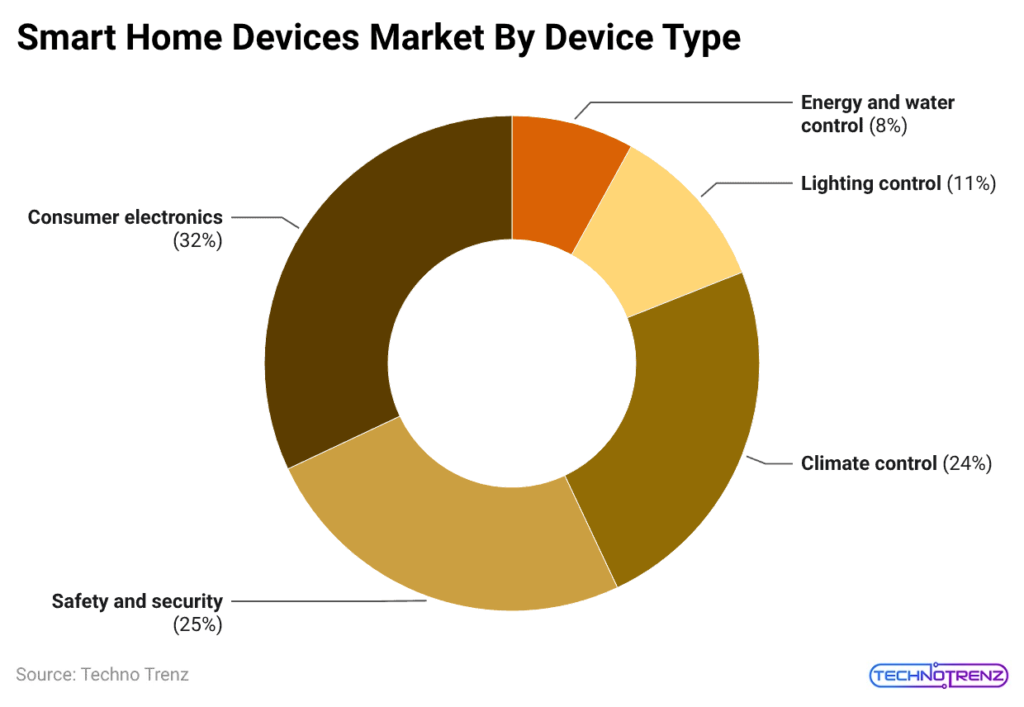
- In 2025, Consumer electronics accounted for the largest share at 32%, indicating that entertainment and general smart gadgets drive demand.
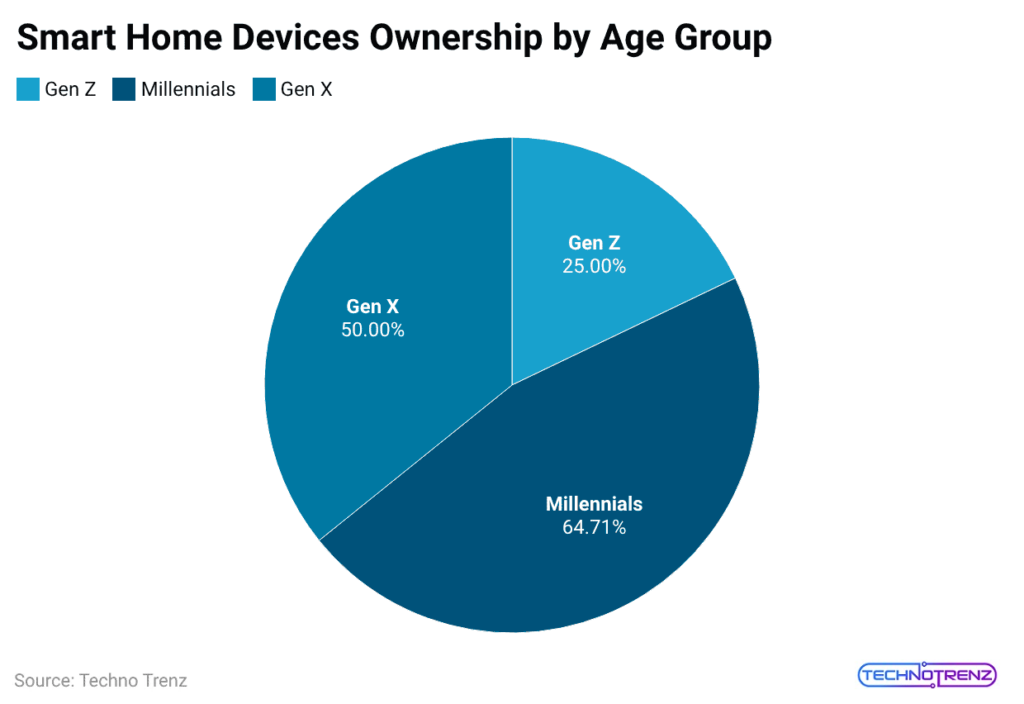
- Millennials have the highest rate of smart home device ownership at 64.71%.
- In the living room, smart speakers lead at 35.6%, followed by televisions (25.7%), current-generation gaming consoles (25.0%), screen hubs (21.5%), remotes (9.1%), and robot vacuums (6.6%).
- North America’s smart home market reached USD 49.99 billion in 2025 and is projected to increase to USD 54.83 billion in 2026.
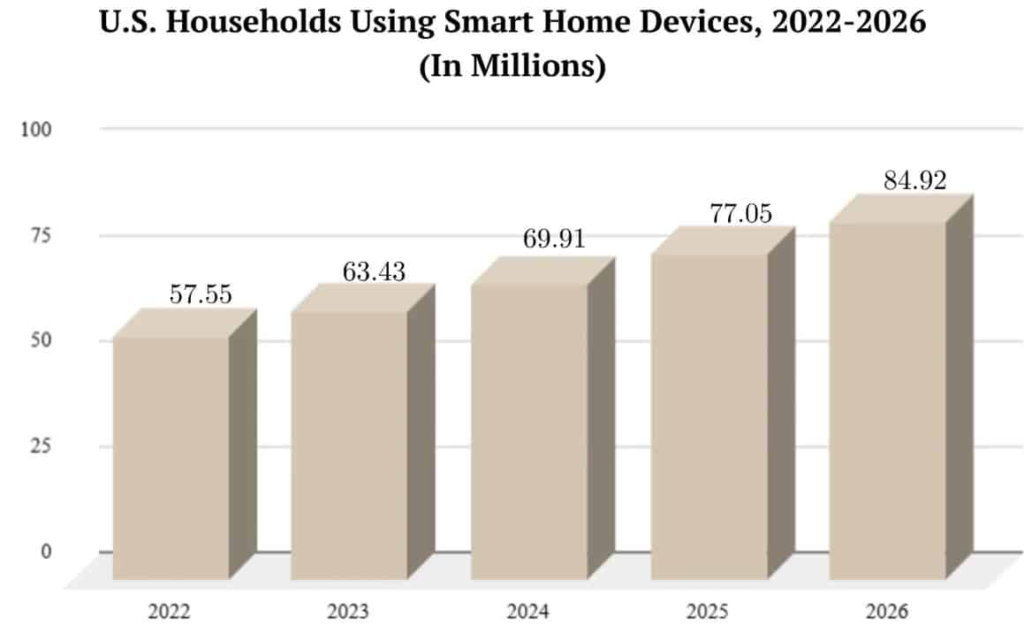
- In 2026, almost 84.92 million U.S. households used smart home devices, an increase of 7.87 million (10.21%) from 2025.
- Smart TVs are expected to remain the most-used smart-home device in 2026, with smart TV ownership estimated at approximately 75% (roughly 101.1 million U.S. households).
- Smart speakers and smart displays will hit 154.3 million units in 2025, marking about 4% YoY growth.
- In 2025, Nest was the leading smart home brand, preferred by 37.50% of users.
- 49% of connected-device users report at least one privacy or data-security incident.
Key Takeaways
- According to Market.us, consumer electronics (such as smart speakers and home entertainment systems) accounted for approximately 37% of the global smart home devices market.
- The U.S. smart home market is projected to reach USD 54.53 billion by 2026.
- Only 7 in 10 homebuyers say they are actively looking for a smart home when shopping.
- Approximately 78% of homebuyers report being willing to pay more for a home that includes smart home features.
- Security & Access Controls lead at (29.4%), hybrid systems (48.3%), and retrofits (65.7%) indicate that most buyers upgrade existing homes for safety and flexibility.
- North America accounted for 28.9% of the market, and the U.S. drives growth with USD 31.68 billion in revenue and a 27.1% CAGR.
Smart Home Devices Market Size
(Source: market.us)
- The global smart home devices market is expected to reach USD 203.6 billion by 2026, up from USD 157.5 billion in 2025.
- By 2034, the market is estimated to reach approximately USD 1,590.9 billion, growing at a CAGR of 29.3% from 2026 to 2034.
- In the United States, the market size is expected to be around USD 51.2 billion by 2026.
By Device Type
(Reference: site-static.com)
- In 2025, Consumer electronics accounted for the largest share at 32%, indicating that entertainment and general smart gadgets drive demand.
- Safety and security accounted for 25%, followed by climate control (24%), lighting control (11%), and energy and water control (8%).
By Ownership
(Reference: market.us)
- The chart above shows that Millennials have the highest rate of smart home device ownership at 64.71%.
- Gen X has a mid-level ownership rate at 50%, followed by Gen X at 25%.
By Category
- According to reviews.org, smartphones are the most used personal smart device at 85%, followed by headphones (32.5%), smartwatches (26.0%), tablets with voice control (23.5%), tablets without voice control (23.4%), fitness trackers (18.9%), and digital cameras (11.8%).
- In the living room, smart speakers lead at 35.6%, followed by televisions (25.7%), current-generation gaming consoles (25.0%), screen hubs (21.5%), remotes (9.1%), and robot vacuums (6.6%).
- In the kitchen, smart fridges lead at 4.7%, followed by dishwashers and ovens at 4.2% each, microwaves at 4.1%, coffee makers at 3.4%, and kitchen scales at 3.3%. In contrast, other smart devices (like faucets, pet feeders, thermometers, ice machines, herb gardens, air fryers, blenders, slow cookers, and sous vide) each range from 1.5% to 2.5%.
- Smart washers lead bathroom and laundry adoption at 5.2%, followed by smart dryers (4.1%) and smart toothbrushes (3.6%), while mirrors and skincare systems (2.0% each) and shower heads (1.9%), bidets (1.8%), and toilets (1.7%) see lower usage.
- Smart fitness scales accounted for 5.2% of health-and-fitness device use, followed by smart home gyms at 2.5%, with smart treadmills and smart exercise bikes tied at 2.0% each.
- In safety and home security, video doorbells lead at 14.6%, followed by outdoor cameras (12.3%), indoor cameras (9.3%), motion detectors (8.9%), smart door locks (8.2%), smoke/CO detectors (7.6%), door/window sensors (7.2%), and smaller shares for security hubs (4.8%), air-quality monitors (4.6%), leak/moisture sensors (2.7%), pet monitors (2.7%), and child monitors (2.6%).
By Region
- North America’s smart home market reached USD 49.99 billion in 2025 and is projected to increase to USD 54.83 billion in 2026, according to Mordor Intelligence.
- By 2026, Europe will reach USD 24.44 billion, Asia-Pacific will surge to USD 77.88 billion, Latin America will reach USD 3.82 billion, and the Middle East & Africa will climb to USD 20.10 billion.
Smart Home Devices Adoption Statistics
(Source: shopify.com)
- In 2026, almost 84.92 million U.S. households used smart home devices, an increase of 7.87 million (10.21%) from 2025.
- From 2022 to 2026, the number of smart home device users increased by 27.37 million households (47.56%), implying an average annual growth rate of approximately 10.22%.
- Approximately 51.37% of U.S. homes have at least one smart device.
- The global smart home market was valued at USD 147.52 billion in 2025.
- This market is projected to reach around USD 500 billion by 2032.
- The U.S. market is projected to reach USD 43 billion, accounting for 29.17% of the global smart home market.
- In the U.S., the average revenue per installed smart home is USD 546.50.
- By 2027, 68.6% of U.S. homes will have smart home devices.
United States Smart Home Demand
- According to Ruby Home Luxury Real Estate, the U.S. smart home market is projected to grow from approximately USD 50.3 billion in 2025 to approximately USD 54.5 billion in 2026.
- By 2031, the market is expected to exceed USD 81.6 billion, supported by an estimated 8.4% compound annual growth rate.
- Approximately 7 out of 10 homebuyers report actively seeking a smart home when shopping.
- Around 78% of home buyers say they would pay more money to buy a smart home.
- Among renters, 82% want at least one smart home device, and 35% say having a smart device is “important” or “extremely important.”
Most Commonly Used Smart Home Devices
- Edison Research reports that Smart TVs are expected to remain the most-used smart-home device in 2026, with smart TV ownership estimated at approximately 75% (roughly 101.1 million U.S. households) among a total of 134.79 million households.
- According to safehome.org, security cameras are expected to remain among the most widely used smart-home device types, with industry estimates placing adoption at approximately 52% (roughly 68 million households).
- Smart speakers are likely to remain a leading smart-home devicewith estimated ownership at approximately 35% and an installed base of about 101 million users (U.S. population aged 12+).
- A report by Parks Associates further stated that Video doorbells are expected to remain widely used, with approximately 20% of U.S. internet households owning one, corresponding to approximately 27.0 million households, based on a proxy of 134.79 million total households.
- Smart lighting is growing but remains small: only 13% of households (17.5 million) have smart bulbs, and 6% (8.1 million) have controls in 2026.
- Smart door locks are expected to remain a leading category in the smart home market, with more than 12 million U.S. internet householdsreported to own one.
- Smart thermostats are expected to grow rapidly, with installations projected to reach 38.3 million by 2026, according to researchgate.net.
Smart TV
- According to Strategy Analytics’ forecast, smart TV penetration is expected to reach 51% of global households by 2026, representing roughly 1.1 billion homes owning at least one smart TV.
- According to Omdia, global TV shipments are forecast to increase slightly from 208 million units in 2025 to 210 million units in 2026.
- For 2026, regional TV shipment growth is projected to be positive in several mature markets, with Western Europe up 3.2%, Eastern Europe up 3.1%, and North America up 2.2%.
- In contrast, China is forecast to decline by -4.7% in TV shipments in 2026.
- Grand View Research estimates the global smart TV market size at USD 246.96 billion in 2025, and projects it will grow to USD 673.47 billion by 2033.
- According to the same source, the market is projected to grow at a 13.9% CAGR from 2026 to 2033.
- In 2025, the Asia-Pacific region accounted for the largest share, contributing over 40% of global smart TV revenue.
- During the same period, China led the global smart TV market, accounting for more than 45% of the global market share.
- By operating system, Android TV accounted for the largest share of revenue in 2025, at over 43%.
- By resolution, 4K Ultra High Definition (UHD) held the largest share in 2025, representing over 56% of the market.
- By screen size, smart TVs in the 46–55-inch range accounted for the largest share, at over 36%.
- By distribution channel, online sales accounted for the largest share, contributing over 58% of revenue.
- By technology, LED remained the leading category, holding over 50% of the market.
Smart Speakers/Displays
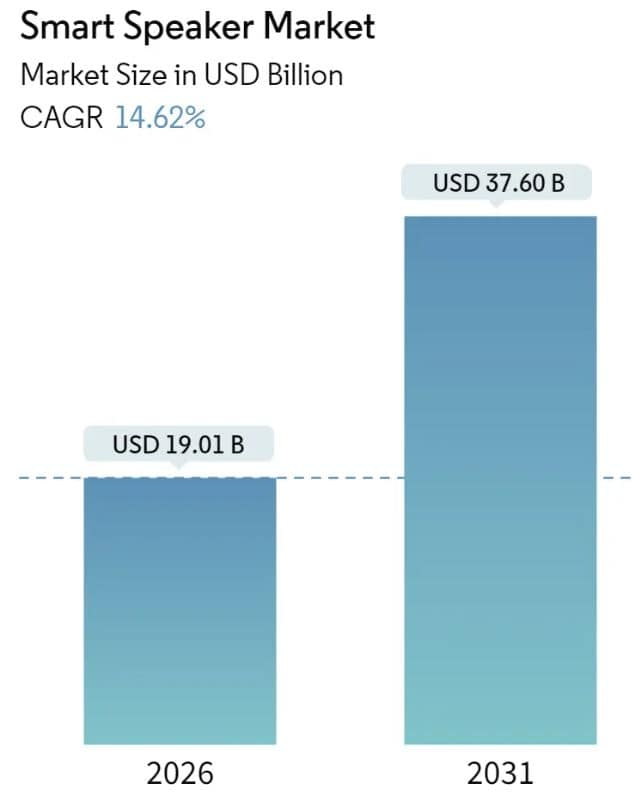
- TechInsights estimates global shipments of smart speakers and smart displays will hit 154.3 million units in 2025, marking about 4% YoY growth.
(Source: mordorintelligence.com)
- The smart speaker market is expected to grow from USD 19.01 billion in 2026 to USD 37.6 billion by 2031, at a strong 14.62% CAGR from 2026 to 2031.
- In 2025, the virtual assistant, Amazon Alexa, led the smart speaker market with a 36.12% share, while Apple Siri is expected to grow at a 16.56% CAGR through 2031.
| Segment | Largest Share, 2025 | Fastest-Growing Category CAGR (From 2026 to 2031) |
| Component | Hardware (80.55%) | Software (20.92%) |
| Connectivity | Wi-Fi (73.62%) | Bluetooth (17.96%) |
| Price Band | Low-price (47.88%) | Premium (18.58%) |
| Application | Smart home (68.72%) | Hospitality & healthcare (16.68%) |
| End-User | Residential (87.95%) | Commercial (21.96%) |
(Source: mordorintelligence.com)
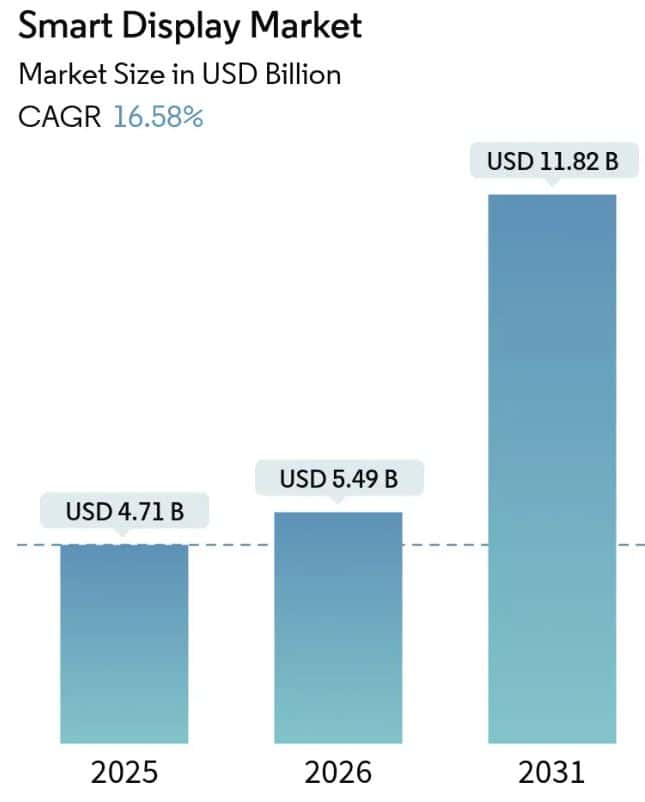
- The smart display market is projected to increase from USD 4.71 billion in 2025 to USD 5.49 billion in 2026.
- It is projected to reach USD 11.82 billion by 2031, growing at a strong 16.58% CAGR (2026-2031).
- In 2025, Amazon Alexa accounted for 33.12% of revenue, while Alibaba TmallGenie is projected to grow rapidly at an 18.38% CAGR through 2031.
| Segment | Largest Share, 2025 | Fastest-Growing Category CAGR (From 2026 to 2031) |
| Screen size | 5-10 inch (52.10%) | > 10-inch screens (18.92%) |
| Display technology | LCD (81.05%) | OLED (21.35%) |
| Resolution | Full HD (56.05% | 4K and above (22.98% ) |
| Installation type | Stand-alone (90.10%) | Integrated formats (25.74%) |
| Connectivity | Wi-Fi only (86.95% | Wi-Fi + Matter (22.41%) |
| End-user industry | Residential smart-home (73.95%) | Automotive dashboards (23.62%) |
| Geography | Asia-Pacific (37.42%) | Asia-Pacific (17.05%) |
Smart Doorbell
(Source: snsinsider.com)
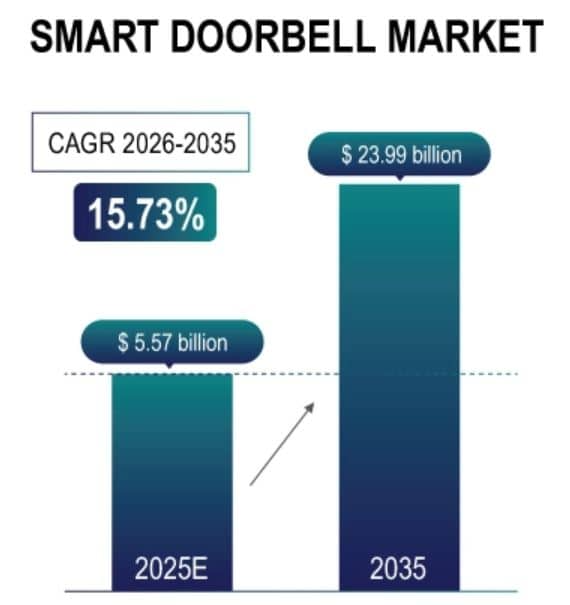
- The Smart Doorbell Market was valued at USD 5.57 billion in 2025 and is projected to reach USD 23.99 billion by 2035, growing at a CAGR of 15.73% from 2026 to 2035.
- The U.S Smart Doorbell Market size was valued at USD 1.44 billion in 2025 and is projected to reach USD 3.82 billion by 2035.
- According to Tom’s Guide, Wyze Battery Video Doorbell was launched in Oct 2025 and sells for USD 65.98; it records 1536×1536 video, covers 150°×150°, and has an IP65 weather rating. The Cam Plus plan costs USD 2.99/month (approximately 4.5% of the device price).
- A 2026 buyer guide reports that “top-tier” doorbells commonly use 2K (e.g., Nest Doorbell 3rd gen) and even 4K (e.g., Ring Wired Doorbell Pro 3rd gen) resolutions.
- Ring Battery Doorbell Pro is listed at USD 229.99 on the official store page.
- Aqara G410, positioned as the successor to the G4, is priced at USD 129.99 and offers 2K video, a 175° view, and end-to-end encryption.
Smart Door Locks
- A Coherent Market Insights report stated that the global smart door lock market was valued at USD 3.16 billion in 2025 and is projected to reach USD 10.43 billion by 2032.
- This growth represents a compound annual growth rate of 18.6% during 2025 to 2032.
- By product type, deadbolt smart locks are expected to be the largest segment, with an estimated 42.7% market share in 2025.
- By access method, keyless PIN smart locks are expected to be the top segment, with an estimated 34.3% market share in the same period.
- North America is projected to remain the leading region, accounting for approximately 35.2% of the market.
- The Asia-Pacific region is projected to grow the fastest, accounting for an estimated 31.5% share.
Smart Thermostat
(Source: precedenceresearch.com)
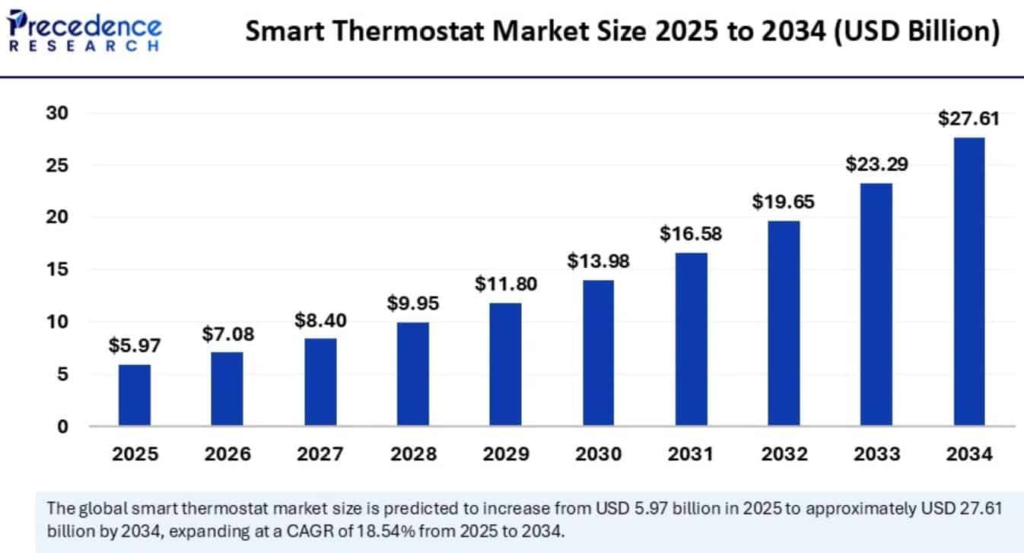
- The global smart thermostat market size is calculated at USD 5.97 billion in 2025. It is projected to increase from USD 7.08 billion in 2026 to approximately USD 27.61 billion by 2034, with a CAGR of 18.54% from 2025 to 2034.
- Research Nester estimated that the Asia-Pacific smart thermostat market will account for approximately 35% of the global market by 2035.
- By 2035, North America will account for 28% of the global market, while wireless connectivity will dominate smart thermostats, accounting for 58%.
- Climate control applications are projected to hold around 42% share during 2026-2035.
Robot Vacuum Cleaners
(Source: mordorintelligence.com)
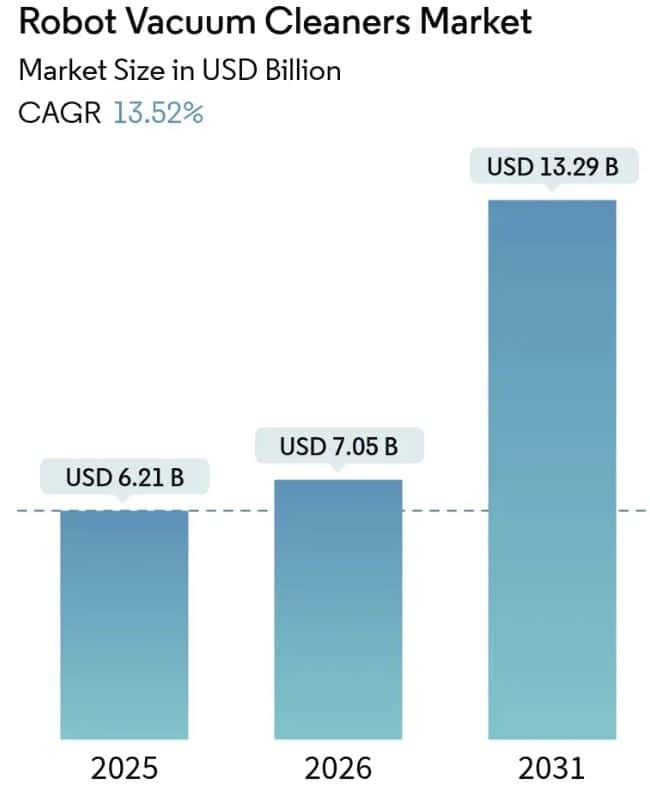
- The global robotic vacuum cleaners market is projected to be worth USD 7.05 billion by 2026.
- This represents growth from an estimated USD 6.21 billion in 2025.
- Looking ahead, the market is projected to reach USD 13.29 billion by 2031.
- Overall, this outlook implies a 13.52% CAGR during the 20260-2031 period.
| Segment | Largest Share, 2025 | Fastest-Growing Category CAGR (From 2026 to 2031) |
| Product type | Floor vacuum models (78.35%) | Hybrid 2-in-1 systems (16.6%) |
| End-user | Residential (90.25%) | Commercial hospitality (14.95%) |
| Battery type | Lithium-ion packs (93.70%) | High-density variants (13.55%) |
| Connectivity | Smart-connected units (67.60%) | Smart-connected units (16.05%) |
| Price range | USD 200-499 (52.45%) | Premium USD 500+ models (14.35%) |
| Distribution channel | Online marketplaces (64.10%) | Brand e-commerce sites (17.65%) |
| Region | Asia Pacific (40.70%) | Middle East (18.3%) |
Smart Furniture
(Source: mordorintelligence.com)
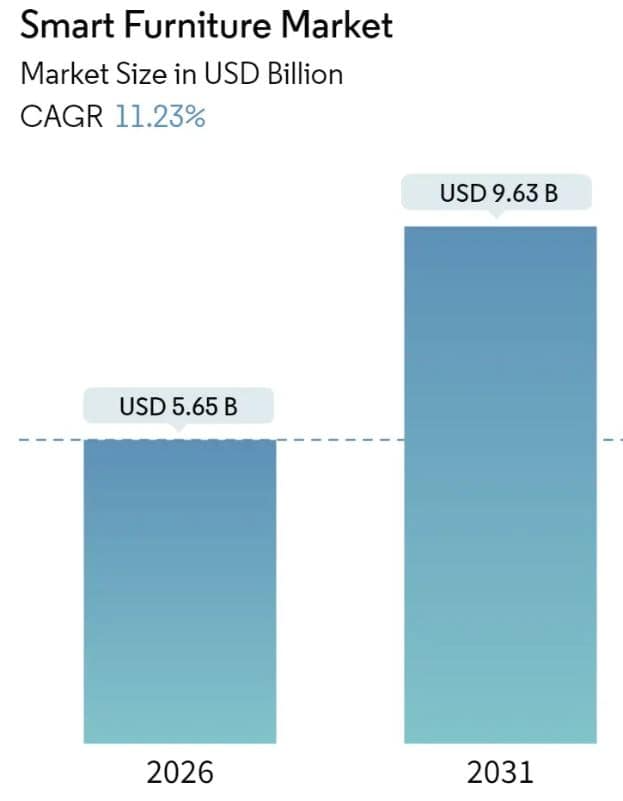
- The Smart Furniture Market was valued at USD 5.08 billion in 2025 and is projected to increase from USD 5.65 billion in 2026 to USD 9.63 billion by 2031.
- This market is expected to grow at a 11.23% CAGR over the 2026-2031 period.
- In 2025, home furniture held the largest share of the smart furniture market at 66.98%, and this segment is expected to continue growing at a 12.05% CAGR through 2031.
- Wood remained the leading material in the smart furniture market, accounting for 41.85% of the market. At the same time, plastics and polymers are projected to be the fastest-growing materials, expanding at an 11.66% CAGR from 2026 to 2031.
- B2C/retail-led smart furniture sales, accounting for a 70.22% market share, and is projected to grow at a strong 12.40% CAGR over the forecast period.
- North America accounted for 36.25% of the smart furniture market in 2025, while Asia-Pacific is projected to grow at the fastest rate, with a 11.85% CAGR.
Smart Lighting
(Source: precedenceresearch.com)
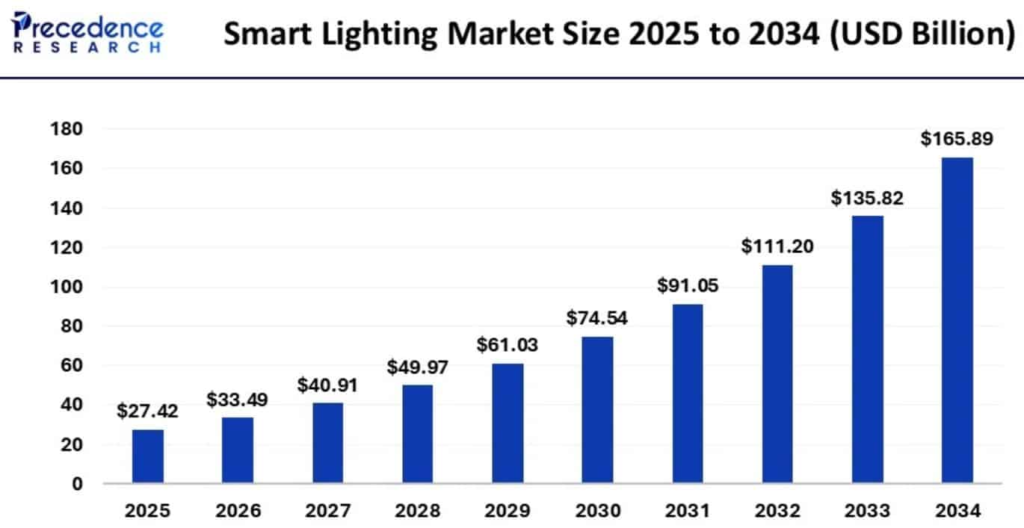
- As of 2026, the global lightning market size is expected to reach around USD 33.49 billion, up from USD 27.42 billion in 2025.
- This market is forecasted to reach around USD 165.89 billion by 2034, with a CAGR of 22.14% from 2026 to 2034.
- In Europe, the smart lighting market will capture the highest market valuation of USD 12.73 billion by 2026.
- In 2025, Europe accounted for the largest share of the smart lighting market at 38%, followed by North America at 27% (together, 65%). Asia Pacific holds 23%, Latin America contributes 8%, and MEA remains the smallest at 4%.
- Mordor Intelligence reports that in 2025, smart lamps and fixtures accounted for 54.67% of the smart lighting market, retrofits accounted for 62.91%, Wi-Fi accounted for 49.17%, and residential households accounted for 46.73%.
Smart Security Camera
(Source: persistencemarketresearch.com)
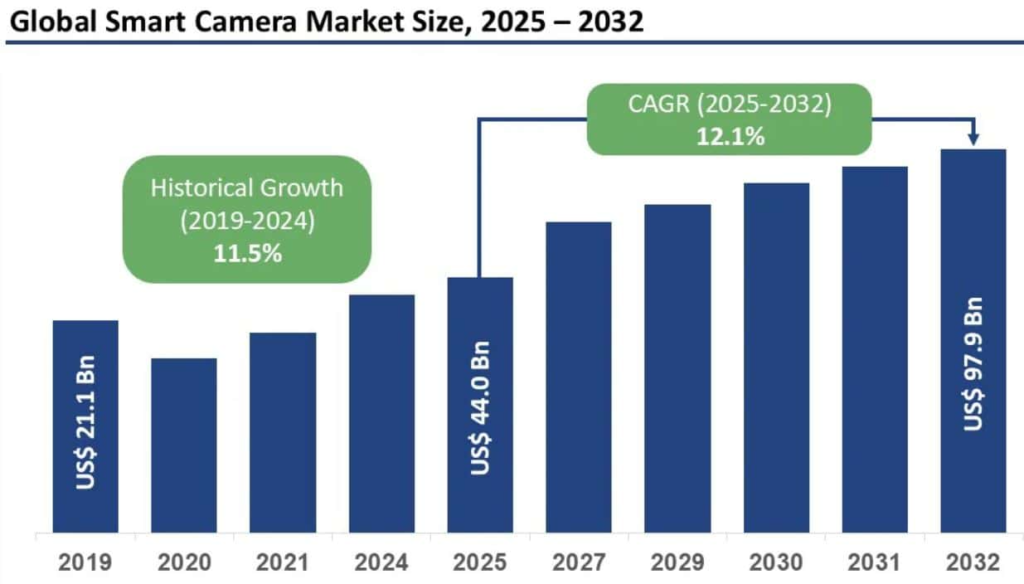
- The global smart camera market reached USD 44.0 billion in 2025 and is projected to reach USD 97.9 billion by 2032, implying a 12.1% CAGR over the 2025–2032 forecast period.
- In 2025, image sensors accounted for 30% of the total market, primarily because CMOS sensor technology continues to improve and deliver better performance at scale.
- In the same period, Asia-Pacific holds the largest regional share at 40%, followed by North America at 30% and Europe at 25% of the global market.
- The global spending on security solutions is projected to reach USD 232 billion by 2027.
- Demand is also driven by crime-related concerns, including package theft, with 44% of Americans reporting experiencing package theft in 2025.
- Building advanced smart cameras with AI, high-resolution sensors, and strong processing hardware requires heavy R&D investment, and some high-end models can cost over USD 1,000 per unit.
Wireless Router
(Source: mordorintelligence.com)
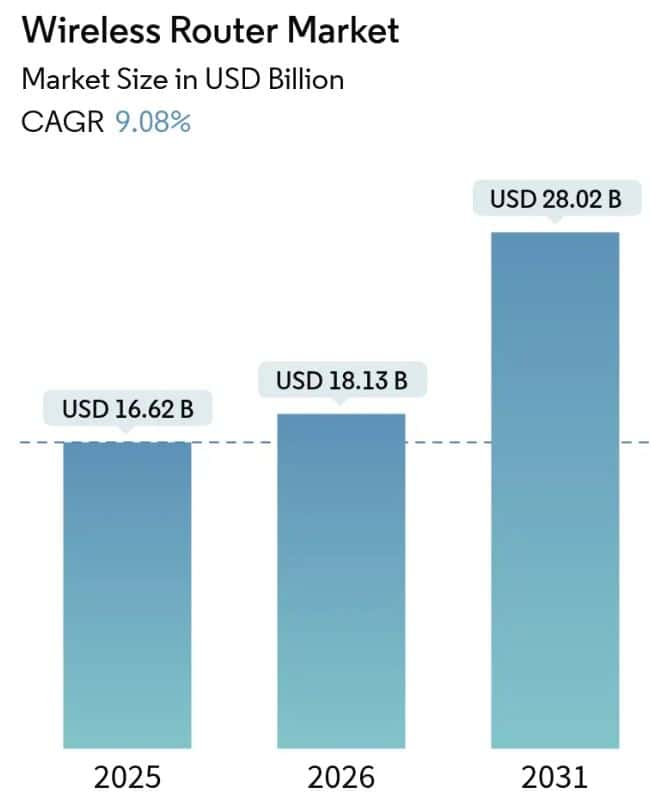
- The global wireless router market is projected to reach USD 18.13 billion in 2026, up from USD 16.62 billion in 2025.
- Moreover, the market will reach USD 28.02 billion by 2031, reflecting a 9.08% CAGR from 2026 to 2031.
- Standalone routers held the largest share at 43.62% in 2025, whereas mesh Wi-Fi systems are expected to grow the fastest, with an 11.74% CAGR.
- During the same period, Wi-Fi 5 accounted for 41.55% of the market, while Wi-Fi 7 is projected to grow at a 24.74% CAGR.
- Dual-band routers made up a share of 49.10%, while tri-band routers are forecast to grow at a 15.62% CAGR as 6 GHz adoption increases.
- Residential demand accounted for 60.98% of the market in 2025, while enterprise demand is expected to grow at a 9.72% CAGR.workloads.
- ISP-bundled sales captured 45.62% share in 2025, while online retail is expected to grow at an 11.12% CAGR from 2026 to 2031.
Smart Air Purifier
(Source: futuremarketinsights.com)
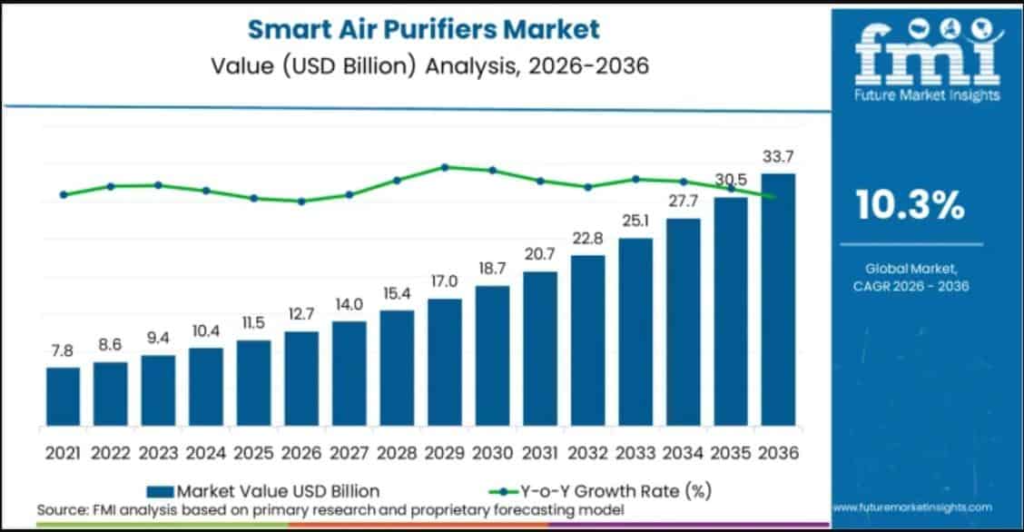
- The smart air purifier industry is projected to be valued at USD 12.7 billion in 2026.
- Moreover, the industry will reach USD 33.7 billion by 2036, with a 10.3% CAGR from 2026 to 2036.
- In 2026, dust collectors will account for 40.0% of the market.
- HEPA systems will account for the largest share of the technology mix at 50%.
- Residential buyers will drive demand, making up 54.0% of total use.
- From 2026 to 2036, smart air purifiers will grow fastest in the USA (10.7%) and Japan (10.1%), followed by South Korea (9.9%), the UK (9.4%), and Germany (9.0%).
Smart Plugs
(Source: mordorintelligence.com)
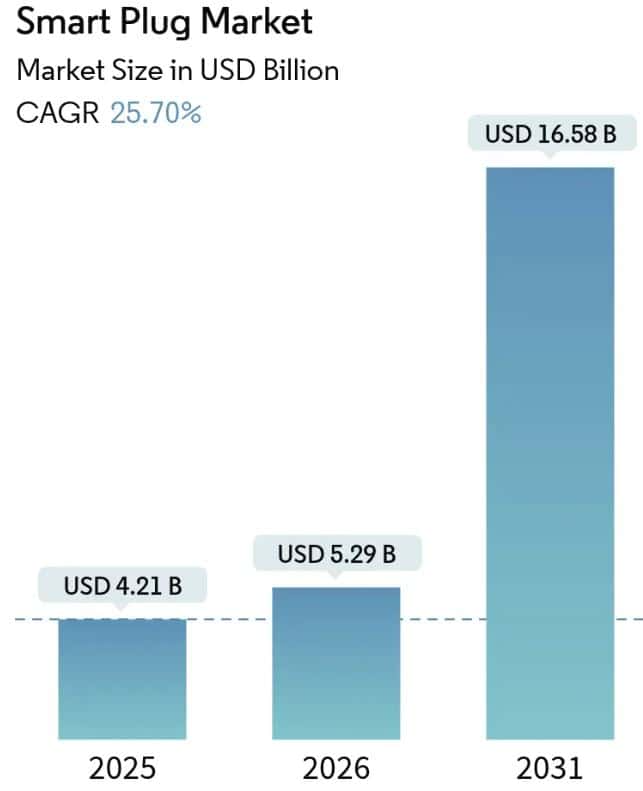
- The global smart plug market will reach USD 5.29 billion in 2026 and will expand to USD 16.58 billion by 2031.
- The market is projected to grow at a CAGR of approximately 25.70% over 2026-2031.
- Bluetooth technology accounted for 31.12% of the smart plug market in 2025, whereas Zigbee/Thread is expected to grow the fastest, with a 26.15% CAGR through 2031.
| Segment | Largest Share, 2025 | Fastest-Growing Category CAGR (From 2026 to 2031) |
| Application | Residential (55.74%) | Industrial (27.05%) |
| Sales Channel | Online (58.92%) | Online (24.65%) |
| Plug Form Factor | Wall-Plug Adapter (41.55%) | In-Wall Outlet (26.55%) |
| Region | North America (31.74%) | Asia Pacific (27.60%) |
Smart Home Device Brand Preferences
- Market.us Scoop reports Nest leads smart home brands, preferred by 37.50% of users in this survey.
- Amazon ranks second at 36.46%, just 1.04% behind Nest, while Philips Hue and Samsung tie at 8.33%, Ring has 7.29%, Ecobee 3.13%, Kasa 2.08%, and Nest+Amazon total 73.96%.
Artificial Intelligence (AI) Integration And Smarter Devices
- As of now, 35% of businesses have adopted AI, and another 42% are considering its use in the future.
- Industry forecasts suggest the global AI market could reach about USD 266.92 billion by 2027.
- The United States recorded more than 10 million active voice-assistant installations.
- AI could add around USD 13 trillion to the global economy by 2030.
- By 2030, as many as 30% of jobs could be automated using AI-driven technologies.
- The global AI market in education accounted for USD 3.68 billion.
- 81% of business executives view AI as a major competitive advantage.
- The global chatbot market reached USD 9.4 billion in 2024.
- The use of AI in customer service can yield up to 30% cost savings.
- In financial services, AI-powered chatbots could help banks save about USD 7.3 billion by 2025.
- AI could contribute up to USD 15.7 trillion to the global economy by 2030.
Privacy And Security Concerns About Smart Devices
- Parks Associates research shows that 49% of connected-device users report at least one privacy or data-security incident.
- Approximately 75% of households report being concerned, and many worry about spyware or viruses on smart devices.
- The average household uses 16 connected devices, indicating broad adoption.
- Smart home device owners typically have eight smart devices, raising the number of potential entry points.
- Approximately 25% of the market remains hesitant to adopt due to data privacy concerns.
- Regarding security, 72% of consumers express some concern about data collected and transmitted by devices.
- Among smart home users, 55% fear hackers could break in, while 39% fear unauthorised access by tech firms.
- Trust remains limited, with only 37% of consumers reporting trust in companies that can access their data.
Conclusion
Smart home devices facilitate daily life, enhance safety, and improve comfort. They can save time and energy by automating simple tasks such as lighting, locks, and temperature control. The key is to choose only what you really need and keep your devices secure by using strong passwords and regularly updating them. With the right setup, a smart home stays simple, useful, and under your control.
FAQ
Most smart homes require an internet connection for remote control and updates, but some basic features can work without it.
Yes, they can work together if they use Matter, Wi-Fi, Zigbee, or a compatible hub.
Install the app, connect to Wi-Fi, pair the device, name rooms, and set simple automations.
Use strong passwords, enable MFA, update devices, lock your Wi-Fi, and monitor access regularly.
No, they use very little power; however, always-on mode consumes a small amount continuously.
