SMS Marketing Statistics By Industries, Brand Concerns, Adoption And Trends (2025)
Updated · Jul 15, 2025
WHAT WE HAVE ON THIS PAGE
- Introduction
- Editor’s Choice
- SMS Marketing Statistics by Adoption and Trends
- By Engagement and Performance
- By Consumer Preferences
- By Customer Experience
- United States SMS Marketing Statistics
- SMS Marketing Statistics by Click-through Rate (CTR)
- By Conversion Rate (CVR)
- By Average Opt-Out Rate
- Primary Motivations for Investing in SMS Marketing Statistics
- SMS Communication Preferences Statistics by Frequency
- SMS Notifications Statistics
- Checking SMS Frequency Statistics
- Comparison Statistics by Other Marketing Channels
- SMS Marketing Statistics by Industries
- Best Marketing Statistics by Best Practices
- Businesses Adopting SMS Marketing
- Business Revenue Shares Attributed by SMS Marketing Statistics
- SMS Marketing Strategy Statistics
- SMS Marketing Retention Strategy
- SMS Marketing Statistics by Brand Concerns
- Reasons for Signing up for SMS Marketing Statistics
- Business Using SMS for Marketing Statistics
- Conclusion
Introduction
SMS Marketing Statistics: For many years, businesses around the world have been using SMS marketing to stay connected with their customers. They send short text messages straight to people’s phones, often with offers, updates, reminders, or alerts. Currently, people keep their phones with them all the time, and these messages are seen quickly.
Unlike emails that might be ignored, most text messages are opened within minutes. That’s why both small and large companies use SMS to increase sales, give better service, and keep in touch with their customers. When done properly, it’s a fast, personal, and powerful tool.
This article includes several statistical analyses from different insights that will guide you effectively in understanding the topic better.
Editor’s Choice
- The Notifyre report further states that the U.S. SMS marketing is expected to spend around USD 12.6 billion by 2025.
- A report published by Simple Texting, digital marketing businesses that are currently using text messages are 683% more successful.
- In 2024, about 65% of businesses from different industries started using SMS as part of their marketing plans.
- SAP Emarsys reports of 2025 state that SMS marketing is expected to be more useful, as stated by 51% of consumers.
- As per Sender.net, most people open text messages, with about 98% being read on average.
- The Klaviyo report further states that in marketing, about 61% of people unsubscribe from texts due to message overload.
- Adam Connell’s report of 2025 shows that around 58% of marketers said SMS helps bring back old customers and improves customer retention.
- SMS Marketing statistics show that the above image states that overall, 51% of people check their SMS notifications within five minutes of receiving them.
- In 2024, around 81% of businesses believe that using SMS marketing helps them make more revenue.
- Globally, almost 66% of people worry that companies might sell their data from SMS messages.
- Around 51% of people check their SMS notifications within five minutes of receiving them.
SMS Marketing Statistics by Adoption and Trends
 (Source: 160.com)
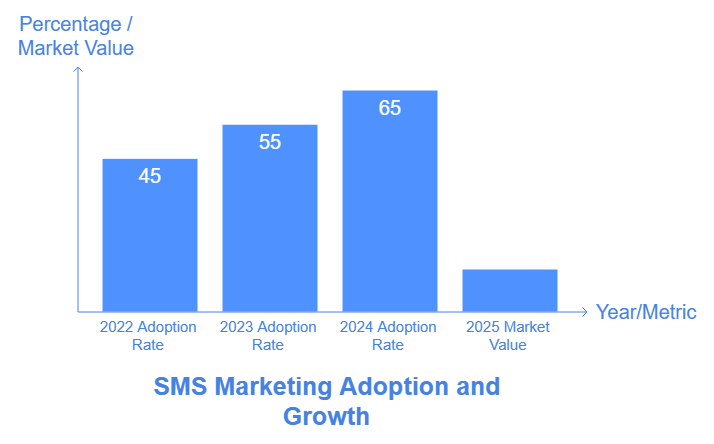
- In 2024, about 65% of businesses from different industries started using SMS as part of their marketing plans.
- This number was 55% in 2023 and 45% back in 2022.
- As of 2025, in the United States, around 47% of millennials preferred receiving text messages for brand communications.
- 53% of marketers said they use SMS mainly because it has high open rates.
- Simple Texting further reports that more than 90% of people send text messages daily, and most of them look at their messages over 10 times a day.
- To automate their SMS strategy, approximately 80% of businesses are using software.
By Engagement and Performance
- Based on the reports of Simple Texting, digital marketing businesses that are currently using text messages are 683% more successful.
- From SMS marketing, global businesses reported that they generate 11-20% of their revenue.
- As of 2025, within five minutes after getting a text message, almost 81% of consumers check
- According to the SAP Emarsys report analysis, about 12% of customers join a brand’s SMS program to show they are loyal buyers.
- In 2024, about 18% of people in the U.S. used SMS to buy something 4 to 5 times, as reported by Klaviyo.
- Companies that add SMS to their marketing mix often see better results, and customer engagement goes up by 47.7%.
- UpCity found that for every USD 1 spent on SMS marketing, businesses earn between USD 21 and USD 41 in return.
- com also shared that SMS messages get a 45% response rate, while email only gets about 6%.
- More than two-thirds of buyers (68%) spend over USD 50 on purchases made through SMS.
- Also, the average click-through rate for SMS is around 18%, much higher than the 2.5% rate seen with emails.
By Consumer Preferences
 (Reference: 160.com)
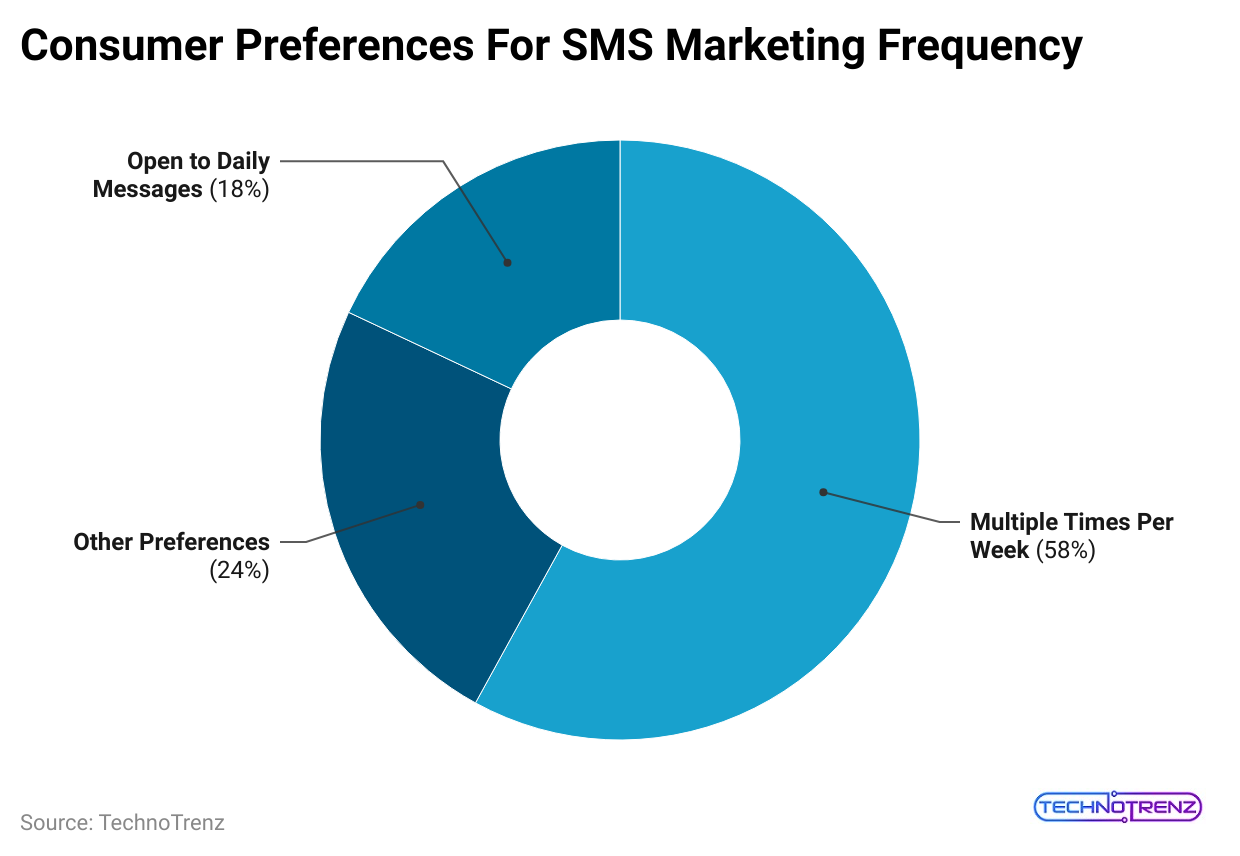
- The above graph shows that 58% of consumers received texts from brands multiple times per week, while 18% are open to daily marketing text messages.
- Followed by other preferences with a share of 24%.
- As of 2025, around 91% of people say they would like to get text messages from their favourite brands.
- 81% have already signed up to receive texts from at least one brand.
By Customer Experience
- According to the reports of SAP Emarsys of 2025, SMS marketing is expected to be more useful, as stated by 51% of consumers.
- About 23% of customers said they would stop using a brand if it sends them too many marketing messages.
- As per Sender.net, most people open text messages, with about 98% being read on average.
- Statista report states that more than 53% of marketers said they use SMS mainly because it has high open rates.
- 90% of SMS messages are read within just three minutes of delivery.
- 91% of consumers say they’d opt in to SMS communications from brands if it improved their experience.
- Based on SMS Marketing Statistics, almost 77% of text messages get a reply in just 10 minutes, which is over three times faster than email responses.
- Another 75% of people say they like getting promotional messages through SMS more than other types of marketing.
United States SMS Marketing Statistics
- The Notifyre report further states that the U.S. SMS marketing is expected to spend around USD 12.6 billion by 2025.
- The market will grow at a compound annual growth rate (CAGR) of 20.3%.
- In 2025, U.S. businesses are set to spend USD 318.5 million on SMS ads, more than any country.
- In the same duration, SMS is seen as the best way to engage customers by 54% of businesses.
- Businesses spend only USD 0.10 per person, making SMS a budget-friendly option.
- People in the U.S. respond better to SMS ads than those in the UK or Australia.
SMS Marketing Statistics by Click-through Rate (CTR)
 (Source: simpletexting.com)
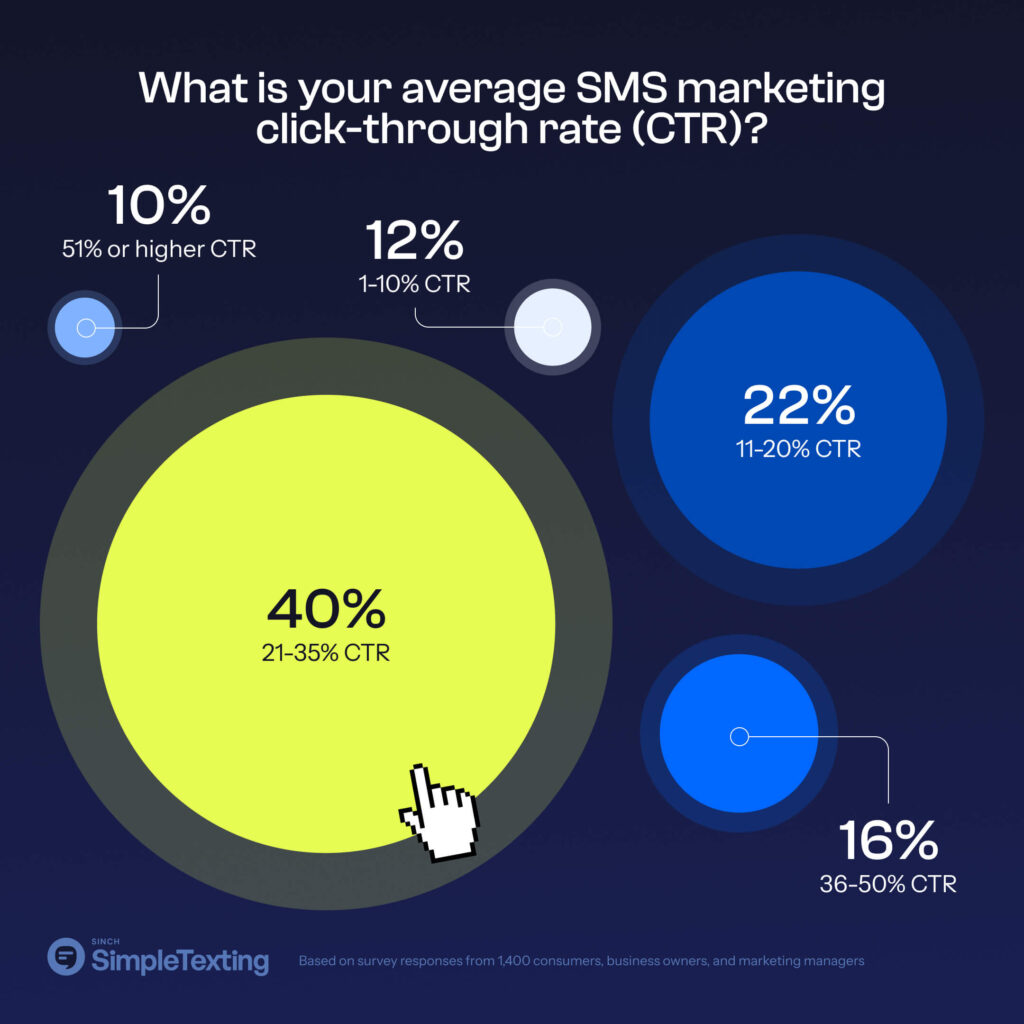
- As of 2024, almost 40% of businesses get a click-through rate between 21% and 35% from text marketing.
- Furthermore, other average SMS Marketing click-through rate by other shares of businesses includes 11% to 20% CTR (22%), 36% to 50% CTR (16%), 1% to 10% (12%), and 51% or higher CTR (10%).
By Conversion Rate (CVR)
 (Reference: simpletexting.com)
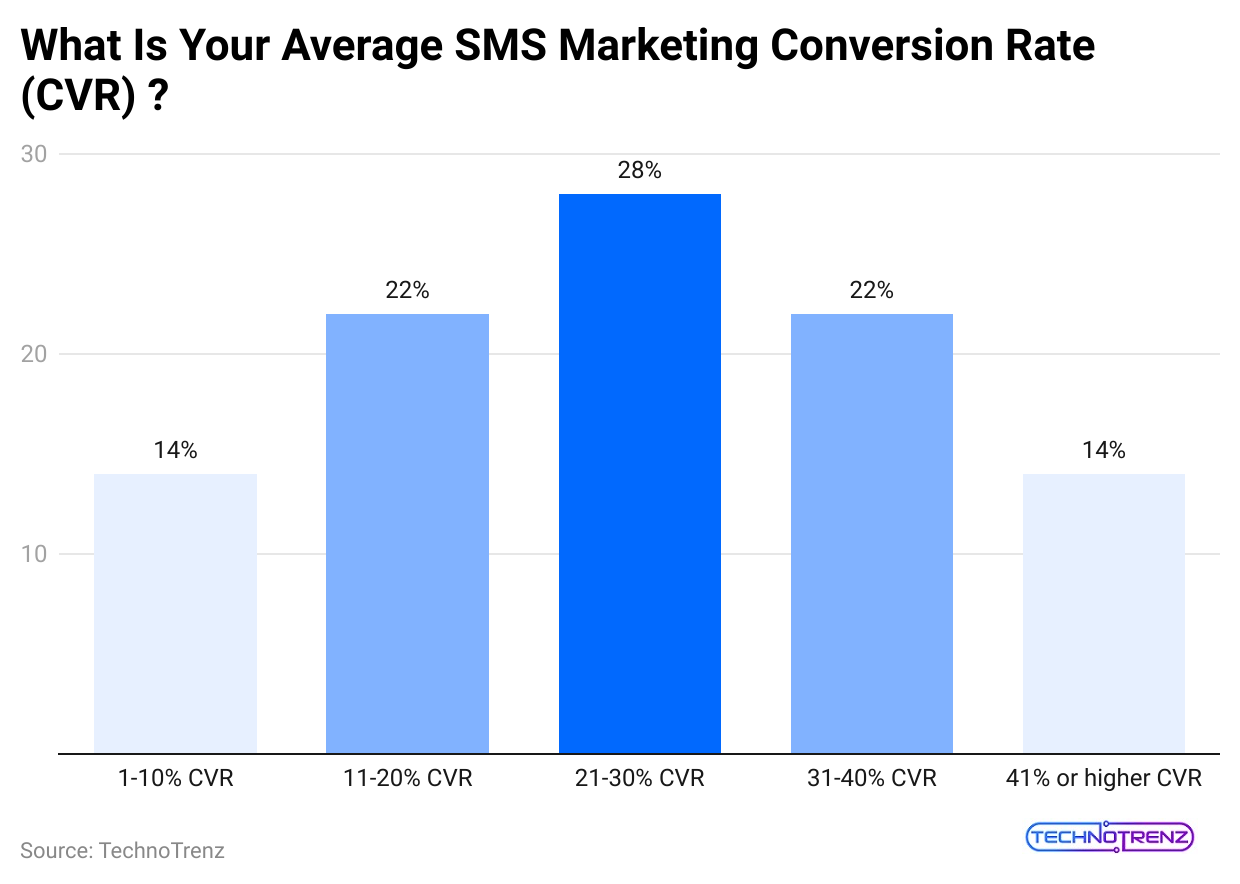
- As of 2024, SMS marketers report a conversion rate (CVR) between 21% and 30%, with 28% being the most common range at 28%.
- Meanwhile, 22% of marketers achieve 11% to 20% CVR, and another 22% account for 31% to 40% CVR.
- Lastly, 14% marketers secured 1% to 10% CVR, while 14% (41% or more CVR).
By Average Opt-Out Rate
 (Reference: simpletexting.com)
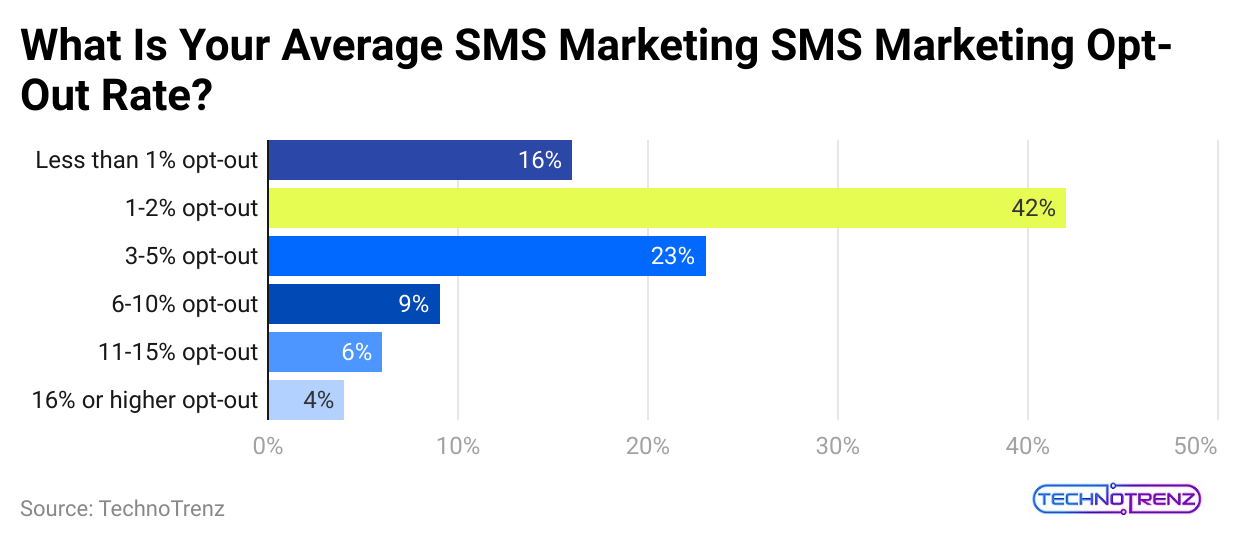
- Based on the reports of SMS Marketing, SMS marketers report an opt-out rate of 1% to 2%, making it the most common at 42%.
- About 23% experience a 3% to 5% opt-out, while 16% report less than 1%.
- Higher opt-out rates, such as 6–15%, are less frequent, and only 4% face 16% or more, showing that most campaigns maintain low subscriber loss.
Primary Motivations for Investing in SMS Marketing Statistics
- Two-way interactions: 36%
- Real-time reach and instant delivery: 33%
- High open and click-through rates: 31%
- Cost-effective channel: 30%
- Personalisation and segmentation: 29%
- Complements other channels: 28%
- Opt-in audience: 24%
- Others: 9%
SMS Communication Preferences Statistics by Frequency
- The Klaviyo report further states that in marketing, about 61% of people unsubscribe from texts due to message overload.
- Still, 72% are okay with weekly texts, and 45% don’t mind more.
- Around 32% of people are okay with getting texts from brands a few times weekly, while 13% prefer daily messages.
The table below shows that SMS Marketing helps people to purchase products by the time of day:
| Time of Day | Share of people who purchase via SMS |
| Evening |
45% |
|
Afternoon |
25% |
| Midday |
13% |
|
Morning |
9% |
| Late Night Hours |
8% |
Besides, SMS Marketing helps people to purchase products through an activity:
| Activity During SMS Marketing | Share of people who purchase |
| Watching TV |
52% |
|
Having a snack or drinking a beverage |
28% |
| Commuting |
7% |
|
Working |
6% |
| Doing something else |
5% |
|
Cooking |
3% |
SMS Notifications Statistics
 (Reference: simpletexting.com)
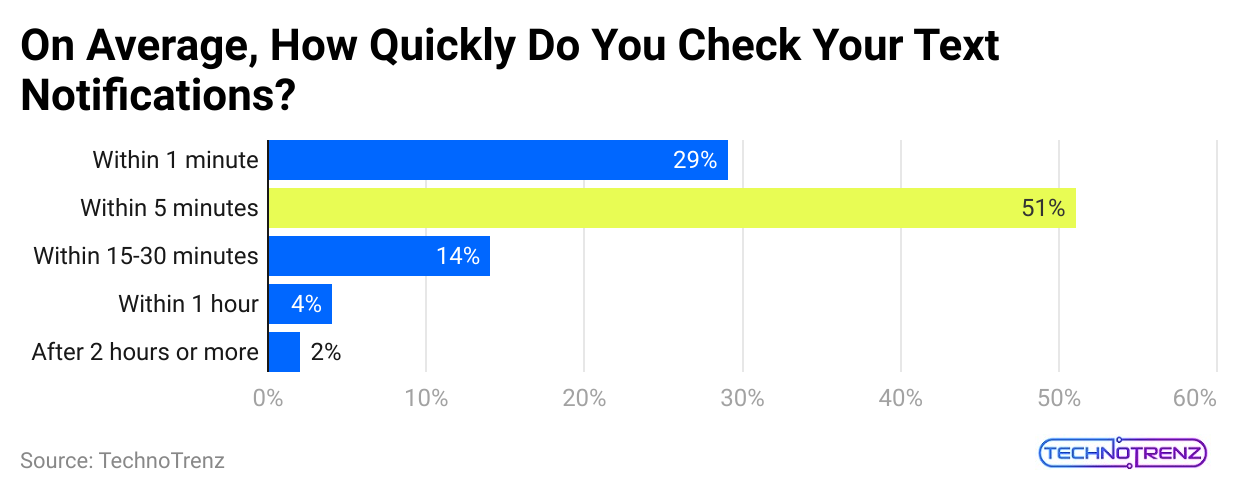
- SMS Marketing statistics show that the above image states that overall, 51% of people check their SMS notifications within five minutes of receiving them.
- Interestingly, nearly 29% read texts in less than 60 seconds, followed by 14% (within 15 to 30 minutes), 4% (within 1 hour), and 2% (after 2 hours or more).
Checking SMS Frequency Statistics
 (Reference: simpletexting.com)
- Regularly, approximately 91% of people say they send or receive texts.
- Among Gen Z users, 48% check texts over 10 times daily, and 25% go beyond 20 checks per day.
- About 43% check their messages more than 10 times per day.
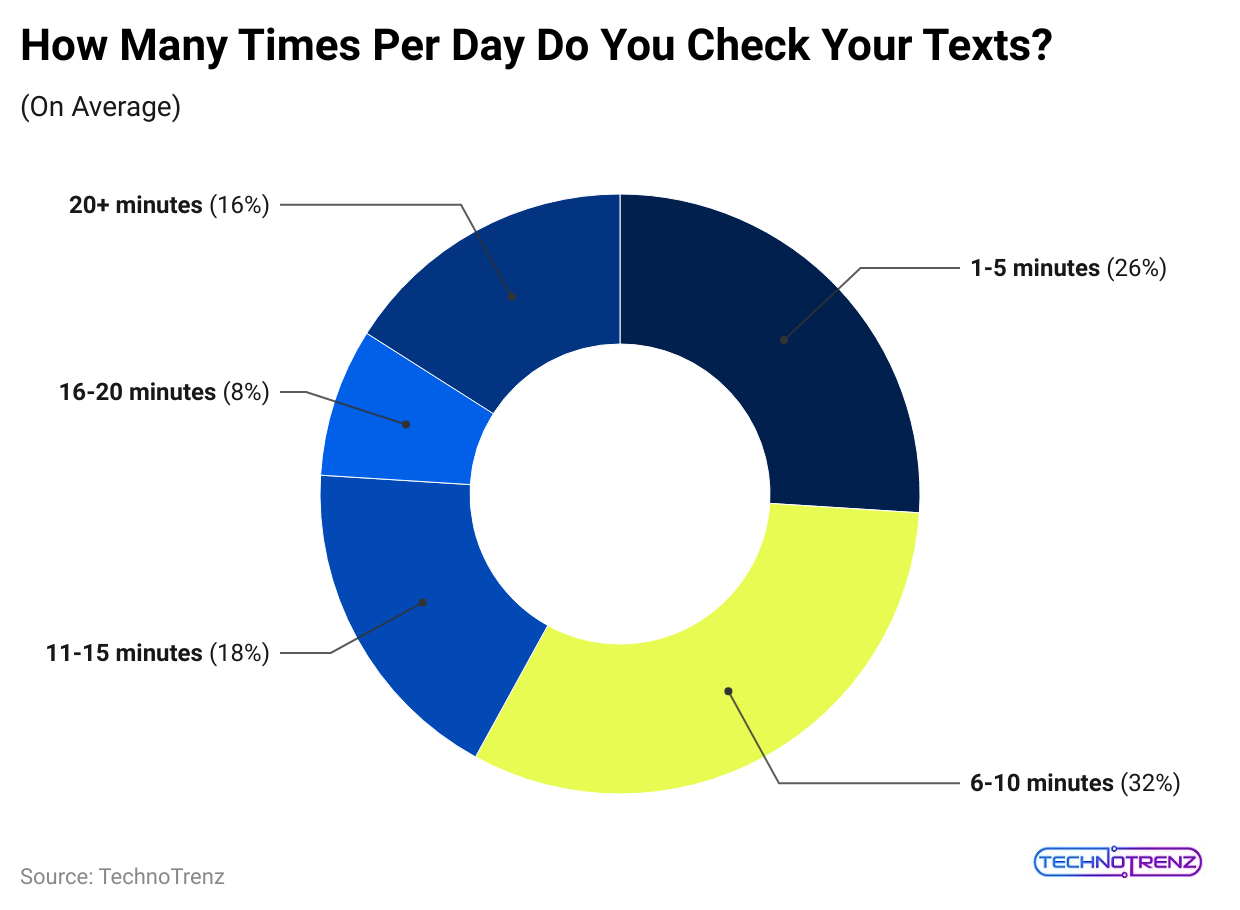
- Moreover, 32% of consumers check their SMS 6 to 10 times daily.
- Other consumers check shares by the day are followed by 26% (1 to 5 times), 18% (11 to 15 times), 16% (more than 20 times), and 8% (16 to 20 times).
Comparison Statistics by Other Marketing Channels
- As of 2024, SMS gets about 97% open rates, much higher than emails (20% to 30%) and Facebook posts, which reach just 5.5% of people.
- People click on 20 to 35 out of every 100 SMS messages, while only about 2.5 do the same for emails, and less than 1 for display ads.
- Around 90% of SMS texts are read in just 3 minutes, but only 23% of emails get opened within an hour.
SMS Marketing Statistics by Industries
- Sender.net further states that about 55% of healthcare companies use SMS marketing, showing it’s a trusted way to reach people.
- Furthermore, other industries that rely on SMS are followed by Banking & Finance (46%), and E-commerce & Retail (45.9%).
- More than 42% of real estate agents use SMS to share property details, remind clients about appointments, and send follow-ups.
- Nearly 40% of schools use SMS for updates and reminders.
Best Marketing Statistics by Best Practices
- To get the best results from SMS marketing, keep messages short under 160 characters.
- The best time to send them is between 10 AM and 1 PM on weekdays, when people are most likely to read and respond.
- 2 to 4 messages per month are enough to keep subscribers interested without annoying them.
- Adding personal touches can boost engagement by up to 26%.
- People are more likely to sign up if they’re offered a dollar-off discount, followed by a percentage-off deal or gifts.
- Finally, using SMS along with email can be effective, as 35% of users prefer getting the same message through both channels.
Businesses Adopting SMS Marketing
 (Reference: website-files.com)
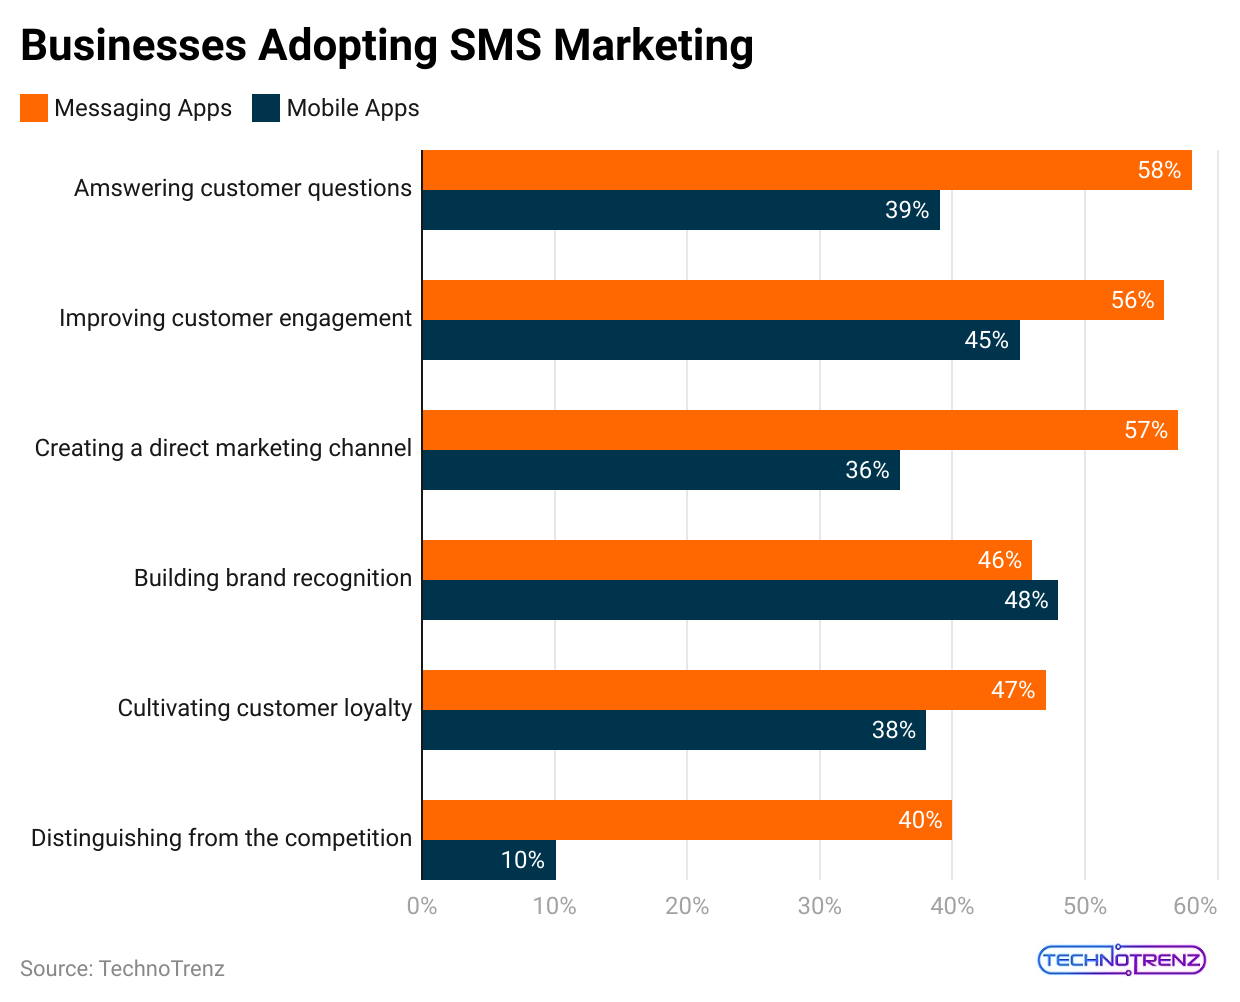
- In recent years, messaging apps have been used by 58% of businesses for answering customer questions, followed by 57% businesses (creating a direct marketing channel).
- Furthermore, other businesses share by SMS Marketing are followed by 56% businesses (improving customer engagement), 47% (cultivating customer loyalty), 46% (building brand recognition), and 40% (distinguishing themselves from competitors).
- According to the reports of Simple Texting of 2204 shows that, 81% of businesses believe that using SMS marketing helps them make more revenue.
- Meanwhile, around 40% of businesses claimed that SMS helps bring in between 11% and 20% of their total income.
| Businesses Share | Revenue Share |
| 20% | 21% to 30% |
| 15% | 31% to 40% |
| 12% | 41% to 50% |
| 8% | 1% to 10% |
| 5% | 51% or more |
SMS Marketing Strategy Statistics
- In 2024, the top SMS marketing trend for businesses is using AI to personalise messages and automate campaigns, with 40% of companies already following this approach.
- Similarly, other SMS Marketing strategies are followed by Chatboats & virtual assistants (35%), interactive polis & surveys (31%), cross-channel integration (27%), SMS QR Codes (26%), location-based SMS targeting (24%), two-way interactive messaging (23%), rich media messaging (22%), predictive analytics for targeted messaging (19%), and other (8%).
SMS Marketing Retention Strategy
 (Reference: adamconnell.me)
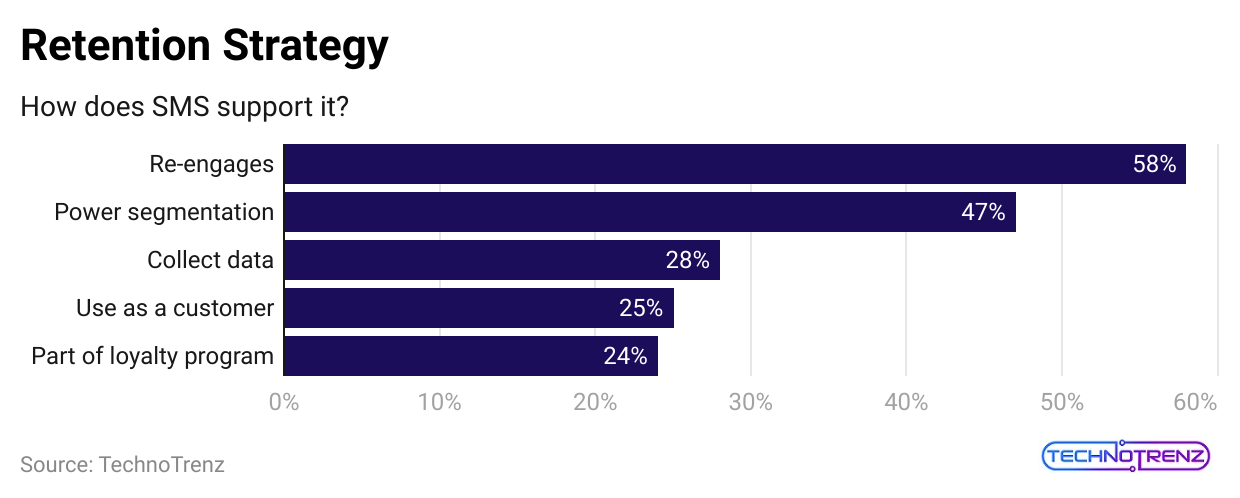
- As of 2025, around 58% of marketers said SMS helps bring back old customers and improves customer retention.
- Besides, 47% say it helps send the right messages to the right groups of people, while 28% use it to gather helpful customer information.
- In contrast, only 25% treat SMS as if they were the customer to improve the experience, and another 24% include SMS in their loyalty or rewards programs.
SMS Marketing Statistics by Brand Concerns
 (Reference: adamconnell.com)
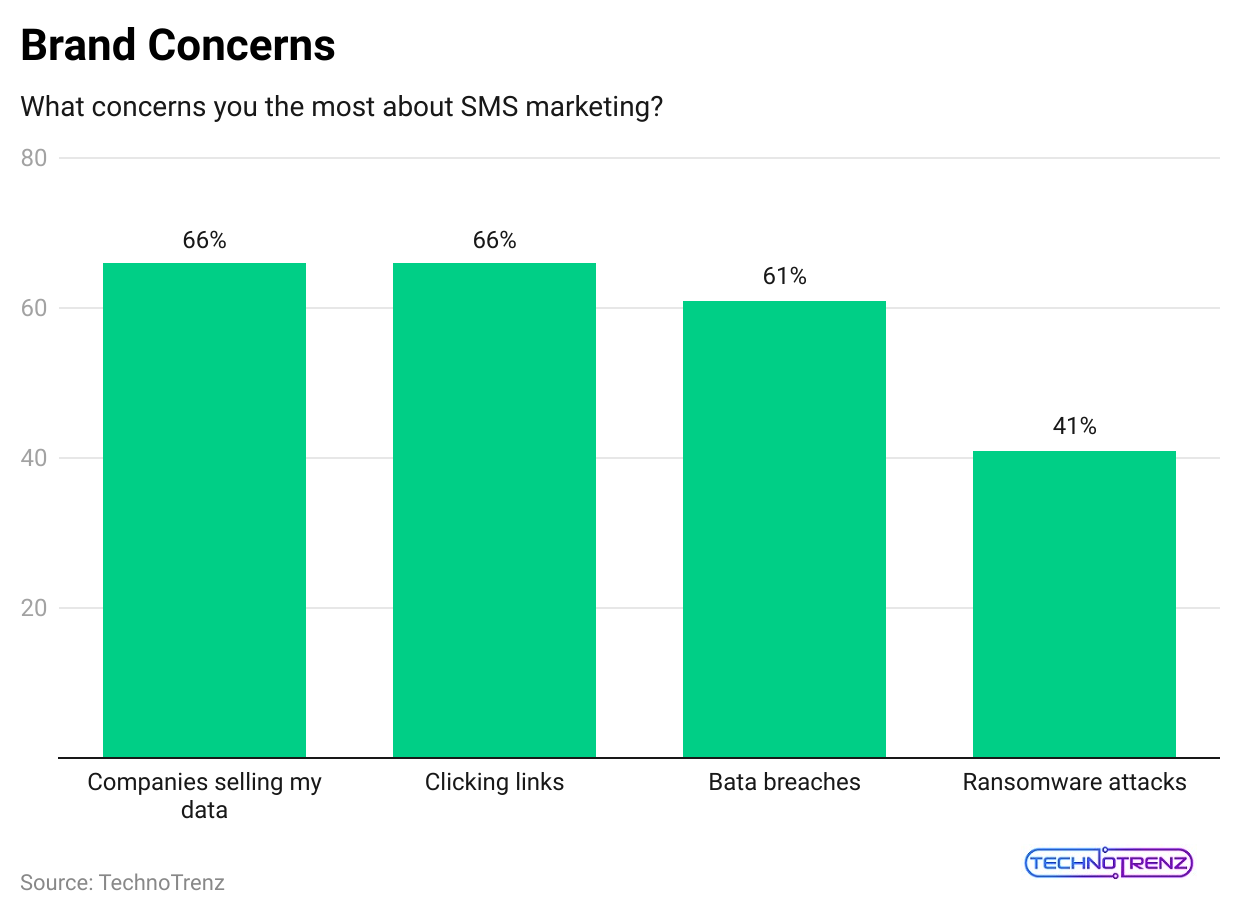
- Globally, almost 66% of people worry that companies might sell their data from SMS messages.
- Another 66% also feel unsafe clicking links in SMS messages.
- 61% fear their data might get leaked or hacked, while 41% are concerned about ransomware attacks through text messages.
Reasons for Signing up for SMS Marketing Statistics
| Reasons | User Share |
| People sign up because they like the brand. | 39% |
| Join because they’re planning to buy something and are hoping for a discount. | 38% |
| To get updates about their order status. | 38% |
| Shop from the brand often, so they stay connected. | 37% |
| Wait for discounts and sign up to know when sales happen. | 35% |
| Being the first to know about sales or new products. | 34% |
| Want alerts when certain items go on sale or are back in stock. | 29% |
| To get reminders for upcoming orders or appointments. | 29% |
| Follow brands that spend a lot of money on. | 28% |
| To keep up with the latest news from the brand. | 24% |
| Prefer getting a quick link to change or update their subscription order without logging into their account. | 21% |
Business Using SMS for Marketing Statistics
| Usage Reasons | Businesses Share |
| Customer satisfaction surveys and feedback | 41% |
| Customer service and support | 39% |
| Appointment and reservation reminders | 34% |
| New product and service offerings | 30% |
| Shipment tracking and order notifications | 28% |
| Reviews | 27% |
| Discounts, promotions and sales alerts | 27% |
| Event invitations | 25% |
| Billing or collections | 24% |
| Abandoned cart follow-ups | 12% |
| Others | 8% |
Conclusion
After completing the article on SMS Marketing Statistics, this is a powerful technique for businesses to connect with people quickly and directly. It has high open and response rates, making it a crucial tool for industries like healthcare, banking, and retail. In recent years, many people worry about their privacy, unsafe links, and online threats when they get SMS messages. To gain trust, businesses should be clear, stay secure, and never send spam.
Sources
FAQ.
The best time to send SMS marketing messages is usually from 11 in the morning to 4 in the afternoon.
SMS marketing is considered an online strategy because it uses mobile networks and digital tools to send messages directly to users.
SMS marketing includes promotions, reminders, order updates, appointment confirmations, flash sales, and event alerts.

After graduating in Electrical Engineering, Maitrayee moved into writing after working in various technical roles. She specializes in technology and Artificial Intelligence and has worked as an Academic Research Analyst and Freelance Writer, focusing on education and healthcare in Australia. Writing and painting have been her passions since childhood, which led her to become a full-time writer. Maitrayee also runs a cooking YouTube channel.


