


Introduction
Instagram Marketing Statistics: Instagram marketing is the process by which businesses use Instagram to promote their brands, products, or services. It also enables businesses to reach more people through photos, videos, stories, and reels. In recent years, Instagram has been a highly trending platform due to its visual, engaging content that quickly grabs attention and keeps users engaged.
Brands can share their story, show their products, and build trust with their audience. With the right content and simple ads, Instagram marketing helps increase visibility, attract followers, and turn them into customers. It is a powerful and easy way to grow a business online.
Editor’s Choice
- As of 2025, with nearly 2 billion monthly active users, Instagram ranks as the third-largest social media platform globally.
- According to Hootsuite, 72% of U.S. teenagers and 76% of users aged 18-29 actively use Instagram, making it highly attractive for Gen Z marketing.
- The average engagement rate on Instagram is 2.0%, whereas carousel posts achieve 2.4%.
- Posting frequency impacts performance. Brands that post twice per week achieve higher engagement compared to retailers posting up to 17 times per week.
- User behaviour shows mixed iintentionss 86% use Instagram for entertainment, while 36% use it for searches, similar to a search engine.
- Additionally, 7% of users begin their shopping searches on Instagram.
- Instagram’s advertising revenue is projected to reach USD 67.27 billion in 2025, reflecting strong monetisation growth.
- Moreover, 40.1% of Instagram shoppers spend more than USD 200 annually.
- Visual Capitalist reported that in 2025, Instagram ranked among the world’s leading brands with a brand value of USD 79.9 billion, originating from the United States.
- The 2025 Sprout Social Index reports that 29% of users make purchases on Instagram, making it the third-most-used social media platform for shopping.
Key Features Of Instagram Shopping
- Instagram Shop is a digital storefront where users can browse products, sale items, and active promotions by tapping “View Shop” on a brand profile.
- Product tags let brands tag items directly in posts and videos, enabling users to tap to view product details instantly, thereby increasing purchase intent.
- Collections organise products into categories, making browsing easier and highlighting best-selling or customer-specific items.
- Display product descriptions, specifications, USD pricing, and shipping information sourced from the catalogue.
- Instagram allows users to either visit a brand’s website or complete purchases directly on the app, reducing drop-off rates.
- The Discovery tab enables users to find products based on activity, deals, and brands that offer direct Instagram checkout.
Instagram Usage And Marketing Statistics
- According to Oberlo, Instagram has more than 2 billion users worldwide.
- On average, an Instagram post uses about 10.7 hashtags.
(Source: shopify.com)
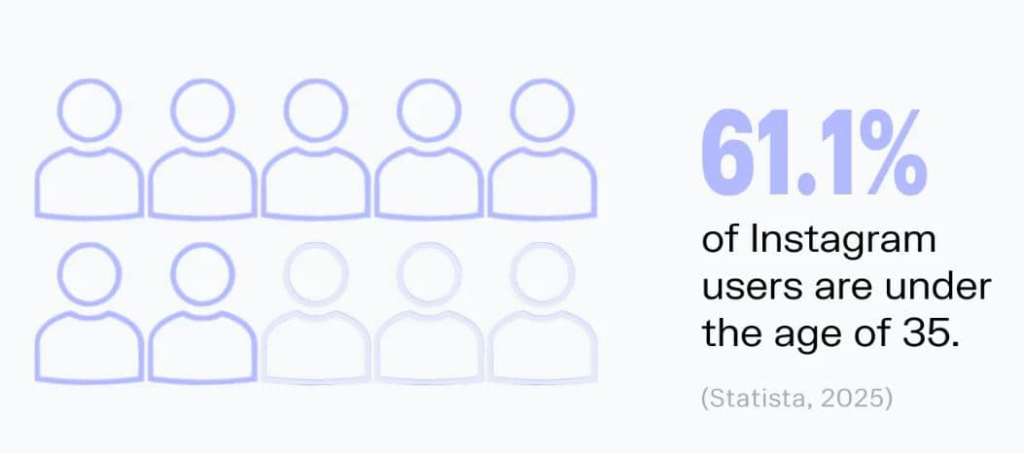
- Around 61.1% of Instagram users are under 35 years old.
- Adults in the United States spend an average of 30.6 minutes per day using Instagram.
- The platform hosts over 200 million business accounts.
- Use of the #ad hashtag has increased by 133%, reflecting the rise in influencer and sponsored content.
- Instagram Stories offer a potential reach of 996 million users.
- About 62.2% of users follow and research brands or products directly on Instagram.
- Instagram generates more than four times as many interactions as Facebook.
- Moreover, 80% of users report that Instagram helps them decide to buy a product or service.
Instagram Advertising Cost Statistics
(Source: sproutsocial.com)
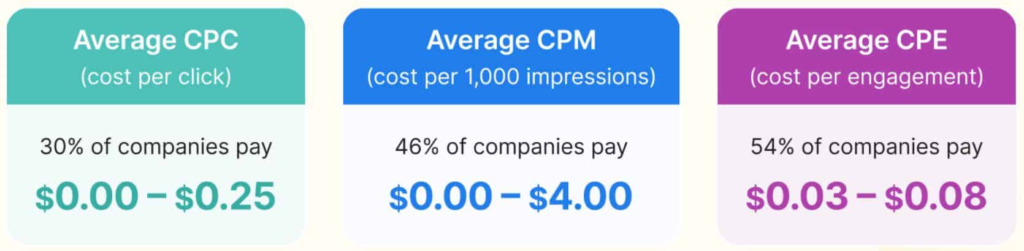
- The cost per click (CPC) for Instagram ads typically ranges from USD 0.00 to USD 0.25.
- At a cost per thousand impressions (CPM), ad exposure is slightly more expensive. Around 46% of companies report paying between USD 0.00 and USD 4.00 per 1,000 impressions.
- For engagement-based pricing, the cost per engagement (CPE) is relatively low. Most advertisers spend approximately USD 0.03 to USD 0.08 per engagement, such as likes, comments, or shares.
Instagram Ads Conversion Rates By Objective
- Based on industry research, most brands see an average conversion rate of 1% to 2% across Instagram ads.
- According to DriftLead, this 1%-2% range applies to all campaign objectives combined.
- High-performing and well-optimised campaigns can achieve conversion rates of 3% or higher.
| Campaign Objective | Average Conversion Rate |
| Brand Awareness | 0.5%-1.0% |
| Reach | 0.3%-0.8% |
| Traffic | 0%-2.0% |
| Engagement | 0%-3.0% |
| App Installs | 0.8%-1.5% |
| Video Views | 0.5%-1.2% |
| Lead Generation | 0.5%-3.0% |
| Conversions | 0%-3.0% |
| Catalog Sales | 0.5%-3.5% |
| Store Traffic | 0.5%-1.5% |
By Industry
- According to Driftlead, the average conversion rate for E-commerce ranges from 1.85% to 2.5%.
- Instagram performs well because visual ads and shopping tools support purchase decisions, with an overall benchmark of approximately 2.2%.
| Industry | Average Conversion Rate | Benchmark Insight |
| Fashion and Beauty | 2.0% -3.0% | Strong visual content helps outperform the general apparel benchmark of 2.3%. |
| Technology and Software | 0.9%-1.5% | Conversion rates are lower due to Instagram’s B2C focus, compared to a 1.2% cross-channel average. |
| Food and Beverage | 2.3%-2.8% | Visual appeal and “food culture” support performance at approximately 2.6% of the industry average. |
| Travel and Hospitality | 2.8%-3.5% | Results closely align with the broader industry benchmark of 3.6%. |
| Health and Wellness | 2.5%-3.2% | Performance aligns well with the 3.1% cross-channel average. |
| Education | 2.5%-3.0% | Conversion rates are similar to the overall education benchmark of 2.8%. |
| B2B Services | 0.8%-1.3% | Lower performance compared to the 1.5% cross-channel average due to longer decision cycles. |
Global Instagram Advertising Audience By Country
- India has the largest Instagram advertising audience, with 326.6 million users reachable through ads.
- The United States ranks second, offering an Instagram ad reach of 168.6 million users.
- Brazil ranks third, with 132.6 million users available for Instagram advertising.
- Indonesia reaches 106.0 million Instagram ad users, followed by Turkey with 56.4 million, Japan with 54.7 million, Mexico with 43.8 million, and the United Kingdom with 33.5 million, reflecting steady and growing advertising potential across these markets.
Instagram Influencer Audience Statistics
- The ContentStudio.io report further stated that there are an estimated 500,000 active Instagram influencers, with nano- and micro-influencers dominating the platform in 2025.
- 54% of Instagram influencers are nano-influencers (1,000-10,000 followers), and 33% are micro-influencers (10,000-50,000 followers).
- The average follower count for an Instagram influencer is about 50,000 followers, though this varies by niche.
- Instagram influencers have an average engagement rate of around 2-3%.
- According to Whop, influencer Reels had an engagement rate of 3.75%, higher than that of traditional feed posts.
- Engagement tends to decrease as follower count increases: accounts with over 1 million followers have about 0.95% engagement, while those with under 5,000 followers have about 4.21% engagement.
- Around 76.86% of all Instagram influencers have between 1,000 and 10,000 followers.
- Globally, some estimates suggest there are more than 41 million Instagram influencers in 2025, according to Getphyllo.
- Countries with the highest counts of influencers include Brazil (3.83 million), the United States (3.78 million), and India (1.99 million).
Instagram Influencer Engagement Rates By Post Type
(Source: sproutsocial.com)
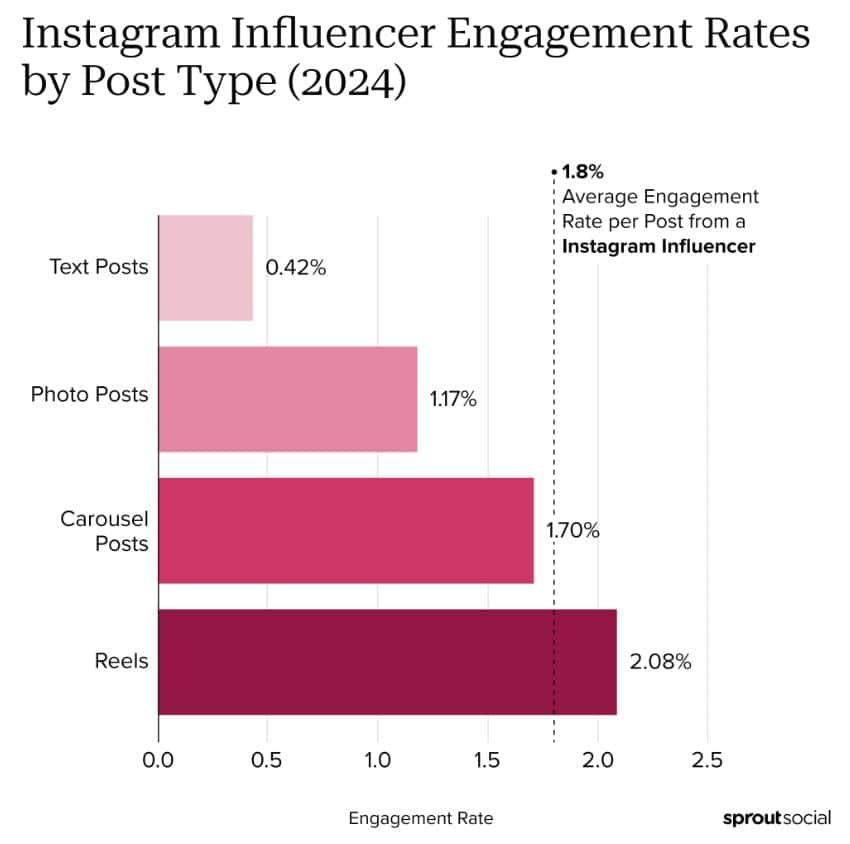
- According to Sprout Social’s 2025 report, Instagram influencer Reels typically receive about 2.08% engagement.
- Carousel posts from influencers have an average engagement rate of 1.70%.
- Influencer photo posts generally have an engagement rate of about 1.17%.
- Traditional influencer video posts have the lowest engagement at 0.42%.
Instagram Influencer Collaboration Costs By Influencer Tier
| Influencer Tier | Follower Range | Average Cost per Reel (USD) |
| Nano-influencers | 1K-10K | 55 |
| Micro-influencers | 10K-100K | 300 |
| Mid-tier influencers | 100K-500K | 2,750 |
| Macro-influencers | 500K-1M | 7,500 |
| Mega-influencers | 1M+ | 75,000 |
| Celebrities | Varies | 150,000 |
Top Countries By Total Instagram Influencer Engagements
- The United States leads global Instagram influencer activity with 189 billion total engagements, followed by Brazil with 116 billion and India with 95.4 billion.
- Indonesia records 23.5 billion engagements, while the United Kingdom reaches 22.1 billion.
Instagram Engagement Benchmarks And Performance Targets
- According to Cool Nerds Marketing, brands should aim for an engagement rate of at least 0.5% among followers, with the target adjusted based on industry norms.
- Carousel posts perform best with 6 to 10 panels.
- The first carousel slide should use simple, clear language that immediately explains the value.
- Carousels should follow a step-by-step structure that encourages users to swipe.
- The final carousel slide should include a summary or checklist that users want to save.
Instagram Reels Optimisation Guidelines
- Reels should capture attention within the first 3 seconds.
- Video edits should occur every 1 to 2 seconds to maintain viewer interest.
- All Reels should include captions or subtitles to support silent viewing.
- Brands should use native Instagram sounds paired with keyword-rich captions to improve discoverability in search.
- Reels should be optimised for both engagement and search visibility.
Instagram Stories Engagement Strategies
- Instagram SEO should be approached similarly to website SEO, but adapted for visual content.
- Bios should include clear keywords that describe the brand or offering.
- Captions should include relevant entities and search terms.
- Alt text should be fully written and keyword-optimised.
- File names for uploaded content should include descriptive keywords.
Reels And Collaborative Post Performance
- Reels became the dominant post format for brands by late 2024 and remain a priority in 2025.
- Collaborative posts, where two accounts co-author content, generate approximately 3.4 times higher engagement than non-collaborative posts.
- Brands should use creator or brand collaborations to increase reach on launch posts.
- Engaged users can then be retargeted using Advantage+ ad placements.
Instagram Stories Vs. Feed Ads Performance
- In 2025, Instagram Stories ads accounted for 37% of total ad placements, up from 31% in 2024.
- Stories ads delivered around 23% higher view-through rate than feed ads, especially among Gen Z users.
- Feed ads perform better for long-term engagement, with a save rate 2.5 times higher than Stories ads.
- The average completion rate for Stories ads reaches 79%.
- Brands using vertical video formats in Stories see a 34% increase in engagement.
- Stories ads that include polls or stickers generate 19% more interactions on average.
- In-feed ads drive 22% more profile visits, and Stories ads have a 14% lower CPM in USD than feed ads.
- Product-tagged feed ads achieve a 38% higher checkout rate than feed ads without shopping features.
- Influencer Stories ads with swipe-up links generate 31% more traffic than influencer feed ads.
Hashtags and Captions
- Instagram captions can include up to 2,200 characters.
- Only the first approximately 125 characters are visible before users click “More.”
- Research shows that short captions under 30 words tend to earn higher engagement.
- Posts that include at least one hashtag achieve an average of 12.6% higher reach than posts with no hashtags.
Marketer’s Best Times To Post On Instagram, 2025
| Day | Recommended Posting Time(s) |
| Monday | 3 PM-9 PM |
| Tuesday | 5 AM-8 AM; 3 PM-7 PM |
| Wednesday | 5:00 PM |
| Thursday | 4 PM-5 PM |
| Friday | 4:00 PM |
| Saturday | 11 AM; 5 PM |
| Sunday | 12 PM; 3 PM |
Industry-Specific High-Performance Posting
- In Dining and Tourism, the Instagram posts perform best on Wednesday between 11 AM and 3 PM.
- In Finance, engagement was strongest on Wednesday from 11 AM to 2 PM and on Friday from 11 AM to 4 PM.
- In Government sectors, Thursday between 12 PM and 3 PM is the most effective posting window.
How Instagram Marketing Tools And Features Are Used
- As of 2025, about 70% of Instagram users engage with Stories every day.
- Reels dominate platform activity, with 50% of users spending most of their time scrolling through Reels content.
- Around 15% of users swipe up on Story links, helping brands drive direct website traffic.
- Carousel posts generated 1.5 times higher engagement than standard image posts.
- Posts that include 11 or more hashtags can increase engagement by up to 70%.
- Globally, nearly 1 million businesses use Instagram ads to reach their audiences.
- Instagram ads achieve an average engagement rate of 1.08%.
- 79% of users trust user-generated content more than branded content.
- Shoppable posts influence about 30% of all purchases made on Instagram.
- 60% of global Instagram users are aged 18 to 34 years, making this age group the primary target audience for brands.
How To Sell On Instagram
- Step 1: Set up a strong business profile, a clear profile photo, a simple bio explaining your business, and a clickable shop link to help create a strong first impression.
- Step 2: Build a consistent brand image. A consistent look and message help turn first-time visitors into loyal followers and future customers.
- Step 3: Use Instagram ads strategically. Instagram ads help brands reach the right audience by targeting age, interests, and location, with flexible USD budgets.
- Step 4: Promote existing posts. Boosting high-performing posts is an easy way to start advertising and test results with a small budget.
- Step 5: Use Stories to engage users. Instagram Stories allow daily interaction through polls, replies, and links, improving visibility in the algorithm.
- Step 6: Add product links to Stories. Stories with product links help users move quickly from discovery to purchase.
- Step 7: Create a shoppable Instagram feed. Shoppable posts and link-in-bio tools make it easier for users to buy without leaving the platform.
- Step 8: Offer Instagram-only promotions, Exclusive discounts, and offers to encourage followers to take action, increasing conversion rates.
- Step 9: Work with influencers and hashtags. Influencers build trust, while targeted hashtags help brands reach the right audience and increase engagement.
Conclusion
Instagram is no longer just a photo app; it’s a powerful marketing tool. Brands can reach people, build trust, and grow by sharing eye-catching visuals and real stories. With new features constantly emerging, staying flexible and focused on your audience is essential. Smart Instagram marketing isn’t about more followers, but about creating real connections that help brands grow over time.
FAQ
The main goal of Instagram marketing is to help brands increase awareness, connect with their target audience, improve visibility, and support sales growth.
Content such as high-quality images, short-form videos, reels, stories, and authentic behind-the-scenes posts tends to perform the best on Instagram.
Businesses should aim to post 3–5 times per week to remain visible and engaged without overwhelming their followers.
Hashtags improve content discoverability by helping posts reach users who are searching for or following related topics.
Businesses should avoid posting low-quality content, ignoring audience interactions, and maintaining an inconsistent posting schedule.